
Post a comment on the text below
Fig 2.2a-d shows chemical status with and without uPBTs, as well as the ecological status, by country.
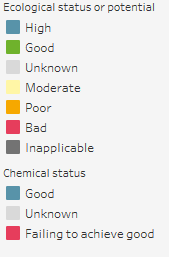
Figure 2.2a shows chemical status by country (EEA, 2018a). A number of countries have reported 100% failure of chemical status owing mainly to pollution by mercury. The 2013 Priority Substances Directive (EU, 2013b) identified 4 groups of substances as “ubiquitous, persistent, bioaccumulative and toxic” (uPBT) (section 1.2). Omitting these from the calculation of chemical status increased overall good chemical status to 81% ((graph C). Meanwhile, ecological status is shown in graph B.
Figure 2.2a: Chemical status in surface waters, with uPBTs
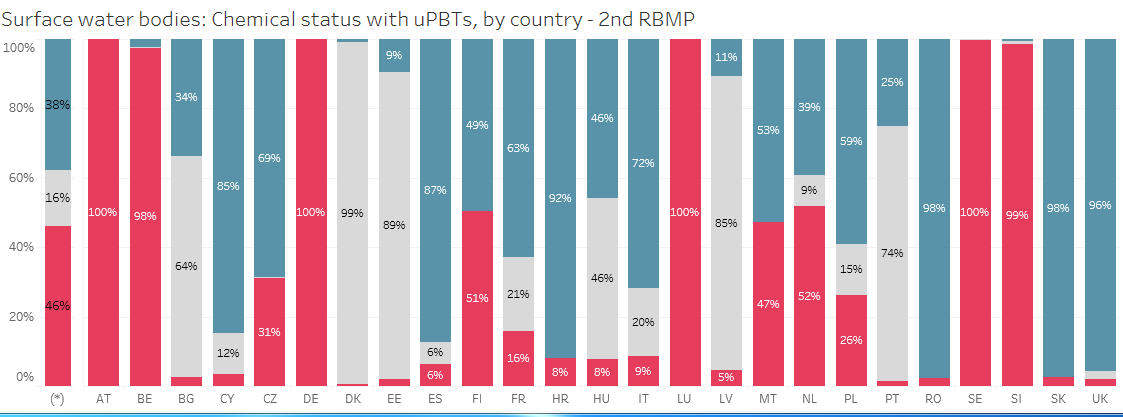
Figure 2.2b: Chemical status in surface waters, without uPBTs
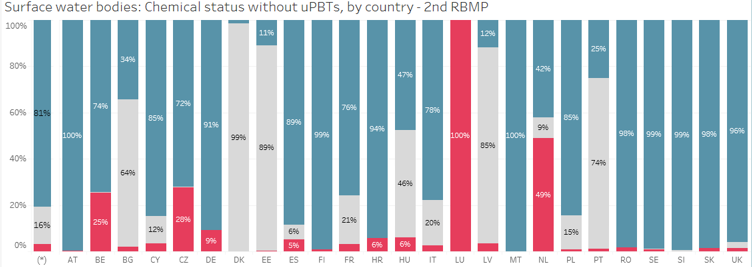
Figure 2.2c: Ecological status in surface waters
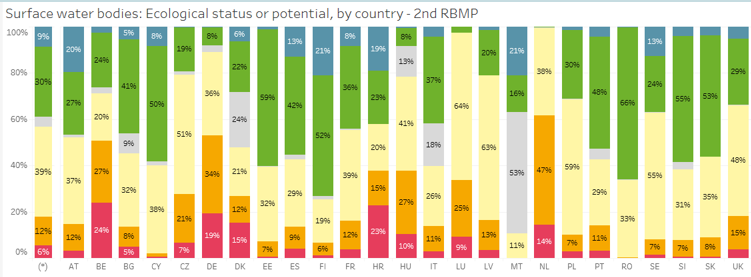
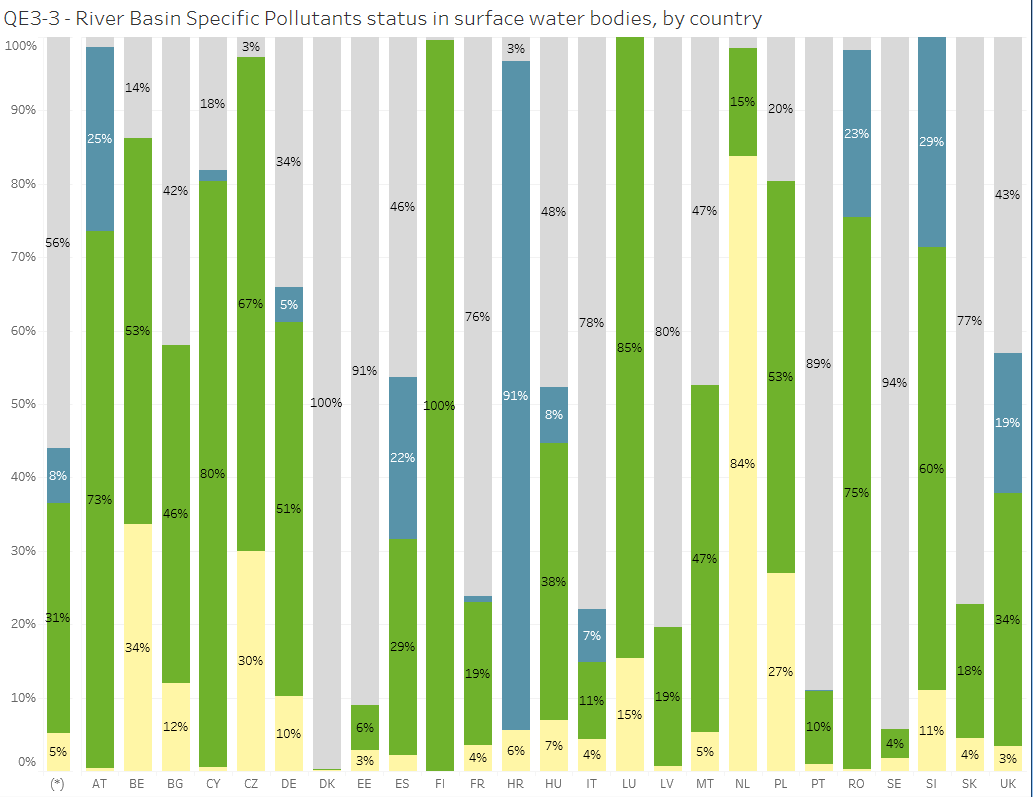
Figure 2.2d: Ecological status of River Basin Specific Pollutants
https://tableau.discomap.eea.europa.eu/t/Wateronline/views/WISE_SOW_SWB_EcologicalStatusChemicalStatusWithoutUPBT/SWB_Status_Country?iframeSizedToWindow=true&:embed=y&:showAppBanner=false&:display_count=no&:showVizHome=no
https://tableau.discomap.eea.europa.eu/t/Wateronline/views/WISE_SOW_QualityElement_Status/SWB_QualityElement_Country?:embed=y&:display_count=no&:showVizHome=no
It is difficult to see what relationship, if any, exists between figures 2.1A-C. It can also be seen that in many water bodies, the RBSPs have not been reported in the assessment of ecological status (Fig 2.1D).
Information on whether and to what extent chemical and ecological status indicators are correlated has the potential to be used to indicate the effects of pressures and, potentially, explain causes of observed ecological effects, providing evidence for decision-makers. The scientific community has proposed diagnostic approaches to unravel links between ecological effects and chemical contamination, and strong interest in this research has been indicated by stakeholders of water management (Brack et al. 2015) (Box 2.1).
You cannot post comments to this consultation because you are not authenticated. Please log in.
Previous comments
DE-NW:
'Meanwhile, ecological status is shown in graph B.'
It shoud be 2.2.c
DE-SH:
Figures: The WFD distungishes betwenn natural and hmw and atrificial water bodies; Not all water bodies have to reach the good status. Please make graphs which show the natural status and the good ecological potential.
DE-UBA IV 1.2:
Figure 2.2a:
Is it correct that there is almost no data available from Denmark?
Omitting these from the calculation of chemical status increased overall good chemical status to 81% ((graph C). Meanwhile, ecological status is shown in graph B.
Comment Belgium (Wallonia): replace by : Omitting these from the calculation of chemical status increased overall good chemical status to 81% ((graph B). Meanwhile, ecological status is shown in graph C.
P13-14 The illustration that is missing is the human health status associated with surface waters
P15 “Diagnostic approaches to unravel links between ecological effects and chemical contamination ….” This is an aim of the current NERC Programme on chemicals