
Table of contents
- Executive Summary
- 1. Introduction
- 2. "Known unknowns” – unregulated micropollutants and chemical mixtures
- 3. Known risks: Key pollutants and their sources
- 4. Strategies to reduce chemical pollution of water
- 5. Improving protection against chemical risks in water
- 6. References
- 7. Annex A: Derivation of emissions data for figures in chapter 2
- 8. General comments
3. Known risks: Key pollutants and their sources
3.1. Introduction
At European level, our knowledge of the chemical status of water is largely based on regulatory requirements, which demand information on well-established, key pollutants. In the WFD, most priority substances are already subject to use restrictions under REACH or pesticides legislation, while river basin specific pollutants (RBSPs) are usually subject to national legislation. So why do we still see failures to achieve good status for these substances? This chapter considers key chemical pollutants and why these continue to pose challenges to good water quality in Europe.
When the assessment of status under the WFD finds a failure, the reasons for that – the “pressures” need to be investigated, as a step towards identifying measures that might be taken to bring the water body to good status. Therefore, here we consider the priority substances most frequently causing failure to achieve good chemical status, and RBSPs most frequently causing failure to achieve good ecological status. For example, improved waste water treatment or altering farming practice can help to reduce harmful chemicals reaching the aquatic environment.
It is important to appreciate that this is where WFD meets chemical source control legislation. Environmental monitoring undertaken for WFD feeds back information to legislation such as REACH, on the effectiveness of the source control. However, because some chemicals are persistent and can remain in the environment for a long time, we also need information on the trend, to assess whether and how concentrations are changing. At a European level, there is limited comparable information about concentrations of hazardous substances over time. To get around that issue, reporting on the trends in chemical emissions can provide complementary information on the status of chemicals in the environment. For the key priority substances, emission data reported under the E-PRTR, WFD and WISE State of Environment reporting are presented. Conclusions about our level of understanding and areas where actions need to be taken, are provided.
3.2. Chemical Status, River Basin Specific Pollutants and Pollutants most frequently exceeding standards in Europe
Under the Water Framework Directive, the chemical status of surface waters is assessed against environmental quality standards (EQSs) for a list of priority substances. EQSs are set to protect the most sensitive species – this could be e.g. algae or invertebrates but also top predators like fish or humans, which may eat many smaller organisms and cause the pollutant to “bioaccumulate”. The first list of priority substances included 33 substances and groups in the Environmental Quality Standards Directive (2008/105/EC). The list of priority substances was updated with the Priority Substances Directive (2013/39/EC)[1].
Box 3.1[1]: Key messages on chemical pollutants from EEA’S RBMP Assessment, 2018
· The WFD data reported by Member States showed that 38% of the surface water bodies within the EU were in good chemical status, while 46% were not in good status and for 16%, the status was reported as ‘unknown’. Compared to the previous assessment results in 2010, the number of water bodies with unknown status had decreased significantly (minus 25%), yet the improvements in chemical status were limited.
· In particular, mercury and polybrominated diphenylethers (used as flame-retardants) caused significant failure to achieve good chemical status in surface waters. Mercury and PAHs now mainly reach the aquatic environment following atmospheric deposition, whereas contamination with cadmium, lead and nickel is caused by discharges from waste water treatment plants or from historic mining areas. As well as the use, the pathway taken by the substance to reach the water body influences the relative difficulty of preventing pollution.
· It seems that for substances such as metals (cadmium, lead, and nickel) and several pesticides, some effective measures have been implemented, with Member States reporting improved status for these substances in some water bodies.
· RBSPs also show chemical contamination, but are regulated under ecological status with regional or national EQS. 5 % of surface water bodies did not achieve good ecological status owing to RBSPs, with 40 % reported as being in good or high ecological status, although 55%, the status of RBSPs was unknown.
· About 165[1] RBSPs were reported as causing failure to achieve good ecological status in at least one water body. Those most frequently reported as causing failure were the metals zinc, with 1503 waterbodies failing to achieve good ecological status, and copper (845). Other types of substances causing most failures were ammonium and elements such as arsenic and selenium. As individual substances, most RBSPs caused fewer than 100 waterbodies to fail good ecological status.
· There are differences in the numbers of substances defined by countries as RBSPs (between 5 and over 300) and differences in environmental quality standards applied. This means comparison between countries should be undertaken with care.
· Of the thousands of chemicals in use and potentially present in surface waters, relatively few have been identified as causing failure. From the information reported, it is not known how many other chemical pollutants are present in surface waters, and whether their concentrations should be of concern.
1 – Numbers updated as at 30/08/2018
A summary of findings for chemical status of surface waters from the recent RBMP assessment is provided in Box 3.1 (EEA, 2018a).
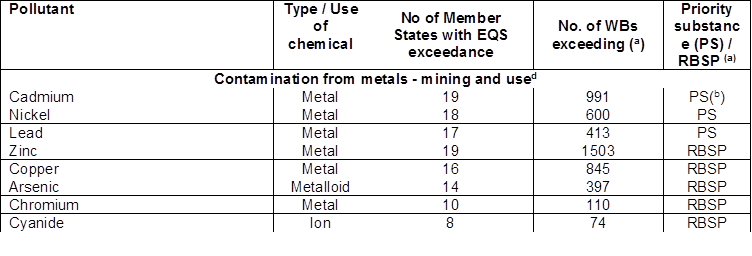
Examining these findings further, the priority substances and RBSPs most often exceeding environmental standards under the recent WFD reporting are shown in Table 3.1. This table shows the priority substances and most of the RBSPs which caused failure in at least 4 Member States[2]. To better understand the pressures causing particular chemicals to cause failure of good status, they are grouped according to the main pressure or pathway generally understood for that substance to reach the aquatic environment. Substances have been included, when exceedances were reported from at least four Member States.
[1] The 2013 Priority Substances Directive contains a revised list of 45 priority substances and groups of substances. In the EEA status and pressures assessment (EEA, 2018a), Member States were required to use report using the 2008 EQSs, though some applied a more stringent approach, using the 2013 EQSs.
[2] A further six natural chemical elements exceeded standards for RBSP in at least four Member States (Barium, Selenium, Boron, Cobalt, Uranium, Thallium).
Table 3.1: List of pollutants most frequently exceeding EQS in surface water bodies in EU25 (out of 111 105 water bodies)
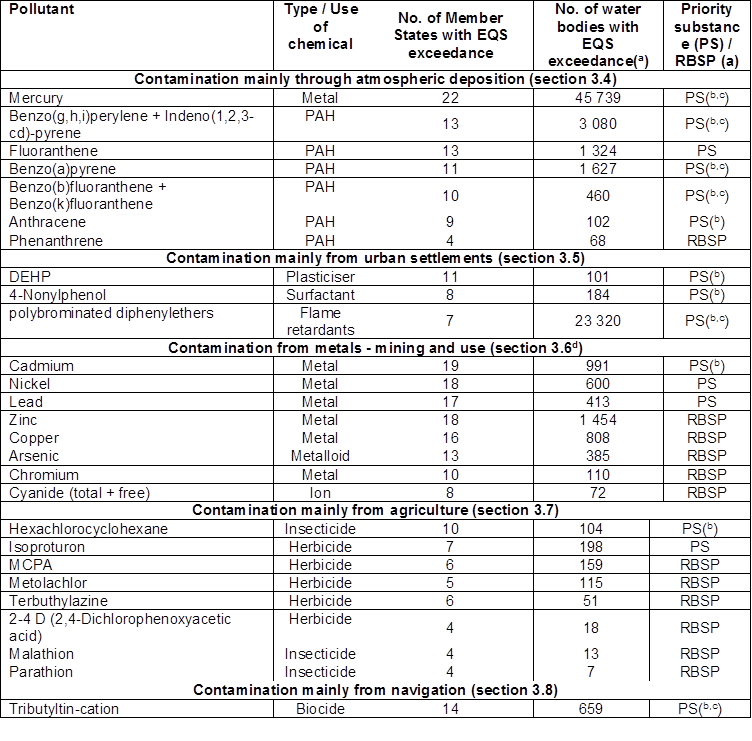
For explanation of criteria and structure of table see text.
Source: WISE-Freshwater WFD accessed 20 August 2018. Data from “EU 25” ie 25 Member States (EU-28 except Greece, Ireland and Lithuania). Priority Substances: https://tableau.discomap.eea.europa.eu/t/Wateronline/views/WISE_SOW_PrioritySubstance/SWB_SWPrioritySubstance?:embed=y&:display_count=no&:showVizHome=no Substance, causing failure Yes, chemical status Failing
RBSP: https://tableau.discomap.eea.europa.eu/t/Wateronline/views/WISE_SOW_FailingRBSP/SWB_FailingRBSP_Europe?:embed=y&:display_count=no&:showVizHome=no ecological status moderate, poor and bad
(a) under the WFD EU-wide standards apply for priority substances (PS), while national or river basin standards apply for River Basin Specific Pollutants (RBSP).
(b) defined as priority hazardous substances, for which all discharges, emissions and losses must be ceased.
(c) Substance is ubiquitous, persistent, bioaccumulative and toxic (uPBT) as defined in 2013/39/EU.
(d) Another 6 chemical elements exceeded standards for RBSP in at least four Member States (Barium, Selenium, Boron, Cobalt, Uranium, Thallium) plus PCBs .
It can be seen from Table 3.1 that chemicals causing most failures of chemical status are mercury and polybrominated diphenylethers (pBDEs). Other substances causing failure do so in much lower numbers of water bodies.
Legacy pollutants
One of the challenges in status assessment is that some chemicals can be present in the aquatic environment a long time after they were originally discharged or emitted. This “persistence” means that even after effective measures have been put in place to prevent pollution, the chemical can still cause poor water quality, because some chemicals do not break down and are instead recycled through sediments, water and organisms. Typical situations are mining districts and those areas which received industrial effluents from when there was little regulation (Box 3.3). In the case of mercury, there is now much regulation to prevent losses, but historic and natural sources (volcanoes) lead to widespread pollution in central and northern Europe, though continued coal burning represents a current source.
3.3. Emission sources and pathways
Having identified the substances causing poor water quality, the WFD requires investigation of the pressures causing that. In the reporting of 2nd RBMPs there is not a direct link between a substance failing in a water body and the pressure(s) causing that. Instead, we looked at reporting under the EPRTR, the WFD inventory of emissions, discharges and losses of priority substances and WISE-State of Environment reporting https://www.eea.europa.eu/data-and-maps/data/waterbase-emissions-5 . The aim was to identify trends in chemical discharges, given the difficulty of disentangling historic pollution from current, so as to see whether emissions are increasing or decreasing.
There are different approaches to recording emissions. One looks at the emissions from a known source – e.g. a manufacturing or waste water treatment plant. This “source-oriented” approach addresses the whole system, starting from the principal sources of substance release. The E-PRTR is an example of this, where emissions of particular chemicals above a certain amount per year must be reported by the operator. Pathways are the routes by which substances can be transported to the aquatic environment, with the “pathway-oriented” approach modelling where pollutants may be temporarily stored (e.g. in soils) before eventually reaching surface waters through other processes e.g. erosion or storm water overflows. The “riverine load oriented approach” estimates the observed total load in the river and can include an estimate of the diffuse inputs. Riverine loads describe the mass of the pollutant transported in the river. Both the WFD inventory and WISE SoE emissions reporting allow reporting under each of these three approaches. While accommodating different approaches, these diverse methods can make it difficult to compare results.
Both point source – from a known discharge – and diffuse source – from multiple sources in an area - should be covered by emissions reporting. In practice, reporting from point sources is generally more straightforward, dominating emissions reports.
A general scheme setting out principal sources, pathways and intermediates has been developed under the WFD for the Inventory of emissions, discharges and losses of priority substances, shown in Figure 3.1 (EC, 2012) .
Figure 3.1 Relationship between the different surface water compartments and pathways (P1-P13) (EC, 2012)
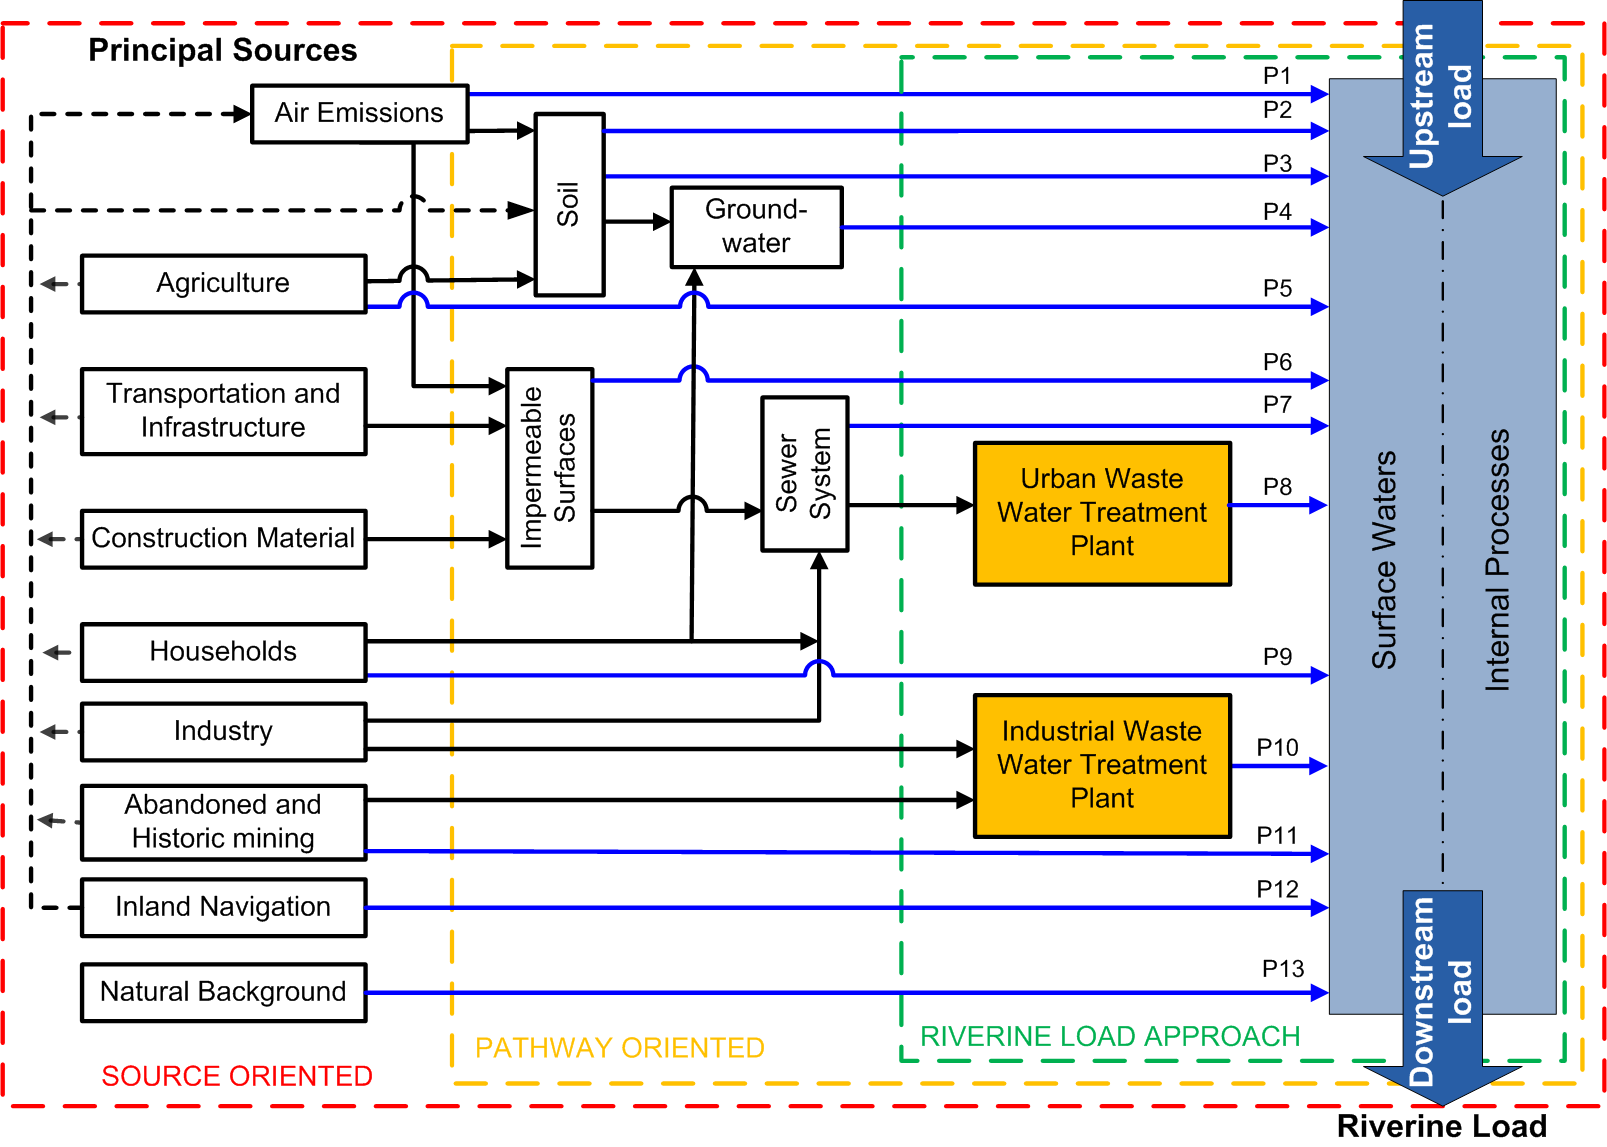
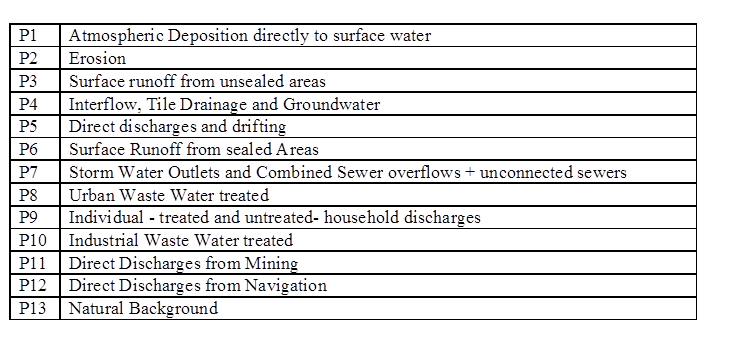
Figure 3.1 provides a way to compare emissions reported under the different approaches. On the left, the principal sources of the pollutants are shown, representing groups of sources. Emissions, discharges or loads can follow different pathways, either directly to surface water, or to other compartments of the environment (air, soil, groundwater), represented by the middle section of the Figure. Emissions can be the result of losses during the production or as a result of the use of products. A part of the wastewater from industry and households is collected in a sewer system and treated in industrial waste water plants (P10) or urban waste water treatment plants (P8) (UWWTPs), on the right hand side of the Figure.
In this chapter, main pathways are considered but substances have more ways of entering the aquatic environment.
Emissions datasets provided in Figures 3.2 to 3.14 (tables A1 to A9 in Annex A).
E-PRTR are data from large sources, either industry or urban waste water treatment plants serving over 100,000 people (or equivalent). Data have been reported under this EU obligation since 2007.
WFD is reporting of the emissions inventory for each river basin district, required for priority substances for the first time in the 2nd RBMPs, for the year 2010.
WISE reporting is voluntary reporting of emissions by EEA’s member countries.
“Estimated diffuse 2010” are those from a project calculating diffuse loads to surface water (Roovaart et al (2013a, 2013b).
The WFD inventory should contain information on priority substances. Emissions data below therefore focus on emissions reporting of priority substances, though more information is available on RBSPs (https://www.eea.europa.eu/themes/industry/industrial-pollution/ ; Roovaart et al, 2017).
What should the emissions data tell us?
In the tables, the lowest emissions estimate would be expected to be the E-PRTR, as these reports include emissions from large installations only. We would expect WISE SoE data to be the same or higher as E-PRTR. WFD data, which should include all the losses, emissions and discharges ought to be higher than E-PRTR. However, this is often not the case and it is unclear which are the most accurate values.
The WFD inventory reporting was expected to provide data on emissions of priority substances into each river basin. Study of the emissions therefore focused on the priority substances identified as key pollutants in Table 3.1. However, owing to the limited reporting, and poorly comparable data, rather little information can be gleaned from the WFD emissions inventory.
Specific details on the emissions datasets can be found in Annex A.
3.4. Contamination through atmospheric deposition
EEA’s RBMP Assessment (2018a) showed that atmospheric deposition was the major source of contamination of Europe’s surface waters.
Table 3.1a: List of pollutants most frequently exceeding EQS in EU25

(a) under the WFD EU-wide standards apply for priority substances (PS), while national or river basin standards apply for River Basin Specific Pollutants (RBSP).
(b) defined as priority hazardous substances, for which all discharges, emissions and losses must be ceased.
(c) Substance is ubiquitous, persistent, bioaccumulative and toxic (uPBT) as defined in 2013/39/EU.
3.4.1. Mercury and its compounds
Sources and uses
Mercury is a natural substance. It can enter the environment from coal burning and industrial processes such as in the chlor-alkali process for commodity chemicals, cement manufacture and in small-scale gold mining. It is also released during volcanic eruptions. Mercury has had many historical uses which have since been phased out (e.g. thermometers, dental amalgam, hat making). It has no known essential function for living organisms.
Toxicity and EQS
Mercury and its compounds are toxic and can accumulate in the food chain. Microbial methylation can occur in water, converting inorganic mercury to more toxic organo-mercury compounds. Methylation can also occur in organic environments like organisms and in humic substances, and is thought to be one of the reasons that “unpolluted” areas like Scandinavia show high mercury content in biota (Pirrone et al., 2010).
The EQS is derived to protect predators such as sea eagles or otters from secondary poisoning through eating contaminated fish. In particular, it protects against methyl mercury, which accumulates in the food chain. Fish consumption can be an important source of mercury to humans, where fish plays a significant role in the diet.
Figure 3.2 : Mercury

Loads given in these figures cannot be summed, as there may be double counting.
WFD status
Mercury and its compounds are ubiquitous priority hazardous substances, and caused failures to achieve good chemical status in nearly all Member States, to a total of 41 % of Europe’s surface water bodies. Despite it being a well-characterised, historic pollutant, there was widespread variation in the degree to which mercury did not meet the EQS – from 1-100% surface water bodies.
If comparing results between countries, it should be noted that there were different approaches towards monitoring and reporting of mercury for the second RBMPs. Member States could monitor in water, sediment and/or biota, and there were different approaches towards interpreting the data. Some countries extrapolated failure to meet the standard at monitoring sites to all water bodies, while others reported failure only where failure was confirmed (EEA, 2018a). Typically, measurements of mercury in biota extrapolated to all similar water bodies lead to widespread failure to meet the EQS.
Emissions
The concentrations of mercury in water depend on geology, historical pollution in sediments, concentrations in precipitation and industrial emissions. Mercury can enter surface waters through direct emissions, such as from urban waste water treatment plants and industry. As it is readily released as a vapour, it can be widely-distributed through atmospheric deposition in dust and rain.
Figure 3.2 summarises data available for mercury emissions to water for Europe. Many countries report mercury emissions, giving confidence in the data. For 2015, a conservative total of mercury to European surface waters is estimated at being 2 t from industry, 4 t from urban waste water treatment plants (UWWTPs), and 2.5 t direct deposition from the atmosphere.
Emissions from UWWTPs are known to be under-reported (Roovaart et al., 2013b). In 2010, these missing emissions were estimated as being 8.4 t. Data reported under WISE for 2014-2015 indicate atmospheric deposition as an important pathway, corroborating the information provided under WFD. Modelled atmospheric deposition of approximately 44 t deposition on the whole EU area (land and surface water) modelled by EMEP (EMEP, 2017) (Box 3.1). A significant part of this 44 t will end up in the surface water via the pathways erosion and run off from paved surfaces.
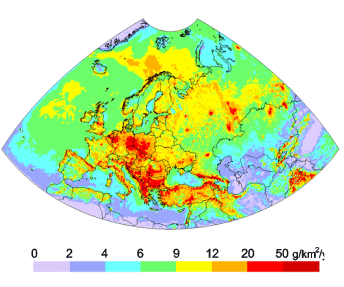
Box 3.1: Modelling atmospheric emissions of mercury
Modelled data for emissions of mercury to air go back further in time than direct emissions, providing more information on trend over time. According to modelled emissions to air (EMEP, 2017) the trend in Europe is declining from 109 ton in 2005 to 63 ton in 2015. In map 2.1, the deposition of anthropogenic emissions in 2013 is shown (EMEP, 2017). In Europe, the derived anthropogenic mercury deposition is almost equally from European and foreign emissions.
MSC-E, 2016, http://www.msceast.org/index.php/pollution-assessment/and-more
Map 3.1: Simulated annual mercury total deposition flux in 2014 over the EMEP domains
Summary/outlook
That mercury emissions have in decreased over recent decades is unlikely to result in an improvement in chemical status of surface water bodies. Mercury will continue to be recycled between water, sediments and biota. Meanwhile, mercury which is transported to marine waters concentrates in top predators such as tuna and shark, leading to advisory restrictions on human dietary intake.
Atmospheric deposition is an important source of mercury to European surface waters, but it is not the only one and not the largest. Loads from atmospheric deposition and from industry are declining as a result of action to reduce emissions. However, further effort to reduce emissions of mercury from urban waste water treatment plants, either upstream or before discharge, seems necessary.
3.4.2. Polycyclic aromatic hydrocarbons (PAHs)
Sources and uses
PAHs are a natural component of coal and oil, historically being used in wood preservatives and tar products. They are mainly formed by incomplete combustion of organic material, such as coal, petrol and wood, and are commonly released into the atmosphere as small particulates (Abdel-Shafy and Mansour, 2016). Sources to the European environment now include vehicle exhausts, coal-fired power generation, domestic heating and forest fires.
Toxicity and EQS
The PAH substance group comprises a large number of substances, with different toxicities and environmental fates (EC, 2011a). EQS have been set for seven of the most toxic PAH, as representatives of the whole group. Two of these are separately listed (anthracene and fluroanthene) while the other five are grouped, with the “lead substance” being benzo(a)pyrene.
PAHs cause cancer (e.g. they are present in cigarette smoke). The EQS is set to protect humans, who are the most sensitive species through consumption of fishery products.
WFD status
PAHs cause failures to achieve good chemical status in 100s-1000s surface water bodies (table 3.2), across 9-13 Member States. There is however some skewing of the results – over 1000 water bodies failed for benzo(a)pyrene in Germany and for benzo(g,h,i)perylene + Indeno(1,2,3-cd)-pyrene in France.
Emissions
For most PAHs, only a limited number of countries report emissions from industry and UWWTPs. There is more reporting of fluoranthene and anthracene, but still from fewer than half of European countries. This limited reporting means that trends can be skewed by one-off reporting of high loads[1].
Figures 3.3-3.5 give an overview of the different reported loads for anthracene, benzo(a)pyrene and fluoranthene. For all PAHs, industry and UWWTPs seem to be significant sources. Atmospheric deposition directly to surface water is the largest reported pathway, taking into account the small number of countries that report.
Figure 3.3 :Anthracene
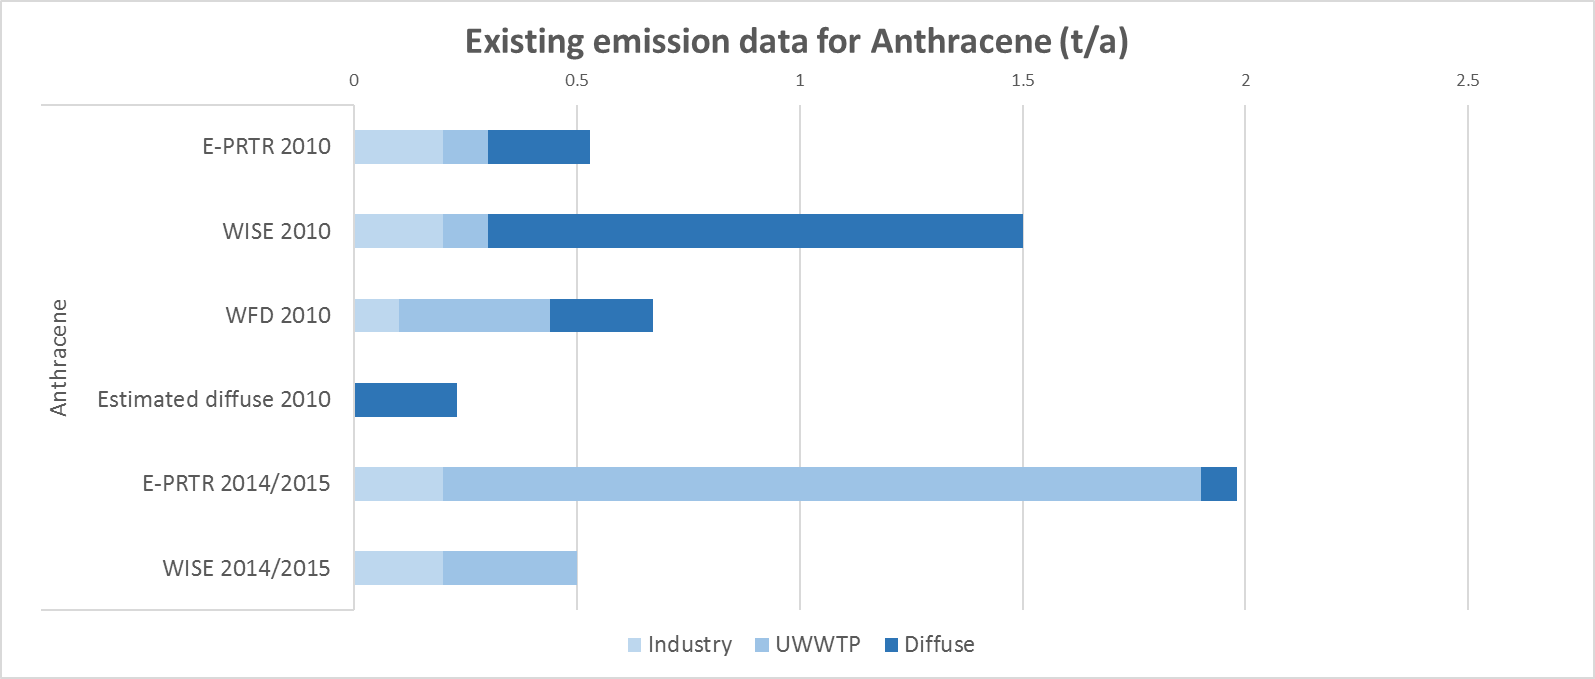
Figure 3.4 : Benzo(a)pyrene !!!
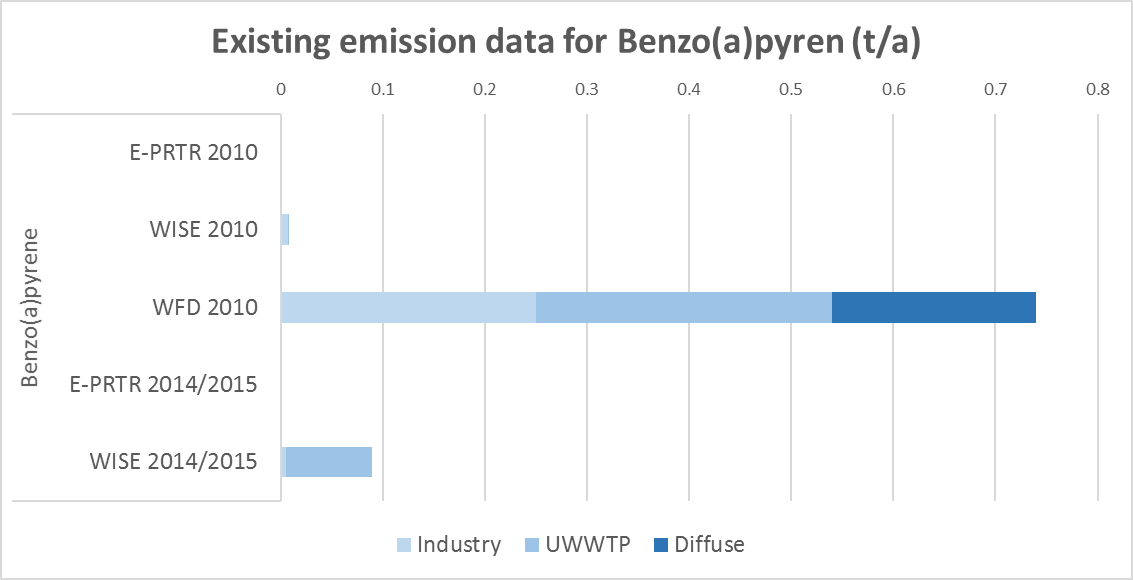
Figure 3.5 : Fluoranthene
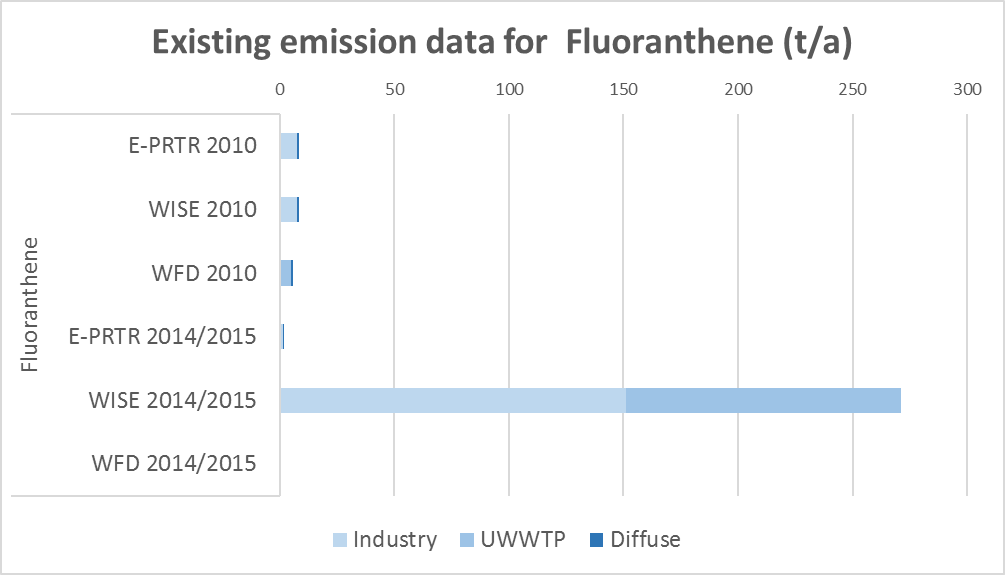
Notes: !!! – CAUTION – low confidence in data, as limited reporting of this substance, see Table 3.2. Details on the emissions data are given in Annex A.
An overview of the total emissions to water in Europe cannot be given for the PAHs. The data appear to be too inconsistent to assess any trends, owing to the limited number of countries reporting and inconsistent reporting between datasets.
Emissions to air have fallen substantially since 1990 (EEA, 2018c). The main sources to air are now from industry and domestic use.
Summary/Outlook
As atmospheric pollutants with multiple sources arising from the burning of organic matter, reducing the pollution of water bodies by PAHs will remain challenging. A shift to electric vehicles could reduce some diffuse sources, while that from domestic heating (as wood or coal) requires sustained and significant effort.
The low level of reporting of emissions of well-characterised pollutants such as PAHs is disappointing. There is a need for improved understanding of pressures from emissions reporting to be able to implement effective measures to reduce pollution of water by PAHs.
3.5. Contamination from urban settlements
EEA’s RBMP Assessment showed that contamination from urban waste water treatment was the major point source of contamination of Europe’s surface waters. Note that in most cases treatment plants are recipients of contaminants from upstream uses and discharges, providing a known pathway into the aquatic environment, rather than they themselves being the user of hazardous substances.
Table 3.1b : List of pollutants most frequently exceeding EQS in EU25
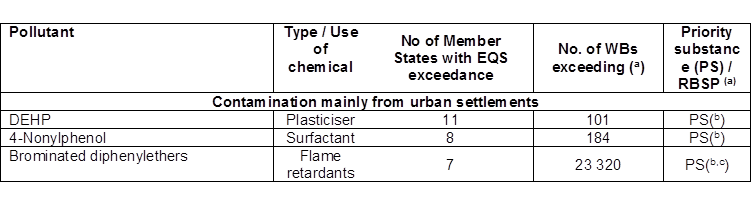
(a) under the WFD EU-wide standards apply for priority substances (PS), while national or river basin standards apply for River Basin Specific Pollutants (RBSP).
(b) defined as priority hazardous substances, for which all discharges, emissions and losses must be ceased.
(c) Substance is ubiquitous, persistent, bioaccumulative and toxic (uPBT) as defined in 2013/39/EU.
3.2.1. Bis(2-ethylhexyl) phthalate (DEHP)
Sources and uses
DEHP is a widely-used phthalate, for example as a plasticizer in the manufacture of PVC. It has other uses, such as in hydraulic fluid, as a dielectric fluid in capacitors, sealing compounds in buildings and an additive in paints, cosmetics and biocides. Although its use is being phased out under REACH, DEHP’s widespread use in e.g. plastic water pipes represents a potential source to the environment for many years to come, owing to the long lifetime of those products.
Toxicity and EQS
DEHP is persistent in sediments and soils, but does not bioaccumulate in organisms. The main harmful effect is endocrine disruption to aquatic organisms, adversely affecting reproduction and growth.
WFD status
Despite its widespread use, DEHP caused failures in relatively few water bodies (table 3.1). This may be because it is relatively well removed by conventional waste water treatment, concentrating into the sludge (Gardner et al, 2014).
Emissions
Figure 3.6 gives an overview of the different reported loads.
Figure 3.6 : DEHP
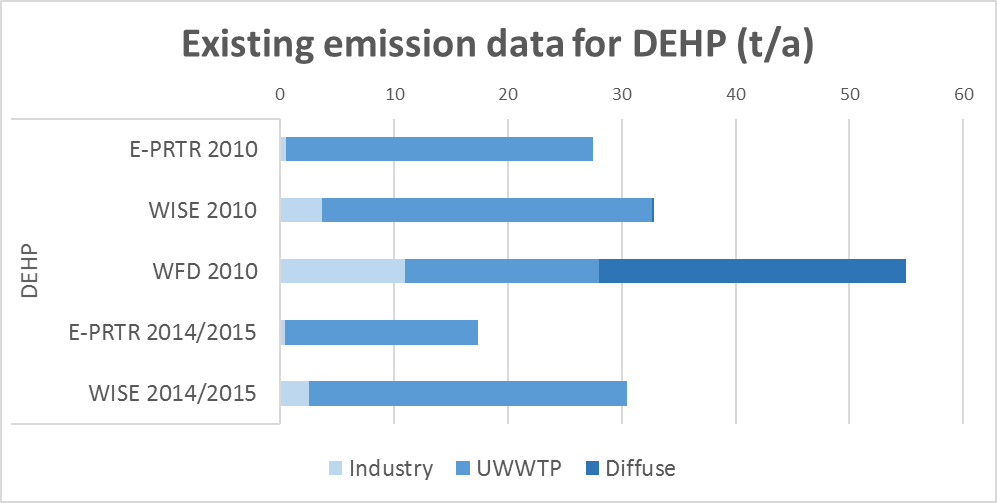
About half the Member States, plus Norway, reported DEHP loads from industry and UWWTPs, showing that UWWTPs represent the most significant point source. There is a declining trend in reported loads from industry, while trends from UWWTPs are harder to assess owing to large fluctuations in some reported loads. Emissions of diffuse sources are difficult to compare owing to different approaches used by different countries and low levels of reporting. Important diffuse sources seem to be stormwater overflows and households not connected to the sewerage system.
Summary/Outlook
The major source of DEHP appears to be from UWWTPs, though diffuse sources may also be significant (Fig 3.6). Over time, the replacement of DEHP in plastics should lower the concentrations of DEHP reaching UWWTPs.
While it is hard to assess trends from the existing data, the decades-long lifetime of products containing DEHP would suggest that chemical status is unlikely to change much without significant effort to reduce emissions from the UWWTPs, whether that is at the plant itself or by preventing discharges into the sewerage system, e.g. through waste controls.
3.5.2. Nonylphenol
Sources and uses
Nonylphenol is a precursor in the production of nonylphenol ethoxylates (NPE), used in manufacturing as antioxidants, lubricating oil additives, emulsifiers and as solvents. It acts as a surfactant, such as in wetting agents or detergents, and can be found in paints, pesticides, imported textiles and personal care products. Where NPE was used in clothes, much of it seemed to enter the sewerage system following washing in domestic washing machines (Environment Agency, 2013).
In urban waste water treatment, nonylphenol ethoxylates break down to nonylphenol.
Toxicity and EQS
Nonylphenol is toxic for aquatic organisms, particularly for algae and invertebrates (CIRCABC, 2005). It has endocrine-disrupting effects particularly on fish.
WFD status
Nonylphenol was reported as causing failure to achieve good chemical status in 8 Member States, mainly in western Europe. Half the failures were reported as being in France.
Emissions
Figure 3.7 gives an overview of the different reported loads.
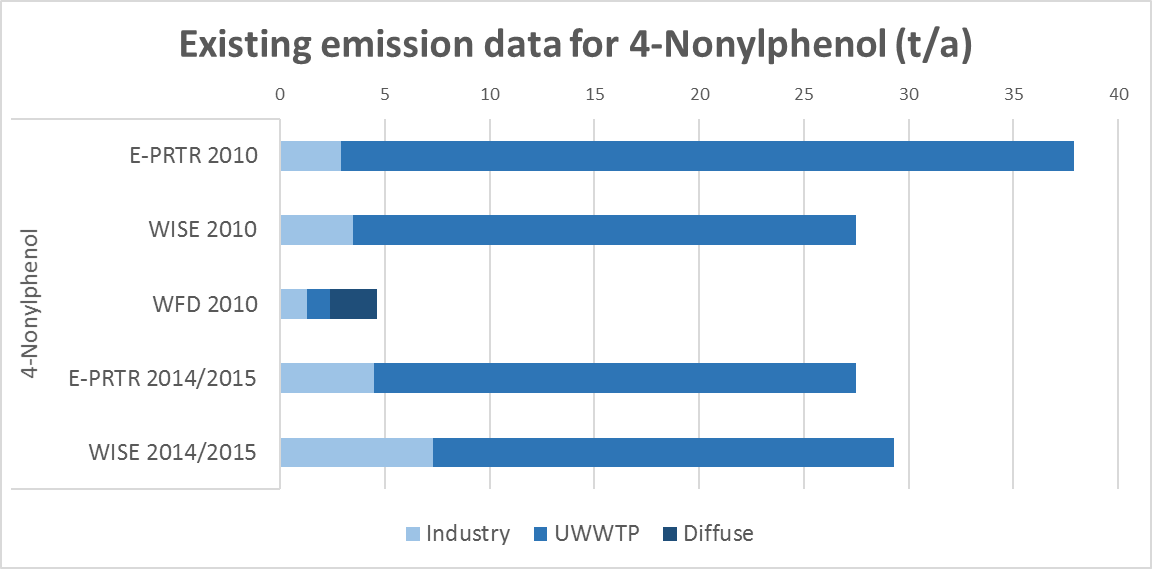
About half the Member States, plus Norway, reported loads from industry and UWWTPs. Trends for industry seem to be increasing, but those for UWWTPs seem to be decreasing. A few Member States reported diffuse sources for the WFD inventory, suggesting that unconnected households, stormwater overflows and run-off were the main pressure, but limited reporting makes assessment difficult.
Overall, it is difficult to be confident in the emissions data for nonylphenol, because extreme differences between Member States suggest different approaches to monitoring or quantification.
Summary/Outlook
Restrictions on the use of nonylphenol and NPE should lead to a decline in emissions to water. Nonylphenol is not persistent (Mao et al, 2012) so it should cause fewer failures to achieving good chemical status in surface waters in future.
3.5.3. Brominated diphenylethers (pBDEs)
Sources and uses
Polybrominated diphenylethers (pBDEs) are a group of 209 substances which have been used in many products as flame retardants. They have been used, for example, in electronics, furniture and textiles (EPA, 2017).
Toxicity and EQS
pBDEs are ubiquitous in the environment and some are restricted under the Stockholm Convention owing to their widespread use, very persistent and bioaccumulative properties. A group of 6 representative pBDEs is regulated under the WFD[2]. The EQS is set to protect human health from pBDEs consumed in fishery products.
WFD status
The EQS for pBDEs was exceeded in 21% of surface water bodies. Seven Member States reported failures to achieve good chemical status for pBDEs, the vast majority of which were in Sweden (23 185 water bodies of the total 23 320 not meeting the EQS) (see Table 3.1).
Emissions
Figure 3.8 gives an overview of the different reported loads. !!!
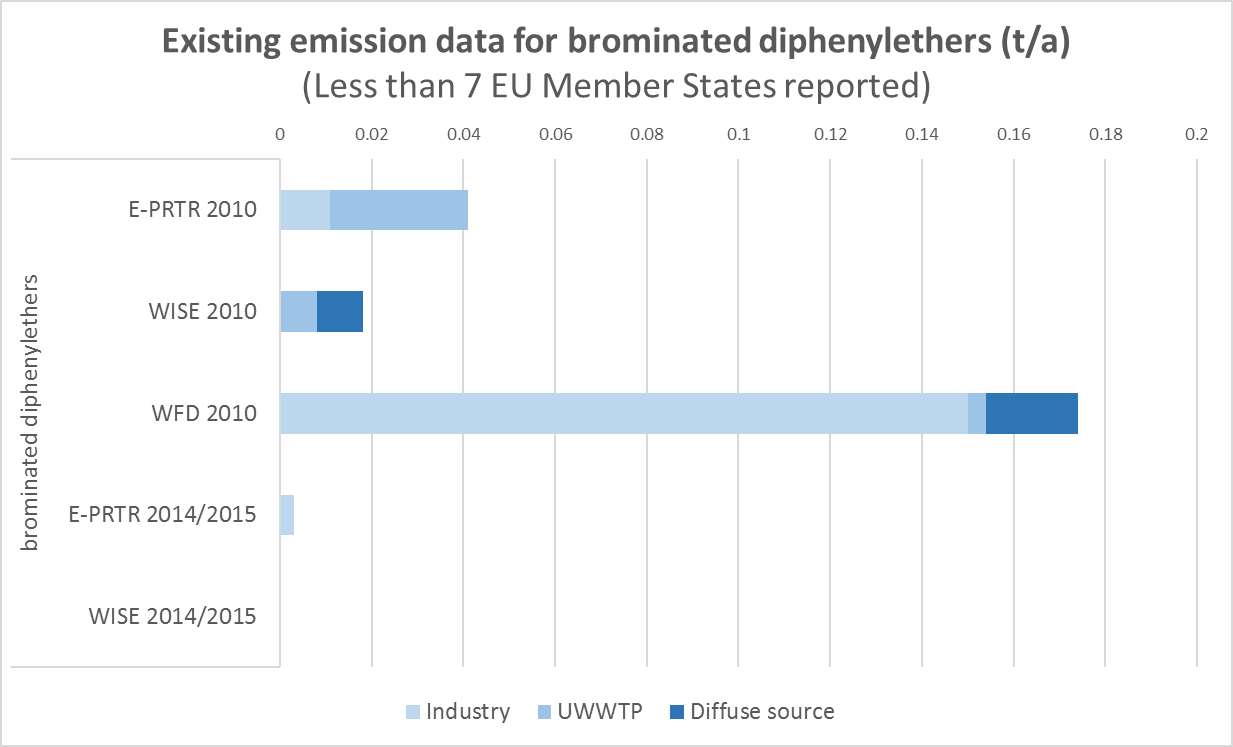
Notes: !!! – CAUTION – low confidence in data, as limited reporting of this substance, see Table 3.2. Details on the emissions data are given in Annex A.
There is very little reporting of emissions of pBDEs. The few Member States reporting to the WFD inventory show highest loads from industry, followed by diffuse sources and UWWTP. The few reported diffuse loads suggest atmospheric deposition and households may be relevant sources. In consequence, it is difficult to offer anything quantitative about total emissions to water in Europe, or to discuss trends. Studies can offer some insight (Box 3.2)
Box 3.2 – pBDEs in fish in German rivers
Germany shows widespread and very high exceedance of the EQS (shown by red line) in fig. B3.2, top. Trends between 1995 and 2013 vary between different rivers. The Rhine shows decreasing concentrations, while concentrations in other rivers are mostly increasing.
Fig. B3.2: Brominated diphenylethers in fish of the German Environmental Specimen Bank (left: concentrations 2013; right: trends Year 1995 – Year 2013)
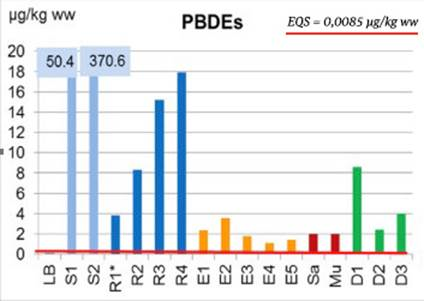
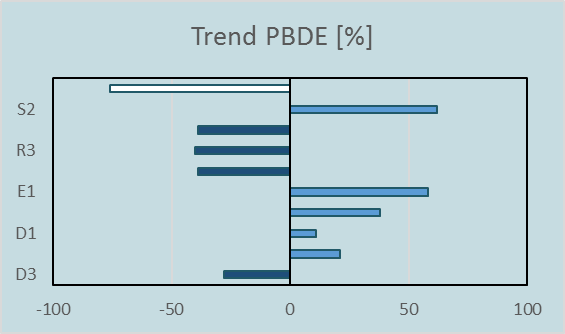
Note: In top chart, letters stand for different lakes and rivers: LB – Lake Belau, S – Saar, R – Rhine, E – Elbe, Sa – Saale, Mu – Mulde, D – Danube. The red line just above horizontal axis shows the EQS of 0.0085 ug/kg. In the lower hand chart, dark bars show trend of decreasing concentrations of pBDEs in fish, blue bars show increasing trend in concentrations.
Source: Fliedner et al, 2016
In contrast to many substances used historically, such as mercury, pBDEs began to be widely used as flame retardants only in the early 1990s. Environmental concerns began to be identified within a few years, with a Directive setting out restriction on use of pentaBDE and octaBDE in 2003 (EC, 2003). In 2008, PBDEs were included in the list of priority hazardous substances under the EQS Directive and in 2009, pentaBDE and octaBDE were listed under the Stockholm Convention (section 1.3). The European Food Safety Agency issued scientific opinions on brominated flame retardants in the food chain 2010-12. Thus regulatory action began relatively rapidly, reflecting the improved understanding of harmful chemicals in the environment and legislative means to act.
Such emissions and pressures information as are reported by countries available suggest that it is not clear how pBDEs are reaching the aquatic environment. The widespread contamination reported by Sweden was attributed to atmospheric deposition. Pathways to soil and water, through waste disposal and washing (which allows pBDEs to enter the sewers and hence UWWTPs) show that most of the pBDEs bind to solid matter (Anderson and MacRae, 2006; North, 2004; Zhang, et al, 2017). Other researchers report a significant atmospheric transport role (Ricklund et al, 2010; Earnshaw, et al, 2013) though brominated flame retardants were not associated with emissions of soot or small particles (Egeback et al, 2012).
Summary/Outlook
One of the striking features about pBDEs is the apparent mis-match between WFD status and emissions reporting. Most Member States reported no emissions of pBDEs under E-PRTR or WISE, with only four Member States reporting some under the WFD inventory.
While the large number of surface water bodies failing for pBDEs can currently be attributed to Sweden, it seems likely that more Member States will report failing chemical status for them in future. This is because of a change in the way in which the EQS is to be measured (from water to concentrations in biota). In the 2nd RBMPs, Sweden applied this new EQS to its chemical status assessment: in future, so will other countries. Although many pBDEs have now been restricted, owing to their chemical behaviour and persistence, it seems likely that they will continue to cycle between biota and sediments for many years.
It is not clear that we fully understand the major transport pathways for pBDEs into the aquatic environment. There is a need to better understand the environmental pathways of pBDEs, to identify whether measures can be implemented which would limit further dispersal.
[1] WISE 2014/2015 Fluoranthene, Industry: 150 t by one country, 0.7 t by 12 other countries; WISE 2014/2015 Fluoranthene, UWWTP: 120 t by two countries, 0.2 t by 5 other countries.
[2] For the group of priority substances covered by brominated diphenylethers, the EQS refers to the sum of the concentrations of congener numbers 28, 47, 99, 100, 153 and 154. Four of them: Tetra, Penta, Hexa and Heptabromodiphenylether (CAS -numbers 40088-47-9, 32534-81-9, 36483-60-0, 68928-80-3, respectively) are regulated as priority hazardous substances.
3.6 Contamination from metals - mining and use
Metals have been used for centuries in many different applications. As well as leading to high concentrations in naturally metalliferous areas, their extraction and processing have led to polluted districts - even long after mines have closed down (Box 3.3). Widespread use of metals in industry, and subsequent discharge to water also continues to cause pollution, as metals are transported within the water column and its sediments.
Box 3.3: Ancient Mining in the Harz Mountains in Germany
Metals e.g. lead and cadmium exceed the EQS in the Harz Mountains foothills of Weser River in northern Germany. For centuries, it was one of important ore mining regions of Germany. The mining activity mainly closed down in the 1930s and in 1992 the last mine closed. Around the mines are a large number of tips and chemical and metallurgic industry. The rivers most contaminated are some tributaries of the Leine River, which has a catchment area of about 6.500 km². Metal contamination down the river is visible until the estuary of the Weser in the North Sea.
The river and floodplain sediments have been contaminated with the waste and mine water over centuries. In the floodplains high lead and cadmium concentrations affect the agriculture at pasture and arable land along the river floodplains. Livestock farming and agriculture is possible in limited form only. [Owing to the large area affected,] decontamination would be very difficult and lowering concentrations of the metals in the rivers represents a long term effort (FGG Weser, 2016). Similar contamination and effects on waters are seen all over Europe in old mining regions.
Map 3.2, Metal pollution from mining areas in the Harz catchment.
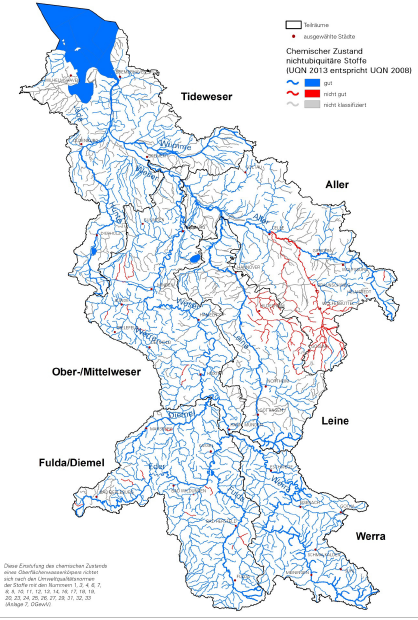
Source: http://www.fgg-weser.de/component/jdownloads/send/8-eg-wrrl/331-bwp2015-weser-final-textteil-160318
Table 3.1c: List of pollutants most frequently exceeding EQS in EU25
(a) under the WFD EU-wide standards apply for priority substances (PS), while national or river basin standards apply for River Basin Specific Pollutants (RBSP).
(b) defined as priority hazardous substances, for which all discharges, emissions and losses must be ceased.
Sources and uses
Metals are natural substances and have been mined for centuries and used in many different ways, from producing tools, vehicles and buildings to sophisticated applications in industrial processes, as well as numerous domestic applications. Some historic uses shown to be particularly harmful, and so restricted, include the use of lead in water pipes and as a petrol additive. (Mercury is discussed in section 3.4.)
Metals reach the aquatic environment in many ways, reflecting their multiple uses. Rainfall may leach them from mines, industrial or waste sites, they may be discharged in effluents to sewers or directly into rivers, lakes, etc. Being natural elements, metals do not degrade, although they can be converted to other forms which may be more or less harmful. Many dissolved metals can bind to suspended material and sediment and be transported downstream, or recycled within a water body.
Toxicity and EQS
Since metals occur naturally in the environment and some metals are essential elements for living beings, it is not always easy to assess when concentrations start having negative or even toxic effects. These can vary for individual species and the environment conditions.
The solubility and bioavailability of metals are influenced by pH, organic compounds naturally present in water (such as humic substances) and calcium. Ecotoxicological effects are exacerbated in soft water (i.e. low lime content) and low pH. Increasing knowledge about the detrimental impacts of metals have led to extensive monitoring and research into the ecotoxicological effects. Modelling of metals under such differing conditions has been undertaken to assess their bioavailability, allowing assessment of measured concentrations with the bioavailable concentration. This can be used to target measures where the metals present most risk to aquatic organisms. The 2013 Priority Substances Directive included bioavailable EQS for nickel and lead.
The EQS for cadmium and lead are set to protect invertebrates, while that for nickel is set to protect algae and molluscs.
WFD status
Among the 15 priority substances most frequently causing failure to achieve good chemical status are the metals mercury (discussed in section 3.4), cadmium, lead and nickel. This may reflect a relatively high level of reporting for metals, with approximately 2/3 Member States reporting failures to achieve chemical status for these substances. An additional five metals – zinc, copper, arsenic, chromium and cobalt - are among the most frequently-reported RBSPs causing failure of ecological status. There were more failures in surface water bodies for zinc and copper than for many of the priority substances.
Despite widespread use, failures to achieve good chemical status for cadmium, lead and nickel range from 413-991 (table 2.1) in surface water bodies. Member States are making progress with these metals - 969 water bodies improved from poor to good chemical status from the first RBMPs, though 2288 water bodies were still failing (EEA, 2018a).
Emissions
Figures 3.9-3.11 give an overview of the loads reported under different mechanisms.
Figure 3.9 : Cadmium
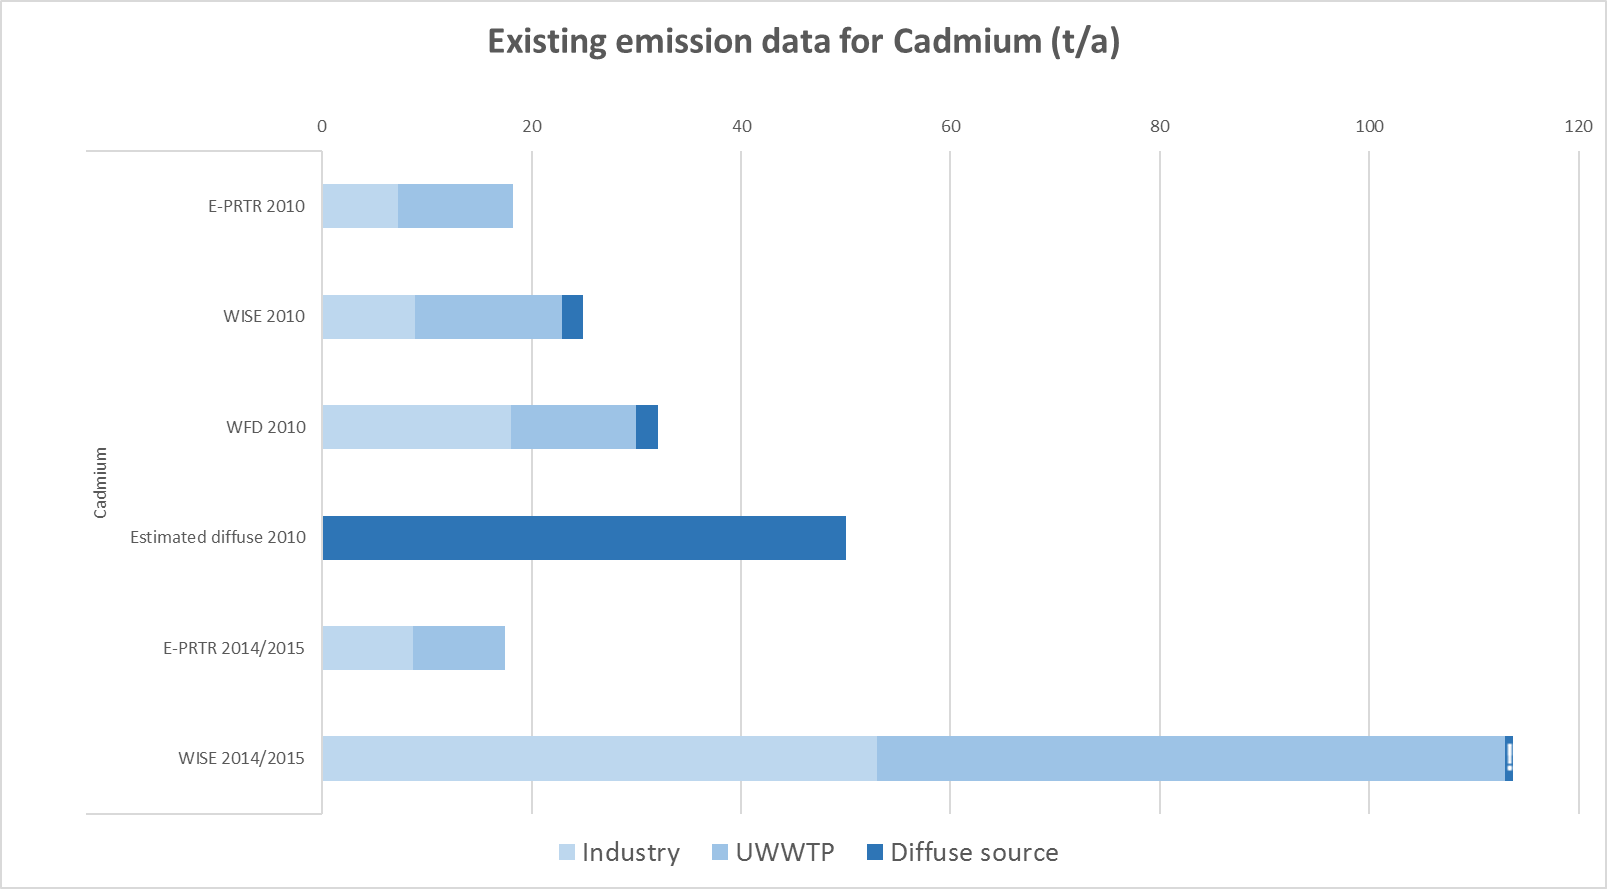
Figure 3.10 : Nickel

Figure 3.11 : Lead

Loads given in these figures cannot be summed, as there may be double counting.
For other metals, there are limited, comparable, emissions data as the WFD inventory only includes priority substances. Further information on E-PRTR reported emissions of zinc and copper are available at https://www.eea.europa.eu/themes/industry/industrial-pollution/ and in Roovaart et al. (2017).
There is a high level of reporting of metals for emissions from industry and UWWTPs. UWWTPs are the largest known source for cadmium and nickel, while for lead it is industry. However, Roovaart et al. (2013) suggested that there was significant under-reporting for emissions from UWWTPs for all three metals. Reflecting the widespread use of metals, countries reported a range of diffuse sources from agriculture, atmospheric deposition, unconnected households, storm water overflows, transport and run-off.
However, despite high levels of reporting of metals emissions, the overall trend is not clear, with high variability from year to year.
Between 2007 and 2014, arsenic and copper emissions reported under the E-PRTR for industry excluding UWWTPs showed no clear trend, while there was a decrease in zinc emissions (Roovaart et al, 2017). For UWWTPs reporting under E-PRTR, there was a slight increase in copper and zinc emissions, with a large increase in reported arsenic emissions from one country.
Summary/Outlook
Both research into the behaviour of cadmium, lead and nickel in the aquatic environment, and regulation around that, has been undertaken for decades. While there are still a significant number of surface water bodies failing to achieve good chemical status for metals, there are promising signs that further improvements can be made.
Forthcoming challenges may include the behaviour of metals as “co-contaminants”, where their presence at low levels may exacerbate the toxicity of other chemicals present in the same water body (chapter 2).
3.7. Contamination from agriculture
The aim of pesticides and biocides is to have a harmful effect at the point of use, protecting crops and ensuring food security. However, owing to direct application into the environment, effects on organisms can occur beyond the intended target.
Data reflecting actual emissions of pesticides are often few, despite widespread use. This partly reflects many diffuse sources, for which reporting is in any case weak, and also owes to the way that water and pesticides legislation affects reporting at the European level (Box 3.4). For this reason, trends in pesticide sales have be taken as a proxy for emissions, though this must be seen as indicative and provides little geographic information.
EU sales statistics were relatively stable between 2011 - 2014, with 360 000 - 400 000 t sold per year (Eurostat, 2018). The group with the highest sales were fungicides and bactericides (about 43%), followed by herbicides (35%) and insecticides (5%).
Table 3.1d Contamination mainly from agriculture
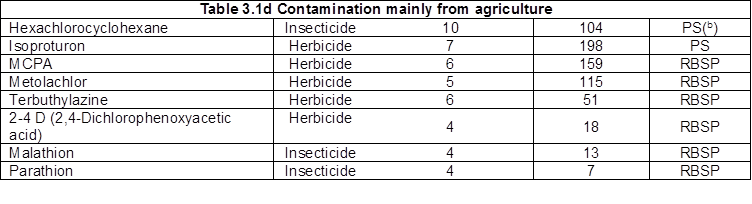
(b) defined as priority hazardous substances, for which all discharges, emissions and losses must be ceased.
This section starts with insecticides, then considers herbicides. Fungicides and bactericides do not appear high up in the lists of most frequently reported pesticides (table 3.1).
3.7.1. Insecticides
Eleven Member States reported hexachlorocyclohexane (HCH) exceeding the EQS (table 3.1). Two other insecticides – parathion and malathion, regulated as RBSPs – were reported by four Member States. Otherwise no other insecticides were reported as causing failure in four or more Member States.
Hexachlorocyclohexane
Sources and uses
In the priority substances list, HCH represents a group of several, similar molecules. Lindane – gamma-HCH - is the most well-known substance in the group. It was extensively produced in the EU from the 1950s, and used as a broad-spectrum insecticide until the 1970s - 1990s. Production led to large amounts of HCH-contaminated waste. Production sites were located near rivers and so there are many HCH contaminated spots beside rivers (i.e. Sabiñánigo and Vitoria sites next to the Ebro river).
Hexachlorocyclohexane is relatively long-lived in the environment, is highly volatile and can be transported over long distances through natural processes. It has been listed under the Stockholm Convention since 2009.
Toxicity and EQS
HCH is carcinogenic, persistent, toxic and can bio-accumulate in food chains. The aim of the EQS is to protect top predators such as otters and cormorants, which are at risk owing to bioaccumulation.
WFD status
Despite restrictions on use for several years, HCH caused failures in 10 countries and over 100 surface water bodies. This reflects the persistence of the substance and some continued use. However, despite its volatility, in contrast to mercury it is not reported as causing many failures in northern countries.
Emissions
Figure 3.11 gives an overview of the different reported loads.
Figure 3.11 : Hexachlorocyclohexane !!!
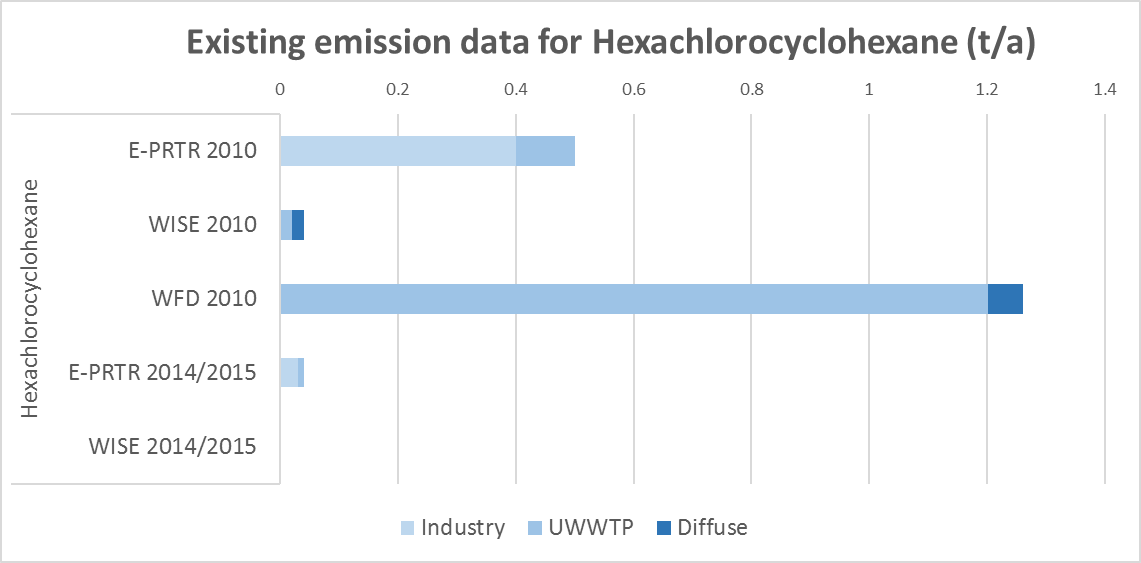
Notes: !!! – CAUTION – low confidence in data, as limited reporting of this substance, see Table 3.2. Details on the emissions data are given in Annex A.
Few Member States report loads of HCH from industry and UWWTPs, and there is inconsistency between reports. Those reported under E-PRTR suggest a decreasing trend, but are skewed by high loads in the chemical industry and energy sector reported by a single country, even though many uses have been restricted. There was very limited reporting on diffuse sources like atmospheric deposition and stormwater overflows.
No overview of the total emissions to water in Europe can be made, because only a few Member States have reported emissions. It is unclear whether this arises because of low emissions or because of low levels of reporting.
Summary/Outlook
Restrictions on the use of HCH suggest that over time, failures to achieve good chemical status owing to this insecticide should decrease.
Parathion and malathion
Both parathion and malathion are organophosphorus-compounds and inhibit acetylcholine esterase (AChE; further description in table 2.1). Studies with the plankton, Daphnia, showed that long term exposure to low concentrations was harmful (UBA, 2011).
Parathion and marathion are regulated as RBSP by several Member States and exceeded EQS in only a few water bodies.
No reliable figures on emissions of parathion and malathion are available.
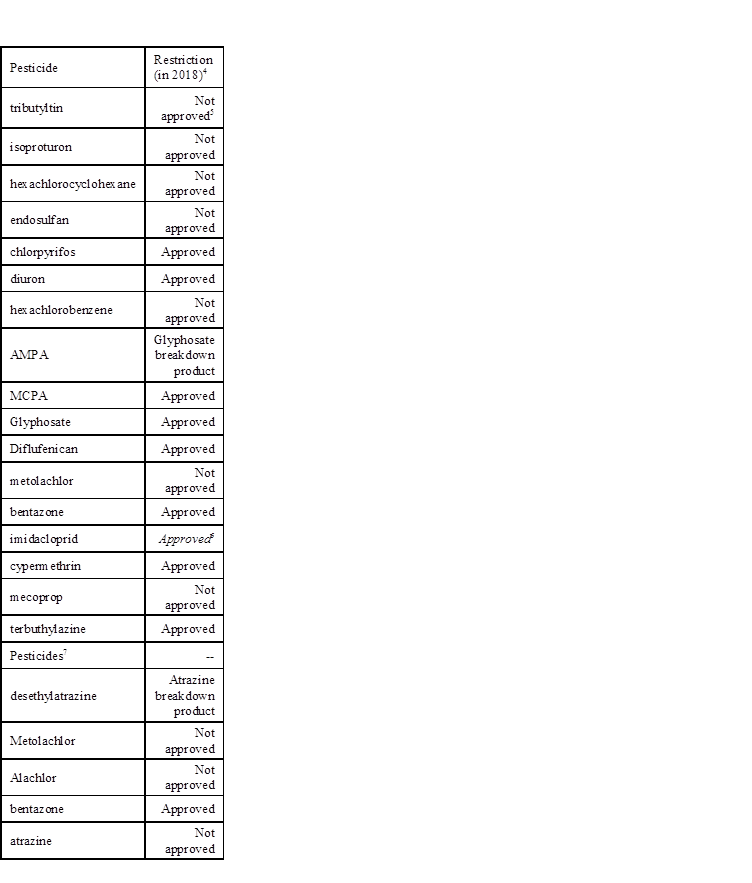
Box 4.4: Where are the pesticides in 2nd RBMPs?
Pesticides do not appear as a significant cause for failure to achieve good (chemical) status of water bodies, despite expert views that pesticides – substances designed to eliminate part of an ecosystem - should be of concern. Why don’t we see this in the data?
Fig B3.4 shows numbers of water bodies where pesticides cause failure to achieve good status, in surface and groundwaters


 Numbers in parentheses are the number of Member States reporting failures owing to that substance.
Why do we see this? Possibly because…
· Restrictions and changed practice have been enacted on many of the substances measured, these controls have been effective and releases to water are reduced;
· Restrictions mean that the monitored substances do not reflect the pesticides actually in use, so the monitoring misses important information;
· Monitoring frequency (typically up to 12 times per year) misses the limited period for which a pesticide is typically in use;
· WFD monitoring takes place in larger waterbodies, rather than small streams;
· Averaging concentrations over the year means threshold standards for chronic exposure are not exceeded;
· Differences in uses of pesticides across the EU mean that for any particular pesticide, there are relatively few records, which means that apparent significance at EU-scale is smaller than for other substances.
· National EQS or threshold values vary so difficult to get comparable picture.
From the RBMP assessments, we could conclude:
Reporting is correct – concerns about pesticides are over-stated. Measures have been effective.
Reporting is correct on reported substances, but we lack information on many other pesticides.
Reporting of status is inaccurate, owing to monitoring not reflecting situation during peak periods of pesticide use.
But, from the reporting, we cannot be sure which of these apply.
Notes
1) Shown are where at least 50 surface water bodies failing for pesticide https://tableau.discomap.eea.europa.eu/#/site/Wateronline/views/WISE_SOW_PrioritySubstance/SWB_SWPrioritySubstance_Europe?:iid=2
2) Shown are where at least 50 surface water bodies failing for pesticide https://tableau.discomap.eea.europa.eu/#/site/Wateronline/views/WISE_SOW_FailingRBSP/SWB_FailingRBSP?:iid=1
3) Shown are where at least 25000 km2 groundwater bodies failing for pesticide https://tableau.discomap.eea.europa.eu/#/site/Wateronline/views/WISE_SOW_gwPollutant/GWB_gwPollutant?:iid=1
4) EU pesticides database http://ec.europa.eu/food/plant/pesticides/eu-pesticides-database/public/?event=activesubstance.selection&language=EN
5) Tributyltin is a biocide which was mainly used to combat marine biofouling.
6) Imidacloprid is approved but use severely restricted since 2013 https://ec.europa.eu/food/plant/pesticides/approval_active_substances/approval_renewal/neonicotinoids_en
7) Active substances in pesticides, including metabolites, where the concentration of any individual exceeds 0.1 ug/l or the sum of total measured exceeds 0.5ug/l
6.7.2. Herbicides
Isoproturon
Sources and uses
From the 1990s, isoproturon was one of the most commonly-used herbicides in Europe, used to control annual grasses and broad-leaved weeds, for example in cereals. However, because of its toxicity and persistence, approval was withdrawn in 2016 and sales forbidden from March 2017 (EU, 2016).
Toxicity and EQS
The EQS was set to protect sensitive marine species, especially algae (CIRCABC, 2005). Isoproturon is one of several herbicides which affect photosynthesis.
WFD status
Isoproturon was reported as failing in nearly 200 surface water bodies, the majority in western Europe.
Emissions
Figure 3.13 gives an overview of the different reported loads.
Figure 3.13 : Isoproturon !!!
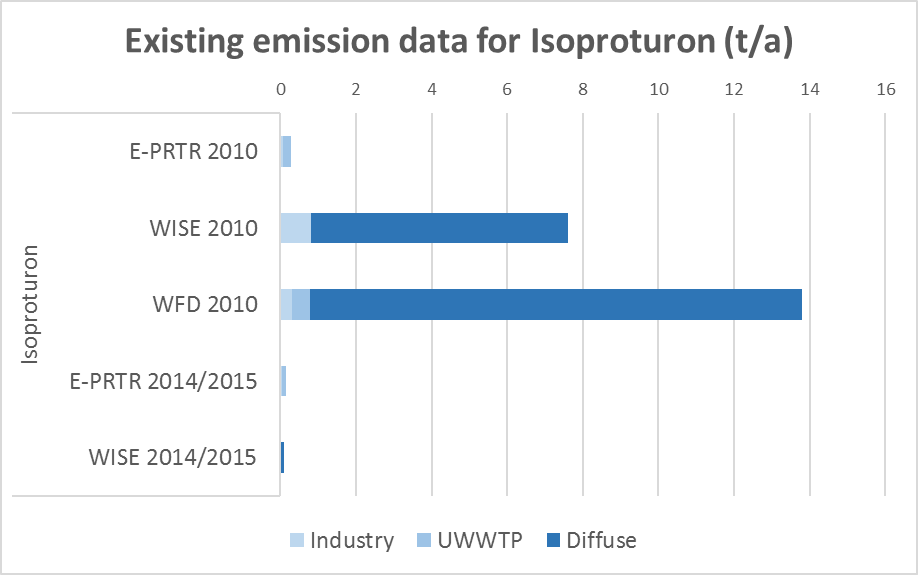
Notes: !!! – CAUTION – low confidence in data, as limited reporting of this substance, see Table 3.2. Details on the emissions data are given in Annex A.
Few Member States reported loads from industry and UWWTPs. Loads reported in WFD by two Member States indicate limited loads from industry (presumably related to production), but significant loads from UWWTPs. It is unclear how these arise. Diffuse sources reported by 5 Member States indicate high loads from agriculture and run-off, with minor loads from storm water overflows.
No overview of the total emissions of isoproturon to water in Europe can be made, owing to reporting by only a few Member States. It is unclear whether this arises because of low emissions or because of low levels of reporting.
Summary/Outlook
Restrictions on isoproturon had yet to come into effect in the period during which emissions and water body status information were being collected. As there are limited emissions data available, it seems unlikely that information in future will be able to show any changes. Theory suggests that fewer surface water bodies should fail in the 3rd RBMPs for isoproturon.
Box 3.5: Behaviour of Glyphosate in the environment
Glyphosate
Glyphosate is a commonly-used herbicide which has the highest pesticides sales volume in Germany. It is widely used for killing weeds on fields, public roads, parks and gardens, and glyphosate is often found in waters, crops and humans. Water protection measures to reduce erosion from ploughing – “minimum tillage” - often require the use of a herbicide, which is usually glyphosate.
Glyphosate is designed to kill plants via absorption through the leaves, where it inhibits a plant specific enzyme. When it reaches water, its herbicide action can damage algae and aquatic plants. However, glyphosate breaks down quite quickly in the aquatic environment, over timescales of a few days to a few weeks. Results of water and sediment studies show that, in addition to breakdown by bacteria, a major contributor to the reduction of glyphosate in surface waters is through adsorption to sediment and suspended particulate matter. For these reasons, glyphosate or its breakdown product aminomethylphosphonic acid (AMPA) may be regulated in water.
MCPA, metolachlor, terbuthylazine and 2-4 D
Four other herbicides, regulated as RBSPs, were reported as exceeding their EQS by at least 4 Member States: MCPA, metolachlor, terbuthylazine and 2-4 D.
MCPA is a widely used herbicide, used to control weeds in cereals and other crops. Its main effects in water are upon aquatic plants and algae, inhibiting photosynthesis and carbohydrate production and it can be harmful to fish.
Metolachlor is a pre-emergence herbicide, inhibiting germination of grass species and so allowing crops to grow better. EQS are set to protect algae, as the most sensitive aquatic organisms.
Terbuthylazine is a systemic herbicide, used to control grass and broad-leaved weeds and works as a herbicide by interfering with photosynthesis. The major harmful effect in water is on invertebrates.
2-4 D (2,4-Dichlorophenoxyacetic acid) is a selective herbicide, which effects broad leaved weeds. In water, aquatic plants are the most sensitive organism.
(Lewis et al, 2016; UBA, 2011 and 2016)
MCPA and metolachlor both exceeded national EQS in over 100 surface water bodies. Emissions to water data are not available for these RBSPs.
Outlook for pesticides
EU-wide restrictions on use of pesticides should lead to improvements in surface water chemical status for those substances. That we may be seeing that in the data, with relatively few water bodies failing for pesticides, should be understood with caution.
Most pesticides are not regulated under the WFD and so are not reported upon at the EU level. Whole classes of pesticides – fungicides and bactericides – are missing. Substitution of heavily- restricted pesticides, by others which face less scrutiny in the water legislation, means we miss information on many other substances.
3.8. Contamination from navigation
Ships, boats and the infrastructure to support them can cause a range of environmental problems, if poorly managed. For example, dredging channels can disturb buried, contaminated sediments. This section focuses on a contaminant directly introduced into water by shipping activities.
Table 3.1e: Contamination mainly from navigation
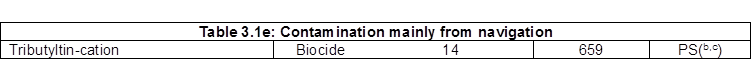
(b) defined as priority hazardous substances, for which all discharges, emissions and losses must be ceased.
(c) Substance is ubiquitous, persistent, bioaccumulative and toxic (uPBT) as defined in 2013/39/EU.
Biocide: Tributyltin
Sources and uses
Organisms such as algae and barnacles settle on wood, metal or plastic surfaces a short time after the material has been put in the water. This is a natural colonization process called “fouling” and can degrade the material. On vessels it also slows the boat down, leading to higher energy use. Biocides are therefore used to resist biofouling, which work by coating the vessel’s hull with an antifouling coating and continuously leaching the biocide. This also results in water contamination.
Owing to aquatic toxicity and persistence, use of organotin compounds in antifouling coatings has been banned since 2008.
TBT has also been used in wood preservatives, silicone sealants, roof sheeting, textiles and diverse other coatings. The remaining production and use of TBT continues to result in emissions from industry and UWWTPs.
Toxicity and EQS
TBT compounds affect the endocrine (hormone) system of certain marine as well as freshwater molluscs at very low concentrations. This results in malformation of the reproductive system, which can lead to impairment or eventually a complete loss of the ability to reproduce. Severity of malformation increases with higher TBT concentrations (CIRCABC, 2005). The EQS was derived to protect organisms in both freshwater and saltwater environments.
WFD status
TBT causes failure to achieve good chemical status in surface waters in over 650 water bodies. These are spread across Europe, mainly in western and southern countries. TBT is a uPBT under the WFD, owing to the difficulty in remediating contaminated areas.
Emissions
Figure 3.14 gives an overview of the different reported loads.
Figure 3.14 : Tributyltin !!!
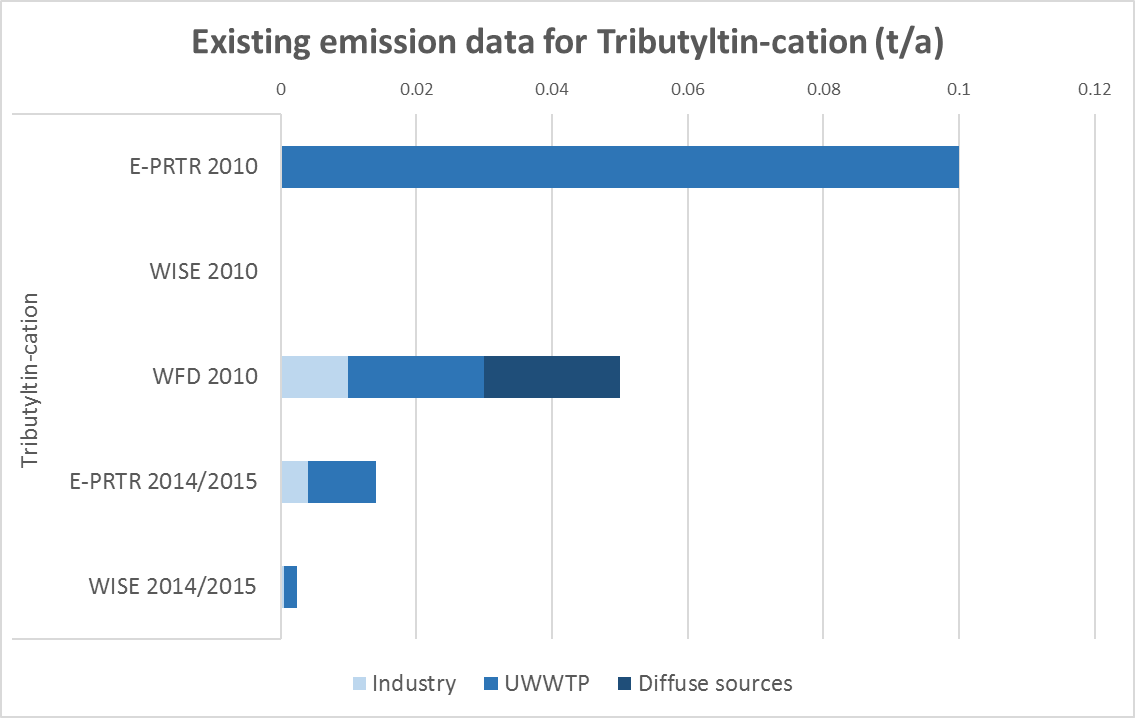
Notes: !!! – CAUTION – low confidence in data, as limited reporting of this substance, see Table 3.2. Details on the emissions data are given in Annex A.
Few Member States reported loads from industry, UWWTPs and diffuse sources.
No overview of the total emissions to water in Europe can be made, because only a few Member States have reported emissions.
Summary/Outlook
Following the restriction on use of TBT in boat antifouling, concentrations of TBT in water and sediments have decreased. Nevertheless, there are still exceedances of the EQS, which may relate to both historic contamination and to uses other than for antifouling.
Other than removing TBT-contaminated sediments and finding safe ways to dispose of hazardous material, there is little that can be done to remediate water bodies failing for this substance. Rather, careful management is required to allow burial of the contaminated material and avoid re-disturbance.
Non-toxic ways to prevent biofouling would have many applications. Finding them would deliver both increased sustainability and market advantage.
Box 3.6 Tributyltin (TBT) causing pollution of harbours and leisure navigation areas: Example from Sweden
Despite restrictions, polluted sediments continue to impact on water quality
Shipyards where TBT was used in antifouling coatings for boats led to build-up of TBT in water and sediments over time. One example is the archipelago around Gothenburg and rivers and lakes in the river basin Västerhavet (map 2.2). In the river basin 13 water bodies do not reach the good status due to the exceedance of the TBT EQS. The restriction of TBT-based antifouling coatings stopped the increase of the TBT concentrations in water. But release of TBT from the sediment occurs when sediment is transported in rivers or is dredged to allow access to ports and harbours Vattenmyndigheterna i samverkan. "Del 2, Vattenförvalting 2009-2015 - Resultat Och Samverkan." Länsstyrelsen Västra Götalands län .

Source: http://www.vattenmyndigheterna.se/Sv/publikationer/Pages/default.aspx
3.9. Summary
With the exception of mercury, pBDEs and some of the PAHs, Member States are making significant progress in tackling concentrations of individual priority substances in surface water bodies (EEA, 2018a). This should be seen as a success for European water and chemicals policies stretching back several decades.
Looking deeper, we can see some gaps in the data. Most priority substances have been regulated for many years, with monitoring, analysis and discharge permitting being well-established. It is therefore perhaps surprising that for many of the most frequently-reported priority substances, there is a core set of 8-12 Member States reporting failures of those substances. It is unclear whether this accurately reflects pollution across the EU - that in other countries the priority substances are not a problem - or instead reflects the approach to monitoring and reporting. For instance, at least one country did not report any priority substances as causing failures to achieve good chemical status.
Similarly, at EU level, comparable information on emissions is limited to only a few substances. Table 3.2 gives an overview of the number of Member States reporting for the year 2010 for the different source groups: industry, UWWTPs and diffuse sources. When different datasets are reported (E-PRTR, WISE, WFD), the dataset with the highest number of Member States reporting is shown, i.e. “the best case”, summarising the information available on emissions of 15 priority substances. In the table, where emissions data are available for at least 14 countries, the cell is coloured green indicating sufficient data availability. Between 7-14 countries, the cell is yellow, indicating moderate data availability. If data are available for fewer than 7 countries, the cell is red.
Table 3.2 : Data availability for emissions of the 15 priority substances most frequently causing failure to achieve good chemical status
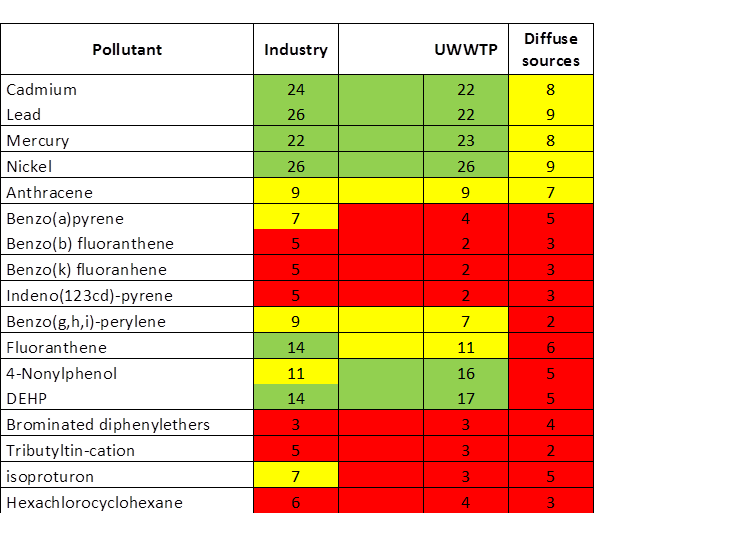
It can be seen that there is rather limited emissions information available at European level, even for well-established pollutants like priority substances from point sources. Information on emissions from diffuse sources is poor: as point sources become better controlled, the significance of diffuse sources is getting higher.
These data gaps make it difficult to track progress in reducing emissions at the European level, as required by the WFD, and to assess the effectiveness of chemical source control legislation in protecting the environment.
One of the challenges with chemical status is that once a persistent substance is in the aquatic environment, it may be there for a long time after emissions have ceased. This may lead to continued failure to meet good chemical status, and a potential mis-match with the pressures. In the case of transboundary pollution, there is also a poor fit with the river basin approach promoted by the WFD, which works on the basis that management processes will influence local/regional water quality. In the case of persistent, hazardous chemicals, particularly those which can be transported in the atmosphere, international chemicals legislation is also needed to underpin environmental protection. Evidence on the trend in emissions may be used to better inform the pressures assessment.
Looking forward to the next RBMP reporting, there are some new priority substances and some existing priority substances have revised EQS to reflect updated scientific knowledge. It is likely that these changes will make the achievement of good chemical status in surface waters more challenging.
Specific actions proposed to improve protection of waters.
Further effort to reduce emissions of mercury from urban waste water treatment plants, either upstream or before discharge, seems necessary.
Improved understanding of pressures from emissions reporting needed to be able to implement effective measures to reduce pollution of water by PAHs.
Improved understanding of the environmental pathways of pBDEs, to identify whether measures can be implemented which would limit further dispersal.
Streamlining of emissions reporting, so that robust data collected for one obligation would satisfy European emissions reporting requirements.
Improvement in the monitoring and reporting of diffuse sources, to ensure that pressures are correctly understood and measures can be appropriately targeted.