
Post a comment on the text below
The best ecological status for benthic invertebrates in rivers is found in Romania, Finland and the UK, while the worst is found in the Netherlands, Germany and Croatia (Figure 2.5).
Figure 2.5. Ecological status for benthic invertebrates in rivers in different countries.
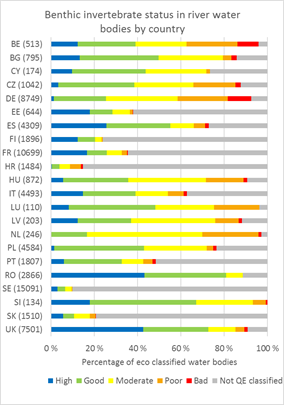

Notes: Classification of ecological status for macroinvertebrates in rivers including the water bodies not classified for this biological quality element (grey bars) (left panel) and excluding these water bodies (right panel). The number in brackets in the left panel is the total number of water bodies classified for overall ecological status (100% on the x-axis). In the right panel, the numbers in brackets indicates the number of water bodies classified for benthic invertebrates in rivers (100% on the x-axis). Here, the percentage in brackets is the number of water bodies classified for benthic invertebrates out of the total number of water bodies classified for overall ecological status. Source: Preliminary results from WISE-SoW database including data from 22 Member States (excluding Austria, Denmark, Greece, Ireland and Malta). See Link for results including 25 Member States.
|
Further and detailed information on quality elements results is available in WISE · Quality elements Table - ; QE group Table; QE:EU_overview Table · BQE_table; BQE_graph*; HYMO_QE_table; HYMO_QE_graph*; PhysChem_QE_table; PhysChem_QE_graph*; RBSP_QE_table and RBSP_QE_graph* · Quality elements by category and Member States · Quality elements – monitored, grouping or expert judgement Table* - Graph* |
* draft dashboards;
You cannot post comments to this consultation because you are not authenticated. Please log in.
Previous comments
Figure 2.5:
The presentations in the diagrams of figure 2.5 contain two different kinds of statistics. One shows the percentages without "Unknows" the other one shows the percentages with "Unknowns". In principle this form of presentation is quite informative especially for experts - the problem with this form of presentation, to our opinion, is that the non-expert reader is "left alone" with the interpretation of the figures. There is no explanation in the text why this form of presentation is used and how differences between the figures should be interpreted. A policy paper for the politics, the broader public and the administration should to our opinion include a more simplified presentation. We suggest the use of one graph only, including the "unknowns" (the left graph).
BE-FLA (RV): p. 27, Fig 2.5
Add (incl. unknowns) and (excl. unknowns) to head labels
BE-FLA (VVDL): p.27 Add new figure
P 26-27 only contains figures with results per category or BQE. Please insert also the figure with the overview by member state with the evaluation of the overall ecological status (unknows included). This figure makes the relation between evaluation of the ecological status (2.3) and chapter 2.4 change in ecological status between 1st and 2nd RBMPs
Term unpopulated used in detailed information, is not mentioned in WFD reporting guidance version 6.0.4, could you explain it somewhere?
In the fig. 2.5. the RO data from the left panel indicated in brackets (2866) does not reflect/correspond to the RO WISE data. Also in the right panel, the perecentage (89%) does not reflect the RO WISE data.
Referring the Notes : the explanation in relation to the number of WBs classified for overall ecological status is not clear.
Also the inclusion of reservoirs in the river water body category in relation to benthic invertebrates assessment may lead to unaccurate results having in view that this BQE was excluded form the IC exercise at European level and subsequently being not assessed at national level.
(AT) Figure 2.5
Very confusing. Only one graph should be used. Information regarding percentage of unknown status is essential for interpreting the results, only left figure should be used.
Status can not be merged with potential!
BE-WAL (EC): p. 27 § blue
“BQE graph”: this is not the title of the graph
Fig 2.5
In figure 2.5 grey bars can be interpreted as a shortcoming in the monitoring programme. This could be the case, but could also be explained by the fact that the waterbody is not at risk and therefore not demanding any operational monitoring or that benthic invertebrates is not the quality element which is indicative of the pressures to which the body or bodies are subject. Surveillance monitoring should cover sufficient surface water bodies to provide an assessment of the overall surface water status.