
Table of contents
- Guidance to the reader
- General comments
- Executive summary
- 1. EEA State of Water assessment and EU water policy context
- 2. Ecological status and pressures
- 3. Chemical status and pressures in surface waters
- 4. Groundwater chemical status and pressures
- 5. Groundwater quantitative status and pressures
- 6. Overall status, progress achieved and future challenges
2. Ecological status and pressures
2. Ecological status and pressures
Key messages
- On a European scale, around 40 % of the surface water bodies are in good or high ecological status, with lakes and coastal water bodies having better status than rivers and transitional waters bodies. The improvement in overall ecological status since the first RBMPs were reported is limited.
-
It is suggested that the following be added
…… The improvement in overall ecological status since the first RBMPs were reported is limited, owing to the application of the one-out-all-out principle.
- Marked efforts have been made by Member States to improve water quality and hydromorphology. Some of the measures have immediate effect; others will result in improvement in the longer run. Results are usually visible at the level of individual quality elements but often do not translate into an overall improved ecological status.
-
BE-FLA (RV): p. 21 Key messages
Marked efforts have been made by Member States to improve water quality and hydromorphology. Some of the measures have immediate effect; others will result in improvement in the longer run.
Results Effects of measures are usually visible at the level of individual quality elements but often do not translate into an overall improved ecological status.
- However, for the individual quality elements (biological quality elements, supporting physico-chemical and hydromorphological quality elements) that make up the overall status the situation has improved.
-
BE-FLA (RV): p. 21 Key messages
However, for For the individual quality elements (biological quality elements, supporting physico-chemical and hydromorphological quality elements) that make up the overall status the situation has improved.
- The main pressures are point and diffuse source pollution, and various hydromorphological pressures. Diffuse pollution affects 37 % and point source pollution 18 % of the surface water bodies, while hydromorphological pressures affect 41 % of water bodies.
-
Please check the figures on proportion of SWBs affected by main pressures (which look to be the main significant pressures) and harmonize them among sub-chapters and figures 2.8 and 6.2 because these are different -please see below :
......Diffuse pollution affects 37 % and point source pollution 18 % of the surface water bodies, while hydromorphological pressures affect 41 % of water bodies.
Figure 2.8. Proportion of water bodies affected by main pressures of all surface water bodies and by categories: rivers, lakes, transitional and coastal waters - Diffuse pollution affects 38 % and point source pollution 18 % of the surface water bodies, while hydromorphological pressures affect 40 % of water bodies.
Figure 6.2. - Diffuse pollution affects 37 % and hydromorphological pressures affect 41 % of water bodies.
Also at the page 55 -Key messages it is mentioned : Diffuse sources (62 %) and hydromorphological pressures (40 %) are the main significant pressures on surface water bodies, followed by point sources (21 %) and abstraction (7 %).
Also please check/indicate at the page 55 -Key messages if these figures represent the proportion of water bodies affected by main pressures and indicate that Diffuse sources (62 %) include also the atmospheric deposition
- The main impacts on surface water bodies are nutrient enrichment, chemical pollution and altered habitats due to morphological changes.
2.1 Introduction
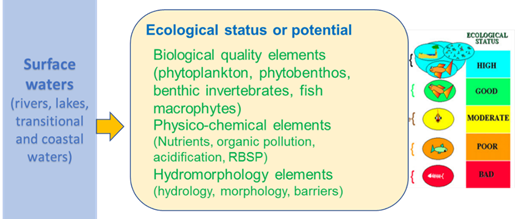
Ecological status[1] is an assessment of the quality of the structure and functioning of surface water ecosystems. It shows the influence of pressures (pollution, habitat degradation, climate change, etc.) over the identified quality elements. Ecological status is determined for each of the surface water bodies of rivers, lakes, transitional and coastal waters based on biological quality elements, supporting physico-chemical and hydromorphological quality elements (Figure 2.1). The overall ecological status classification for a water body is determined, according to the one-out-all-out principle, by the worst status of all the biological quality elements and the supporting quality elements.
Figure 2.X. Assessment of ecological status of surface water bodies
-
Figure 2.X:
The presentation of the ecological status / potential in figure 2.X is to our opinion misleading. There is no visible differentiation between biological quality elements and supporting physiical and chemical quality elements (including hydromorphology). As in Germany and to our knowledge in most MS the ecological status / potential is determined by the biological quality elements only. The physical and chemical quality elements (including hydromorphology) are only used supportive. Please change figure 2.X accordingly (separate biological QE`s from other supportive QE`s).
-
The ecological potential classification only distinguishes 4 classes and these should be added to this figure.
-
Please add some sentences to describe the general difference between "status" and "potential" in the report.
For example:
Heavily modified and artificial waters are distinguished from natural waterbodies. These were either created artificially (e.g. a canal), or else their structure
has been modified so extensively that a “good ecological status” can no longer be achieved without significantly impairing an existing, economically significant
water use that cannot be achieved by other means. For such waters, an equally ambitious environmental objective of a “good ecological potential” has been defined, which requires improvements to be made to the hydromorphological pressures without impairing non-substitutable water uses. However, chemical status applies in exactly the same way as for natural waterbodies.or
For “heavily modified” and “artificial” water bodies, the EU Water Framework Directive prescribes the objective of “good ecological potential”. “Maximum ecological potential” is the reference status for heavily modified water bodies. At maximum ecological potential, all measures have been taken to improve the morphology of the water body without restricting its anthropogenous
usage. A “good ecological potential” represents only a minimal deviation of the biotic community from that of “maximum ecological potential”. -
"...coastal waters based on biological quality elements, supporting...."
Proposal: "supported by" instead of supporting
-
"The overall ecological status classification for a water body is determined, according to the one-out-all-out principle, by the worst status of all the biological quality elements and the supporting quality elements."
This is misleading. One-out-all-out is mainly for biological quality elements, hydromorphology is classifying only from high to good.
-
"Figure 2.X. Assessment of ecological status of surface water bodies"
Figure 2.1 in this case and adjust numbers of all following figures in chapter 2.
-
(AT): 1st word in 1st sentence 'Ecological status....'
The footnote is not correct! ”the ecological conditions they reflect are assumed to be comparable, having the same deviation from reference conditions”
The ecological conditions are not comparable. Only WBs failing good status can be designated as HMWB. Reference conditions (high status) and high potential differ significantly. This needs better explanations! The main diffferences between natural and HMWB/AWB should be explained in chapter 1.2
As 17% of all WB are AWB/HMWB a chapter on the results for ecological potential would be reasonable! It is not acceptable to include ecological potential in ecological Status!
-
(AT) Figure 2.X
Separate colour code for AWB/HMWB
Significant pressures causing less than high or good ecological status
Water bodies in moderate, poor or bad ecological status require action in terms of mitigation and restoration measures to achieve the WFD good status objective. To plan the measures, the pressures causing water bodies to fail good ecological status must be identified.
These include pressures from point sources of pollution, diffuse sources of pollution, hydrological and morphological alterations, and a number of other pressures. Similarly, impacts include nutrient, organic and chemical pollution, altered habitats, and acidification.
Better understanding and knowledge of ecological status
During the first RBMP cycle (2009-2015), Member States have introduced a vast network of monitoring sites and assessed the ecological status of their water bodies. From 2008 to 2017, the number of intercalibrated ecological assessments methods increased from around 100 to nearly 400 methods. Overall, this has reduced the proportion of water bodies with unknown ecological status from 16 % to 3 %, and the confidence in the classification has improved from one third of water bodies with high or medium confidence in the first RBMPs to more than half of the water bodies in the second RBMPs.
In the second RBMPs more than two-thirds of all water bodies are classified based on at least one biological quality element (Figure 2.1). For most of the remaining water bodies, status has been assessed based on supporting physico-chemical and/or hydromorphological quality elements.
Figure 2.1. Percentage of classified water bodies using different quality elements.
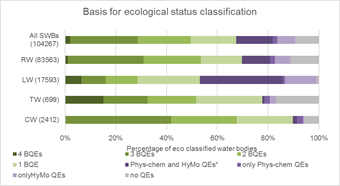
Notes: * at least one physico-chemical quality element and one hydromorphological quality element, but no biological quality elements. Number in parenthesis is number of water bodies.
Source: Preliminary results based on WISE-SoW database including data from 25 Member States (EU28 except Greece, Ireland and Lithuania).
Overall, these improvements mean that the results of the ecological status classification are now a better indication of the general health of the water environment. However, the improved status assessment in the second RBMPs makes the comparison between the status in the first and second RBMPs difficult. Caution is advised when drawing detailed conclusions regarding changes observed between the two RBMPs and when comparing results between Member States.
|
Further and detailed information on improvements in ecological status assessment is available in WISE · Monitoring of ecological status (see chapter 1) · Change in proportion unknowns: unknown ecological status · Confidence in: ecological status assessment Table and Graph*; · Proportion of water bodies assessed by using biological quality elements, and supporting physico-chemical and hydromorphological quality elements (see Figure 2.1 – dashboard to be produced) |
* draft dashboards;
-
“In the second RBMPs more than two-thirds of all water bodies are classified based on at least one biological quality element (Figure 2.1). For most of the remaining water bodies, status has been assessed based on supporting physico-chemical and/or hydromorphological quality elements.” Ecological status assessed even without biological assessment contradicts with “requires that all biological elements and supporting quality elements achieve at least good status”. Furthermore, there is no direct relation with Intercalibration. We believe it is not in line with WFD to produce an ecological status in this case – please confirm or refute this explicitely. The results shown are therefore too positive and no stimulus to improve the monitoring program. These results should be indicated as “unknown” or invalid. How is “unknown” defined in the report? We could not find graphs to illustrate nr substances assessed for the chemical status; please add them.
-
BE-FLA (RV): p. 22, §2 Pressures
These include pressures from … >> Pressures include …
-
BE-FLA (RV): p. 22, §3 methodology
There is only 1 methodology on intercalibration, that resulted in a large number of approaches applied by MSs.
-
BE-FLA (RV): p. 22, §4-7 In the second RBMPs more than two-thirds of all water bodies are classified based on at least one biological quality element (Figure 2.1). For most of the remaining water bodies, status has been assessed based on supporting physico-chemical and/or hydromorphological quality elements.
This conflicts with p. 13 §1: “requires that all biological elements and supporting quality elements achieve at least good status.“
How does ‘High/medium/low/unknown’ in the table “Confidence in: ecological status assessment Table” relate to # or % in Fig 2.1?
-
It is good that the report advise to take caution in comparison between the results of the 1st and 2nd RBMPs. The results of the 1st and 2nd RBMPs may be incomparable because of (i) the differences of the coverage of data included in the status assessments and of (ii) the fact that that the class boundaries (H/G and G/M) were in many cases tightened as a consequence of the second intercalibration exercise, as was the case in the Finnish coastal waters.
-
below Figure 2.1:
Unclear where the asterisk refers to (figure in bad quality)
-
BE-WAL (EC): p. 22 § blue figure 2.1
Problem with the figures display in the table
-
SK: Page 22, 3rd paragraph: The correct years for first RBMP cycle is “2010 – 2015” and not “2009- 2015”.
2.2 Ecological status in the second river basin management plans
Ecological status and potential
Overall, around 40 % of the surface water bodies are in good or better ecological status, while 60 % did not achieve good status (Figure 2.2). Lakes and coastal waters are in better status than rivers and transitional waters. The ecological status of natural water bodies is generally better than the ecological potential of heavily modified and artificial water bodies.
Figure 2.2. Ecological status/potential of rivers, lakes, transitional and coastal waters.
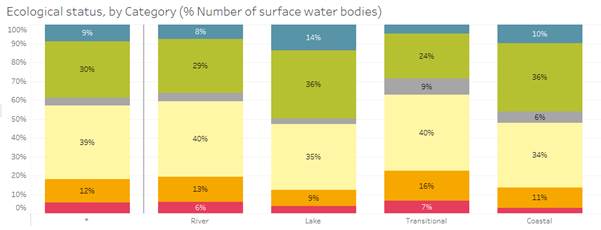
Notes: The term (*) means all surface water bodies summarizing rivers, lakes, transitional and coastal waters. Classification by length of rivers and surface area of the other water categories shows similar distribution of status classes as the classification by number of water bodies for each water category (see below links to WISE), except a lower proportion high and good for the area of transitional waters.
Source: Preliminary results based on WISE-SoW database including data from 25 Member States (EU28 except Greece, Ireland and Lithuania).
-
Figure 2.2:
Please adjust the colours in the diagram (blue, green an so on) as in the other diagrams showing the status/potential in the report (use the same colours)
or (as an alternative) add a description /legend for the colours to the titel.
Please add % numbers also to the narrow grey and red stripes.
-
The legend is missing.
-
Ecological status/potential classification by length of rivers and surface area of the other water categories should also be shown here, not only behind links.
It is mentioned in Notes under Figure 2.2: Classification by length of rivers and surface area of the other water categories shows similar distribution of status classes as the classification by number of water bodies for each water category (see below links to WISE), except a lower proportion high and good for the area of transitional waters.
But this is not enough. River length and lake/coastal/transitional areas would provide actual information how widely EU surface waters are in good or less than good condition.
It would be especially interesting to see lengths and areas against pressures in chapter 6.
-
It would be nice to add a colour code to figure 2.2.
-
(AT): 1st sentence: 'around 40 % of the surface water bodies are in good or better ecological status...'
Reference to good potential is needed here. Generally I would prefer to include a differt colour (green/grey stripes) for good potential in the graphs. If not, a separate chapter on AWB/HMWB or separate graphs
-
(AT) Figure 2.2 and Notes:
It is not acceptable to merge status and potential! Separate graphs for natural and HMWB/AWB are needed.
Notes: The term (*) means all surface water bodies summarizing rivers, lakes, transitional and coastal waters
AWB/HMWB are a separate water category and have to be mentioned here.
-
SK: Page 23, 1st paragraph, and Figure 2.3: At least in this introductory section, it would be beneficial to present figure for the ecological potential separately (by category). We propose to present information and data in a more positive way, we would welcome to present figures also for high and good status (figure 2.3), not only for less than good status.
-
CZ: Missing legend (e.g. gray – unknown)
The northern countries, particularly the northern Scandinavian region and Scotland show a high proportion of water bodies in high or good ecological status. In contrast, the central European river basin districts as well as some southern RBDs show the highest proportion of water bodies not in good ecological status or potential.
Figure 2.3. Percentage of water bodies not in good ecological status in Europe’s river basin districts in 2016 <Maps from 2012 (first RBMPs)
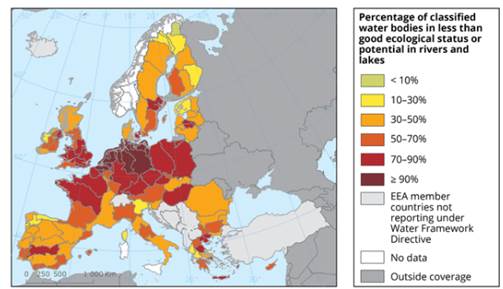
An updated map has not been included – EEA is exploring different option on presenting the information on interactive map services. The map service should present ecological status per RBD for either the first or second RBMP with filters for the four categories (rivers, lakes, transitional and coastal waters) and by count of water bodies and by size (Length for rivers; and area for the other categories) and with pop-up windows with the results for the specific RBD. See results for map Table
-
You should use word Fennoscandia here instead of the northern Scandinavian region.
-
The northern countries, particularly the northern Scandinavian region and Scotland show a high proportion of water bodies in high or good ecological status. In contrast, the central European river basin districts as well as some southern RBDs show the highest proportion of water bodies not in good ecological status or potential.
This does not correspond to the figure. Figure 2.3. shows quite good results for Southern Europe but bad results for Benelux/Germany/Poland.
-
Maybe it is possible to include an analysis of percentage of river km and area of lakes in GES or GEP? This picture describes the situation much better than a number of WB.
-
There is no use in including figure 2.3. and the repsective text as they are not corresponding to the report's timeframe (2 RBMP).
-
Figure 2.3: We wondered if it would also be possible to prepare a figure that would show the picture of the state of European waters based on the size/length of the water ecosystem. Moreover, text below the figure referes to 'interactive map service' - how will the updated map feature in the printed version of the report?
In general, highland rivers and lakes have better status than lowland water bodies. Mid-altitude and siliceous water bodies are also in better status compared to lowland and calcareous water bodies. The European downstream part of large rivers has in many cases less than good status, while the status of large European lakes is much better than the average status of lakes.
In coastal and transitional waters, the best ecological status is found from the Celtic Sea to the Iberian Coast and in the Mediterranean, while the worststatus is found in the Baltic and Black Seas.
|
Further and detailed information on ecological status results is available in WISE · Ecological status by category, table – graph – · Ecological status of natural or heavily modified and artificial water bodies (use the filter) · Ecological status by common broad types · Ecological status by Member States – see above table - graph_MS - graph_MS_category · Ecological status by RBDs (Results for Map) - Table · Ecological status in 2015 Table |
* draft dashboards;
-
worststatus -->worst status
-
Fig 2.3: Please include the oversea RBDs
2.3 Status of quality elements
Ecological status is determined for rivers, lakes, transitional and coastal water bodie based on biological quality elements and supporting physico-chemical and hydromorphological quality elements.
Textbox: Biological quality elements and supporting quality elements
|
Phytoplankton are free floating microscopic algae, which are very sensitive to the level of nutrients in a given water body. Phytoplankton may cause the water to become green, brown or red, depending on the dominant species. Phytoplankton consist of many different groups of algae, e.g. green algae, diatoms, dinoflagellates, as well as the potentially toxic cyanobacteria that may create blooms in nutrient enriched lakes, and cause problems for use of the water for drinking water supply and recreation. |
|
Aquatic benthic flora comprises phytobenthos and macrophytes in rivers and lakes, and macroalgae and angiosperms in coastal and transitional waters. Aquatic flora is particularly susceptible to elevated nutrient concentrations in the water. Phytobenthos are small algae that grow on rocks and other substrates, including bacterial tufts and coats if the water body is enriched with organic matter from waste water. Aquatic plants (macrophytes and angiosperms) grow mainly on soft substrate in shallow waters in rivers, lakes and transitional and coastal waters, while large algae (macroalgae) grow on rocky substrate along the shores of coastal and transitional waters. |
|
Benthic invertebrates are small animals that inhabit the bottom, as well as nearshore areas of streams, rivers, lakes, coastal and transitional waters. They include e.g. aquatic insects, crustaceans, snails and mussels. Benthic invertebrates are a key source of food for fish. Benthic invertebrates are susceptible to many different pressures, such as organic enrichment causing oxygen deficiencies, alterations of habitats, acidification, fine-sediments, and inputs from agricultural pesticides. |
|
Fish are particularly susceptible to hydromorphological pressures, revealing impacts of river bank constructions, large flow fluctuations, water abstraction, inadequate shelters beneath roots and poorly structured water beds. Such habitat alterations affect the fish abundance, their species composition or age structure. In addition, salmon and many other fish species that migrate from the sea to river headwaters to spawn are dependent on river continuity. Hence, changes in fish composition and abundance often reveal lost river continuity (e.g. due to barriers or dams). Fish are also very sensitive to acidification. |
|
Hydromorphological elements support the biological elements. They generally consist of 1) the hydrological regime (e.g. quantity and dynamics of water flow and connection to groundwater bodies) and 2) the morphological conditions (e.g. depth and width variation, structure and substrate of the bed, and structure of the riparian zone). In rivers, it also includes river continuity (i.e. presence of barriers and dams or other transversal structures). |
|
Physico-chemical quality elements support the biological quality elements. They generally consist of 1) light and thermal conditions, 2) oxygenation conditions, 3) salinity, 4) nutrient conditions, and 5) river basin specific pollutants (RBSPs). For rivers and lakes, they also include acidification status. |
-
With regard to the physico-chemical quality elements, it would be helpful to add a sentence explaining that the boundary values for these quality elements are set by MS and that these can vary substantially from one MS to another MS.
-
First line: bodie--> bodies
-
it is suggested to be added what it is in italics
...... Fish are particularly susceptible to hydromorphological pressures, revealing impacts of interruptions of longitudinal continuity, river bank constructions, large flow fluctuations, water abstraction, inadequate shelters beneath roots and poorly structured water beds.
-
Textbox: Biological quality elements and supporting quality elements
It should be made clearer which the biological quality elements and which supporting elements are.
-
"Fish are particularly susceptible to hydromorphological pressures, revealing impacts of river bank constructions."
The main hydromorphological alteration in big rivers is the loss of rapids due to raised water levels by damming, for example salmon and trout require rapids habitat for spawning.
-
Hydromorpholigcal elements
As dams are also a kind of barriers, it is proposed to delete "dams".
Although a large proportion of water bodies are not classified for each single quality element (grey bars in figure 2.4), more than two-thirds of all water bodies are classified with at least one biological quality element. The most frequently classified biological quality elements for rivers are benthic invertebrates, phytobenthos/other aquatic flora/macrophytes and fish, phytoplankton for lakes and phytoplankton and benthic invertebrates for transitional and coastal waters.
The ecological status for individual quality elements is generally much better than the overall ecological status. For rivers, for example, 50-70 % of the classified water bodies have high or good status for several biological quality elements, while the overall ecological status is only high or good for less than 40 % of the river water bodies. For the physico-chemical and hydromorphological quality elements generally more than two-thirds of the water bodies have at least good ecological status.
Figure 2.4. Ecological status of biological quality and supporting elements in rivers, lakes, transitional and coastal waters.
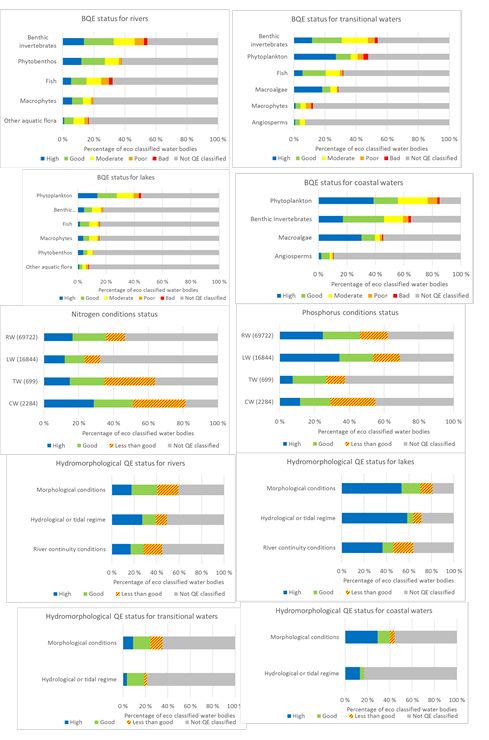
Notes: Ecological status for biological quality and supporting elements in water bodies classified for overall ecological status (100%). The grey part shows water bodies not classified for that particular quality element.
EEA is exploring possibilities to present aquatic flora correctly – some Member States report “Other aquatic flora” while other Member States have reported the aquatic flora sub-indicators.
Source: Preliminary results from WISE-SoW database including data from 22 Member States (excluding Austria, Denmark, Greece, Ireland and Malta). See Link for results including 25 Member States.
-
First sentence:
"Although a large proportion of water bodies are not classified for each single quality element..."
please delete "are" and replace by "is"
-
"The ecological status for individual quality elements is generally much better than the overall ecological status" - this sentence contains to our opinion a very important message - you might add this message to the key messages in chapter 6?
-
Figure 2.4:
1. Figure 2.4 titel: Ecological status & potential of... (in many diagrams in the above text "status and potential" is noted, but here only status ?)
2. The legends in the diagrams of Figure 2.4 contain the description "Not QE classified" for the grey bars. Probably it will be better to replace "Not QE classified" by "Not classified".
3. In the diagrams for nitrogen conditions and phosphorous conditions an explanantion is needed what "RW", "LW", "TW" and "CW" means.
-
"The ecological status for individual quality elements is generally much better than the overall ecological status." should be replaced as follows "The status classification for individual quality elements is generally much better than the overall ecological status classification."
-
BE-FLA (RV): p. 25 §2 The most frequently classified biological quality elements for rivers are benthic invertebrates, phytobenthos/other aquatic flora/macrophytes and fish, phytoplankton for lakes and phytoplankton and benthic invertebrates for transitional and coastal waters.
1) Redraft sentence: Rivers: …; Lakes: …; TC: …
2) Any conclusions to be drawn for this chapter?
-
BE-FLA (RV): p. 25 §3 The ecological status for individual quality elements is generally much better than the overall ecological status. For rivers, for example, 50-70 % of the classified water bodies have high or good status for several biological quality elements, while the overall ecological status is only high or good for less than 40 % of the river water bodies. For the physico-chemical and hydromorphological quality elements generally more than two-thirds of the water bodies have at least good ecological status.
“generally”? Is the opposite possible, considering OOAO?
Correction:
“The ecological status for individual quality elements is generally much better than the overall ecological status. For rivers, for example, 50-70 % of the classified water bodies have high or good status for several biological quality elements, while the overall ecological status is only high or good for less than 40 % of the river water bodies. For the physico-chemical and hydromorphological quality elements generally more than two-thirds of the water bodies have at least good ecological status.”
-
BE-FLA (VVDL): p. 25 §3
Possible solution to overcome the problem of the variety of the number of quality elements used for the assessment of the status is to make 2 separate evaluations:
- One based on the results of the surveillance monitoring (for which results for all relevant quality elements should be available) and
One based on the results of the operational monitoring (for which only results for the biological quality elements that are subject to the pressures causing a risk for failure to achieve good status)
-
BE-FLA (RV): p. 26, Fig 2.4
1)Proposal to re-arrange figures:
BQE Rivers / HM Rivers
BQE Lakes / HM Lakes
BQE TW / HM TW
BQE CW / HM CW
N / P
2) Add numbers to labels
-
It is noted that Denmark is not included. Data has to our knowledge been uploaded via the WISE database and we would therefore appreciate if the figure could be updated for the final report.
-
BE-FLA (RV): p. 25 Although a large proportion of water bodies are not classified for each single quality element (grey bars in figure 2.4), more than two-thirds of all water bodies are classified with at least one biological quality element. The most frequently classified biological quality elements for rivers are benthic invertebrates, phytobenthos/other aquatic flora/macrophytes and fish, phytoplankton for lakes and phytoplankton and benthic invertebrates for transitional and coastal waters.
The ecological status for individual quality elements is generally much better than the overall ecological status. For rivers, for example, 50-70 % of the classified water bodies have high or good status for several biological quality elements, while the overall ecological status is only high or good for less than 40 % of the river water bodies. For the physico-chemical and hydromorphological quality elements generally more than two-thirds of the water bodies have at least good ecological status.
Any conclusions to be drawn for this chapter?
-
Ecological status of biological quality and supporting elements in rivers, lakes, transitional and coastal waters.
Ecological status of hydromorphology should not be reported the same way as other quality elements. As discussed in the hydromorphology -expert workshop in November 2017, the assessment of hydromorphology -pressures and their way of use differ remarkably. In many Member States hydromorphology -pressures are divided into different classes without any link to ecological status classes. In some MS, hydromorphology classes have been tried to link to ecological status classes. In specific, hydromorphology classes have been used as supporting (indicating) in additional to classifying biological criteria. The WFD classification spectrum involves only high/good.
-
(AT) 2nd para, 2nd sentence: 'The most frequently classified biological quality elements for rivers are benthic invertebrates, phytobenthos/other aquatic flora ...'
Not clear what is meant with this term. Is not included in list of BQEs above.
-
(AT) Figure 2.4: 'Ecological status of biological quality elements and supporting elements in rivers, lakes, transitional and coastal waters'
Other aquatic flora? Explanation is needed how status was assessed for supporting elements.
Results of risk assessment? Whats about the RBSP?
-
The graphical visualization of some of the diagrams presented in the Annex „Wise-SoW graphs 2018-01-23” is inaccurate, namely:
- Surface water bodies: QE status, by quality element and category;
- Surface water bodies: QE status, by quality element and country;
- Surface water bodies: QE status, by quality element, category and country.
The graphical visualization of the above mentioned diagrams does not correspond to the text of the report and does not provide a realistic assessment by QE status and by country.
In the diagrams QE status, by quality element and country and QE status, by quality element, category and country the percentage distribution between different classes of status has been calculated on the basis of number of water bodies for which assessment of status is reported , i.e. the number of water bodies for which “unknown status” of the respective QE is reported are not taken into account. Diagrams for a certain class however depict on the axis X “water bodies” and on axis Y “% of total”. This interpretation can lead to significant distortion of the visual information for the respective countries. For example, in the diagram QE status, by quality element, category and country a 100 % “less than good” status is presented for Bulgaria determined on the basis of a single WB for which status was reported (out of a total of 955 water bodies).
At the same time, in the overview diagrams in the report Figure 2.4 ( Chapter 2.3) the percentage distribution of status within the respective classes takes into account the percentage of water bodies “Not QE Classified” as well. Visualization in the diagram Surface water bodies: QE status, by category in the graphical annexes to the report is accurate, since water bodies with unknown status are correctly included in the diagram.
Based on the above observations, the Bulgarian proposal we would like to convey is:
- Amend the diagrams Surface water bodies: QE status, by quality element and category, Surface water bodies: QE status, by quality element and country and Surface water bodies: QE status, by quality element, category and country by including not classified water bodies for respective QE (water bodies with unknown status), or
- Include an evident clarification in the above mentioned diagrams that visualization includes percentage distribution in different classes of status only of water bodies for which assessment on the basis of the respective QE is reported, while water bodies with “unknown status” are excluded.
-
Text under figure 2.4, 'source': This is referred to in other places as well (sometimes 23 instead of 22 MS are mentioned); this comment thus applies to those parts of the text as well. It would seem some MS, as mentioned here, were not considered in the report or/and figures prepared. However, they are then referred to in the main text (eg Austria) suggesting they were considered. Also the link then takes you to the data for 25 MS for example. Will this and other figures and text be updated in the final report? That would be useful.
The best ecological status for benthic invertebrates in rivers is found in Romania, Finland and the UK, while the worst is found in the Netherlands, Germany and Croatia (Figure 2.5).
Figure 2.5. Ecological status for benthic invertebrates in rivers in different countries.
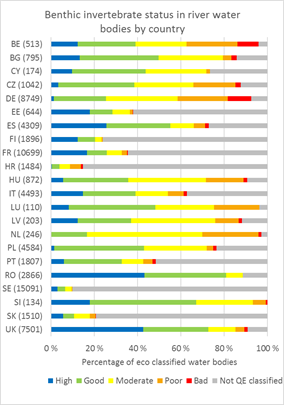

Notes: Classification of ecological status for macroinvertebrates in rivers including the water bodies not classified for this biological quality element (grey bars) (left panel) and excluding these water bodies (right panel). The number in brackets in the left panel is the total number of water bodies classified for overall ecological status (100% on the x-axis). In the right panel, the numbers in brackets indicates the number of water bodies classified for benthic invertebrates in rivers (100% on the x-axis). Here, the percentage in brackets is the number of water bodies classified for benthic invertebrates out of the total number of water bodies classified for overall ecological status. Source: Preliminary results from WISE-SoW database including data from 22 Member States (excluding Austria, Denmark, Greece, Ireland and Malta). See Link for results including 25 Member States.
|
Further and detailed information on quality elements results is available in WISE · Quality elements Table - ; QE group Table; QE:EU_overview Table · BQE_table; BQE_graph*; HYMO_QE_table; HYMO_QE_graph*; PhysChem_QE_table; PhysChem_QE_graph*; RBSP_QE_table and RBSP_QE_graph* · Quality elements by category and Member States · Quality elements – monitored, grouping or expert judgement Table* - Graph* |
* draft dashboards;
-
Figure 2.5:
The presentations in the diagrams of figure 2.5 contain two different kinds of statistics. One shows the percentages without "Unknows" the other one shows the percentages with "Unknowns". In principle this form of presentation is quite informative especially for experts - the problem with this form of presentation, to our opinion, is that the non-expert reader is "left alone" with the interpretation of the figures. There is no explanation in the text why this form of presentation is used and how differences between the figures should be interpreted. A policy paper for the politics, the broader public and the administration should to our opinion include a more simplified presentation. We suggest the use of one graph only, including the "unknowns" (the left graph).
-
BE-FLA (RV): p. 27, Fig 2.5
Add (incl. unknowns) and (excl. unknowns) to head labels
-
BE-FLA (VVDL): p.27 Add new figure
P 26-27 only contains figures with results per category or BQE. Please insert also the figure with the overview by member state with the evaluation of the overall ecological status (unknows included). This figure makes the relation between evaluation of the ecological status (2.3) and chapter 2.4 change in ecological status between 1st and 2nd RBMPs
-
Term unpopulated used in detailed information, is not mentioned in WFD reporting guidance version 6.0.4, could you explain it somewhere?
-
In the fig. 2.5. the RO data from the left panel indicated in brackets (2866) does not reflect/correspond to the RO WISE data. Also in the right panel, the perecentage (89%) does not reflect the RO WISE data.
Referring the Notes : the explanation in relation to the number of WBs classified for overall ecological status is not clear.
Also the inclusion of reservoirs in the river water body category in relation to benthic invertebrates assessment may lead to unaccurate results having in view that this BQE was excluded form the IC exercise at European level and subsequently being not assessed at national level.
-
(AT) Figure 2.5
Very confusing. Only one graph should be used. Information regarding percentage of unknown status is essential for interpreting the results, only left figure should be used.
Status can not be merged with potential!
-
BE-WAL (EC): p. 27 § blue
“BQE graph”: this is not the title of the graph
-
Fig 2.5
In figure 2.5 grey bars can be interpreted as a shortcoming in the monitoring programme. This could be the case, but could also be explained by the fact that the waterbody is not at risk and therefore not demanding any operational monitoring or that benthic invertebrates is not the quality element which is indicative of the pressures to which the body or bodies are subject. Surveillance monitoring should cover sufficient surface water bodies to provide an assessment of the overall surface water status.
River Basin Specific Pollutants
Ecological status includes the assessment of RBSPs[2]. The status of RBSPs was not reported for a large proportion of surface water bodies (around 50 %). At EU level, 88 % of water bodies with known RBSP status were in good ecological status[3]. The proportion of water bodies where RBSPs did not compromise good or high status ranged from [7% (NL) to 100% (FI)].
About 150 RBSPs were reported as causing failure to achieve good ecological status in at least one waterbody. Those most frequently reported as causing failure were the metals zinc, with 798 waterbodies failing to achieve good ecological status, and copper (522 such waterbodies). Other types of substances causing most failures were pesticides, such as glyphosate and its breakdown product AMPA. As individual substances, most RBSPs caused fewer than 100 waterbodies to fail good ecological status.
There are differences in the numbers of substances defined by countries as RBSPs (between 4 and 300) and differences in environmental quality standards applied. This means comparison between countries should be undertaken with care.
Of the thousands of chemicals in use and potentially present in surface waters, relatively few have been identified as causing failure. From the information reported, it is not known how many other chemical pollutants are present in surface waters, and whether their concentrations should be of concern. Further discussion on chemicals is provided in chapter 3 link and chapter 6 link.
|
Further and detailed information on RBSPs/quality elements results is available in WISE · Ecological status by RBSPs see Table and RBSPs status including water bodies with unknown status Table – graph* – graph2* · RBSPs causing failure to achieve good ecological status Table - TableEU – graph · table*, table_category* – table_Member_States* and specific RBSPs* |
* draft dashboards;
-
on page 27 is a footnote - 18:
the footnote goes over two pages - may be is is better to limit the footnote to one page? - please change only if possible
-
"Other types of substances causing most failures were pesticides, such as glyphosate and its breakdown product AMPA."
Please change: "metabolite" instead of "breakdown product"
-
"There are differences in the numbers of substances defined by countries as RBSPs (between 4 and 300) and differences in environmental quality standards applied. This means comparison between countries should be undertaken with care."
By our knowledge 6 is the lowest number of RBSP in a MS (Cyp) and the maximum number of RBSP is 167 in CZ.
Please check the numbers and / or cite a reference.
-
We suggest to delete the following sentence "From the information reported, it is not known how many other chemical pollutants are present in surface waters, and whether their concentrations should be of concern."
-
BE-FLA (KB): p. 27-28 The status of RBSPs was not reported for a large proportion of surface water bodies (around 50 %). About 150 RBSPs were reported as causing failure to achieve good ecological status in at least one waterbody. Those most frequently reported as causing failure were the metals zinc and copper. As individual substances, most RBSPs caused fewer than 100 waterbodies to fail good ecological status.
There are differences in the numbers of substances defined by countries as RBSPs (between 4 and 300) and differences in environmental quality standards applied. This means comparison between countries should be undertaken with care
Even with a warning included, it should be reflected whether producing percentages is meaningful, considering the differences.
-
"The proportion of water bodies where RBSPs did not compromise good or high status ranged from [7% (NL) to 100% (FI)]."
Suggest to remove country names, because the evaluation is based on different substances in each country or river basin.
-
BE-WAL (EC): p. 28 § blue
“table” : Zn in 20 water bodies for Belgium and 0 in the table "Member states*". Why ?
-
"Those most frequently reported as causing failure were the metals zinc, with 798 waterbodies failing to achieve good ecological status, and copper (522 such waterbodies)."
It should be indicated what the percentage of exceedances is, based on the total and reported number of water bodies. These numbers reported for Cu and Zn cannot be reconciled with the data shown in the tables behind the links below. The indication of the reference total numbers and of the related percentages, both in the report and in the underlying tables, would be therefore mostly helpful.
[E.g. for zinc the percentage in the WISE table is shown as ‘34%’. This means that from all of the RBSP failures for all countries, zinc contributed towards 34% of these (Zn failures = 1502). However, looking at the total no. of waterbodies (110950) and working out the percentage of zinc failures (1502), the actual percentage is 1.4%. The same remark applies also to copper, the actual percentage of failure is 1.01%].
Further, it is assumed that in the present analysis, these metals are assessed against a national EQS. In fact, the values (and methods of implementation) of EQS for specific pollutants can be hugely variable across MS (Vorkamp and Sanderson 2016): we believe this should be a point outlined in Section 1.3, rather than only indicated in the footnote. In fact, this is a tenuous comparison to report across EU waters when the metric by which the status is assessed varies significantly between countries.
Moreover, it is emphasised again that, in checking compliance of the metals like Zn and Cu, their bioavailability should be taken into account. It is unclear to what extent this has been done in the present assessment. For copper, it is clear that bioavailability has not always been considered, as many previous implementation studies in the UK, Germany, France and Sweden which do consider bioavailability have shown exceptionally low levels (<1%) of compliance failure. We suggest this should be stated.
An EU expert group is currently developing guidance for assessing metals like Zn and Cu, considering e.g. bioavailability. A second remark related to observed metal (e.g. Zn, Cu) levels in EU waters is related to their natural background (BG). Metals are naturally occurring in the environment, and their natural BG varies with geological conditions. In most EU countries, metalliferous geology is present at the local scale that may significantly influence the local natural BG of metals. Also to account for this phenomenon in compliance checking, guidance is being developed. It is anticipated that the non-compliance rates of the metals will significantly decrease when these factors are being taken into account. This should be mentioned in the report.
Reference:
Vorkamp K, Sanderson H. 2016. EQS variation study: European Environmental Quality Standards (EQS) Variability Study. Analysis of the variability between national EQS values across Europe for selected Water Framework Directive River Basin- Specific Pollutants. Aarhus University, DCE – Danish Centre for Environment and Energy, 96 pp. Scientific Report from DCE – Danish Centre for Environment and Energy No. 198. http://dce2.au.dk/pub/SR198.pdf
-
"Further and detailed information on RBSPs/quality elements results is available in WISE"
RBSP should not be listed by the CAS number of the metal. Instead the name of the element should be applied.
-
"RBSPs causing failure to achieve good ecological status Table"
This table shows that 1502 surface water bodies fail because of zinc and its compounds.
Below, "table_category* "
This table shows that the combined total of water bodies that fail because of zinc and its compounds is 798 (combined).
-
"There are differences ... defined by countries..." : Please add details on the chemical parameters that are taken into account in the different countries (especially because this number of parameters vary widely), e.g. a Table or a Figure.
2.4 Change in ecological status between first and second RBMPs
The quality of the ecological status classification has largely improved from the first to the second RBMPs. There is a marked reduction of unknowns, a marked improvement of confidence in classification and a large increase in the intercalibrated biological assessment methods.
However, the overall ecological status has not improved since the first RBMPs (figure 2.6). In fact, the results show a slight reduction in the proportion of water bodies in good or better ecological status or potential for all the water body categories. During the first RBMP cycle Member States have introduced better or new ecological monitoring programs with more monitoring sites and more quality elements included.
This complicates the comparison between the status in the first and second RBMPs. The results show that there is limited change in the ecological status from the first to the second RBMPs.
Figure 2.6. Ecological status or potential of all surface waters, rivers, lakes, transitional and coastal waters in the two RBMPs A) with known ecological status in first and second RBMP; and B) both known and unknown ecological status. <in the final report only one of the diagrams will be shown>Notes: SW are surface water bodies summarising all the water categories. The numbers in parenthesis are the number of classified waters bodies that are comparable between the two cycles of RBMPs (WISE evolution type nochange, change, changecode).
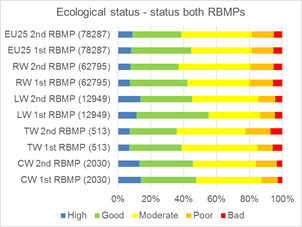

Source: Preliminary results based on WISE-SoW database including data from 25 countries
-
Figure 2.6: Please delete the diagram whitout the "unknowns" (left diagram) and change the titel.
-
Please delete the following sentence: "The results show that there is limited change in the ecological status from the first to the second RBMPs."
-
BE-FLA (RV): p. 28 §6 The quality of the ecological status classification has largely improved from the first to the second RBMPs. There is a marked reduction of unknowns, a marked improvement of confidence in classification and a large increase in the intercalibrated biological assessment methods.
The quality of the ecological status classification has largely improved from the first to the second RBMPs. [Complete evaluation: To be balanced against improvements in monitoring and reporting] There is a marked reduction of unknowns, a marked improvement of confidence in classification and a large increase in the intercalibrated biological assessment methods.
-
BE-FLA (RV): p. 29, Fig 2.6
Our choice is on the left diagram (A)
-
Fig. 2.6 with unknowns is more informative and gives reason for changes between 1st and 2nd RBMPs.
Unknown water bodies situated in the middle helps to compare proportions of both high-good and poor-bad water bodies.
-
(AT) Figure 2.6
Difficult to read the graphs. Use different presentation e.g. space between categories like in fig. 6.1.
Information regarding unknown status is important, right figure should be used. Status/potential can not be merged
-
BE-WAl (EC): p. 29 §1
“in the final report only one of the diagrams will be shown”: what about the one including unknowns?
-
SK: Page 28, next to the last paragraph: The paragraph „However, the overall ecological status has not improved since ....more quality elements included" should be revised. There in the Figure 2.6 – Ecological status - including unknowns and also in the Figure 2.7 (+ graph Surface water bodies: Ecological status or potential by category) almost all high and good statuses show improvements, although small. Generalizing information with excluded unknown water bodies in not a good way of data interpretation. Very positive is reduction of unknowns. Moreover the second sentence of this paragraph is inconsistent also with the statement in the first paragraph on the Page 5 and Page 55 in the 1st bullet point and in the first paragraph of the 6.1 chapter.
-
SK: Page 28, next to the last paragraph: Incorrect text in 3rd sentence. Wrong: “During the first RBMP cycle..”. Correct: “During the second RBMP cycle..” See also page 5, 3rd paragraph.
-
Figure 2.6 The figure legend says that only one of the diagrams will be shown. SE suggest to show the version that includes unknowns.
-
Fig 2.6 : If only one is to be kept, please Keep the 2nd with unknown, as it shows the knowledge has improved
-
Please add the number of biological quality elements that are taken into accound in the different countries, as agreed during EIONET Freshwwater Workshop.
A closer look at the change in quality elements shows some improvement (Figure 2.7). The improvements are seen in all the most commonly used Biological quality elements (BQEs) in rivers, and in phytoplankton in transitional waters, but is less clear in phytoplankton in lakes and benthic invertebrates in coastal and transitional waters. For phytoplankton in coastal waters, there is even a slight deterioration.
Most of the changes are not reported as consistent, but are rather due to changes in methodology. However, many countries have not reported on consistency, so it is unclear how the changes should be interpreted.
Figure 2.7. Ecological status or potential for major biological quality elements in surface waters in the first and second RBMPs.
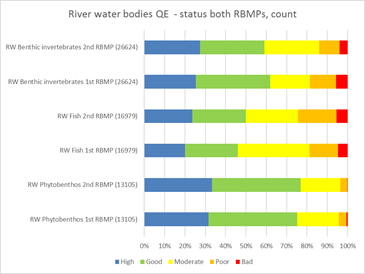
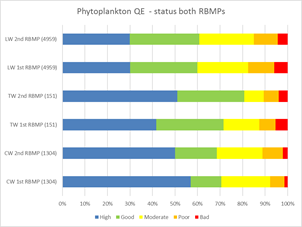
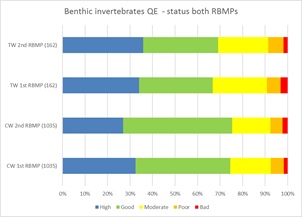
Notes: The numbers in parenthesis are the number of classified waters bodies that are classified for the single biological quality elements and that are comparable between the two cycles of RBMPs (WISE evolution types nochange, change, changecode).
Source: Preliminary results based on WISE-SoW database including data from 25 Member States EU28 except Greece, Ireland and Lithuania).
|
Further and detailed information on change in ecological status and status of quality elements from first to second RBMPs is available in WISE · Ecological status by category in first and second RBMPs graph* · Ecological status by category and Member States in first and second RBMPs graph* - · Ecological status by main quality elements by category in first and second RBMPs table* & graph* – graph2* |
* draft dashboards;
-
“A closer look at the change in quality elements shows some improvement (Figure 2.7). The improvements are seen in all of the most commonly used Biological quality elements (BQEs) in rivers, and in phytoplankton in transitional waters, but is less clear in phytoplankton in lakes and benthic invertebrates in coastal and transitional waters. For phytoplankton in coastal waters, there is even a slight deterioration.” It has to be admit also that the status for phytoplankton and macro-invertebrates deteriorates, while fish is equal. Due to different definitions, no clear picture can be given from macrophyte/phytobenthos/etc. Only when you look at different categories and parameters, some combinations show an improvement.
-
BE-FLA (RV): Figure 2.7 Notes
Changes have been indicated by MSs, but do not necessarily mean significant changes.
-
(AT): 2nd sentence
For RW benthic invertebrates there is no improvement in fig 2.7?!
2.5 Pressures and impacts
The main significant pressures causing risk of not achieving good ecological status are point and diffuse source pollution and hydromorphological pressures. The main impacts on surface water bodies are nutrient enrichment, chemical pollution and altered habitats due to morphological changes, reflecting the key pressures.
Diffuse pollution and point source pollution affects 38 % and 18 % of the surface water bodies, respectively. A relatively higher proportion of transitional and coastal water bodies are affected by pollution pressure compared to rivers and in particular lakes. The main drivers for point source pollution pressures are urban wastewater, followed to a lesser degree by industrial plants and storm overflow. For diffuse source pollution, the main driver is agriculture, followed by atmospheric deposition and discharges not connected to sewerage plants.
Hydromorphological pressures comprise all physical alterations of water bodies (including continuity interruptions) which modify their channel, shores, riparian zones, water level/flow, e.g. dams, embankments, channelization, flow regulation. These activities cause damage to the morphology and hydrology of the water bodies. They result in altered habitats, with significant impacts on the ecological status.
Figure 2.8. Proportion of water bodies affected by main pressures of all surface water bodies and by categories: rivers, lakes, transitional and coastal waters.

Notes: The term all SWBs means all surface water bodies summarizing rivers, lakes, transitional and coastal waters. A full attribution of main pressures to ecological status or chemical status is not possible. For diffuse source pollution, 25% of the classified water bodies have diffuse pollution only from atmospheric deposition, which is most relevant for chemical status.
Source: Preliminary results based on WISE-SoW database including data from 25 Member States EU28 except Greece, Ireland and Lithuania).
Hydromorphological pressures affect around 40 % of the surface water bodies, and the highest proportion is reported for rivers and transitional water bodies. Hydromorphological pressures are subdivided into further categories of pressures: physical alterations in the channel, bed, riparian zone or shore (26 %), as well as structures which impact longitudinal continuity (dams/barriers and locks, 24 %) affect the largest share of water bodies. Hydrological alterations affect a smaller share (7 %) of total surface water bodies.
Figure 2.9. Proportion of water bodies affected by main pressures (left) and detailed point source, diffuse source and hydromorphological pressures (right).

Note: Proportion of water bodies with specific pressures, for example, 18 % of water bodies are affected by point sources, and the main point source pressure is discharges from urban waste water treatment plants affecting 12 % of all surface water bodies. A water body may be affected by more than one pressure therefore the sum of percentages is greater than 100 % for the main significant pressures or the percentage for the groups, e.g. the sum of detailed point source pressures is greater than 18 %.
Source: Preliminary results based on WISE-SoW database including data from 25 Member States. EU28 except Greece, Ireland and Lithuania).
|
Further and detailed information on pressures and impact results is available in WISE · Main pressures by category table, · Main impacts by category table · Detailed pressures table; point source pressures table, diffuse source pressures table and hydromophological pressures table; abstraction pressures table; other pressures table |
* draft dashboards;
-
"Diffuse pollution and point source pollution affects 38 % and 18 % of the surface water bodies, respectively."
At pages 5 and 21 of the report diffuse pollution was given as 37 % . Please harmonize the values - is 37 or 38% the correct value?
-
"Hydromorphological pressures affect around 40 % of the surface water bodies, and the highest proportion is reported for rivers and transitional water bodies."
At pages 8 and 21 of the report 41% was given for hydromorphological pressures. Please harmonize the values.
-
In figure 2.8, the diagramm on the left-hand side can be deleted as the information is included in the diagramm on the right.
-
BE-FLA (RV): p. 30, §4 A relatively higher proportion of transitional and coastal water bodies are affected by pollution pressure compared to rivers and in particular lakes
Please, explain. Is it atmospheric deposition? Also, TC waters are lower in numbers + located downstream. Percentages give a wrong indication here.
-
BE-FLA (RV): p. 31, Fig 2.8:
Series 2 >> Atmospheric deposition
-
BE-FLA (RV): p. 31, §4 Hydrological alterations affect a smaller share (7 %) of total surface water bodies.
Hydrological alterations (water abstractions) affect a smaller share (7 %) of total surface water bodies. // Ref. p. 57
-
BE-FLA (RV): p. 32, Fig 2.9
Urban waste water >> UWWTPs
-
BE-FLA (RV): p. 32 note … affecting 12 % of all surface water bodies
p. 59: 70%
-
BE-FLA (RV-VVDL): p. 32 note … A water body may be affected by more than one pressure therefore the sum of percentages is greater than 100 % for the main significant pressures …
1) Check # water bodies not affected by main pressures and compare with water quality status
2) Give % of water bodies reported to be subject to multiple (at least 2) pressures
-
It should clearly stated out that ’Significant Pressures’ are those pressures which, either alone, or in combination with other pressures prevent or put at risk the achievement of WFD Article 4(1) Environmental Objectives including the achievement of good status, the non-deterioration of status, the avoidance of a significant and sustained upward trend in pollution of groundwater, and the achievement of objectives in WFD protected areas. Because of definition figures overestimates minor pressures which are typically combined with more significant pressures. For example forestry.
-
pg. 32 - Main impacts by category table
-for RO Acidification impact type is missing
- for Altered habitats due to morphological change, the RO number is not correct (in the EEA table there are 47 WBs but in RO WISE there are 43 WBs)
The same comments are relevant also for the pg. 40.
-
"These activities cause damage to the morphology and hydrology of the water bodies. They result in altered habitats, with significant impacts on the ecological status."
Not all changes cause damage to ecology, which is the focus of the WFD. Proposal: Instead of two sentences, modify the last sentence: "The changes of" hydrology and morphology may result in ...
-
(AT) Figure 2.8, right figure
The presentation of the athmospheric fraction is not really clear. What means 'Series2'?
-
(AT) Figure 2.9 'Hydromorphology'
What is meant with ”HYMO alteration – Other”? Should be explained.
-
SK: Figure 2.8 (right): Correct title/description for “series 2” is missing in the legend.
-
Paragraph before figure 2.9, last sentence 'Hydrological alterations affect a smaller share (7 %) of total surface water bodies.': Such numbers do not take into account the size of the body; one WB can be very different in size from the other; it would be good to rectify this in the final report, otherwise the information can be misleading
[1] In the analyses in this report, no distinction has been made between ecological status and potential. The criteria for classification of natural water bodies (ecological status) and HMWBs or AWBs (ecological potential) vary, but the ecological conditions they reflect are assumed to be comparable, having the same deviation from reference conditions.
[2] RBSPs are substances discharged in significant quantities into a water body and are identified by Member States. Environmental quality standards (EQS) are set by the Member State, often at national level but can be at river basin district level. Where the environmental quality standard is exceeded, a water body cannot not be in good or better status. In contrast with priority substances, which are considered under chemical status (chapter 3) the comparability of number of substances set as RBSPs and the value of the EQS can vary between Member States.
[3] Ecological status by RBSPs see Link and RBSPs status including water bodies with unknown status Link
-
Comment to footnote no. 1: It is stated that no distinction has been made between ecological status and potential. It is not clear from the report how data from artificial and strongly modificied water bodies are included in the analysis and the presentation of the results.
-
Comment to footnote no. 1: It is stated that no distinction has been made between ecological status and potential. It is not clear from the report how data from artificial and strongly modificied water bodies are included in the analysis and the presentation of the results.
it is suggested to be checked the following sentence part, having in view that surface water bodies are in good AND (not OR) high ecological status look to be around 40%
“On a European scale, around 40 % of the surface water bodies are in good or high ecological status,..