
Table of contents
- Guidance to the reader
- General comments
- Executive summary
- 1. EEA State of Water assessment and EU water policy context
- 2. Ecological status and pressures
- 3. Chemical status and pressures in surface waters
- 4. Groundwater chemical status and pressures
- 5. Groundwater quantitative status and pressures
- 6. Overall status, progress achieved and future challenges
3. Chemical status and pressures in surface waters
3. Chemical status and pressures in surface waters
Key messages
- 38 % of surface water bodies in the EU are in good chemical status.
- Only a few substances are responsible for failure to achieve good chemical status in many Member States, in particular mercury and brominated diphenylethers (flame-retardant).
- Without these and similar ubiquitous priority substances, chemical status would improve to 81 %, with 3 % of surface waters not achieving good chemical status and 16 % of water bodies having unknown chemical status.
- The main pressures leading to failure of good chemical status are atmospheric deposition and discharges from urban waste water treatment plants. Atmospheric deposition leads to contamination with mercury in most of the water bodies failing good chemical status. Inputs from urban waste water treatment plants are less significant but lead to contamination with PAHs, mercury, cadmium, lead and nickel.
- It is complicated to compare chemical status from first to second RBMPs due to more monitoring of pollutants, and some Member States in second RBMPs identifying all surface water bodies to fail good chemical status due to mercury.
- Comparison of the chemical status reported in the first and second RBMPs periods shows that the proportion of water bodies with unknown chemical status has dropped significantly, from 39 % to 16 %.
- During the first RBMP cycle, Member States have made progress in tackling several other problematic substances, such as heavy metals (cadmium, lead, and nickel) and several pesticides, suggesting effective measures have been implemented.
- The outlook for chemical status in Europe's waters is challenging, because of the addition in 2021 of new substances to the Priority Substances list and the entry into force of stricter standards for some existing priority substances (from 2015)
3.1 Introduction
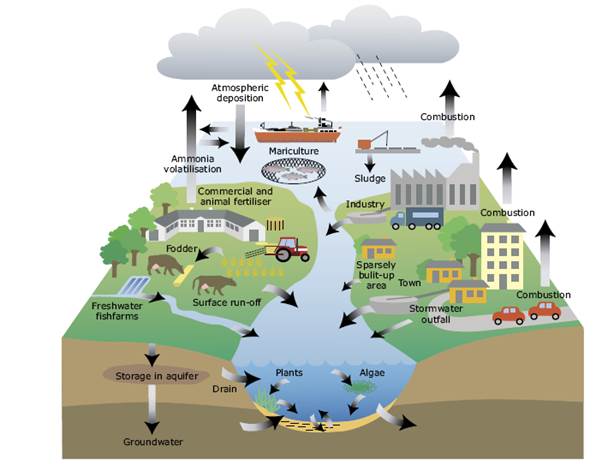
Chemicals are used in products which we make use of in many different ways to try and improve our quality of life, from food production to health protection to transport and heavy industry. At some point in their lifetime, chemicals can enter the water cycle, whether by deliberate discharge following waste water treatment, or as a result of processes such as leaching from soils into groundwater, run-off from surfaces, or atmospheric deposition (including the “raining out” of small particles taken up into the atmosphere). Some chemicals can be very harmful through direct toxicity, such as through sublethal effects which affect an organism’s healthy functioning, or can become problematic as they accumulate up the food chain. Once in the environment, it can be very difficult both to clean up harmful chemicals and to prevent their migration to places distant from original use. Thus much source control legislation for chemicals, such as REACH and the Regulation on Biocidal Products, is aimed at minimising release of harmful substances into the environment. Monitoring under the WFD provides key feedback as to the success of measures intended to restrict harmful releases (chapter 6).
The WFD aims to ensure the good chemical status of both surface water and groundwater bodies across Europe. For surface waters this goal is defined by limits on the concentration of certain pollutants relevant across the EU, known as priority substances[1]. In addition, there may be other chemicals discharged in significant quantities within a river basin district. These River Basin Specific Pollutants (RBSPs) are part of the assessment of good ecological status (chapter 2).
Good chemical status means that no concentrations of priority substance exceed the relevant environmental quality standards (EQS) established in the Environmental Quality Standards Directive 2008/105/EC (as amended by the Priority Substances Directive 2013/39/EU[2]). EQS are set to protect the most sensitive species by direct toxicity, including predators and humans via secondary poisoning.
The WFD seeks to progressively reduce emissions, discharges and losses of priority substances to surface waters. Under the WFD, losses, discharges and emissions to water of a particularly harmful subset of these, priority hazardous substances, should be completely phased out within 20 years, and the uses of these substances have been significantly restricted.
A smaller group of priority hazardous substances were identified in the Priority Substances Directive as uPBTs (ubiquitous[3], Persistent, Bioaccumulative and Toxic). uPBTs persist in the environment, can be transported long distances and pose long-term risks to human health and ecosystems. Owing to widespread environmental contamination, achieving concentrations at or below the EQS for this group of substances can be particularly challenging.
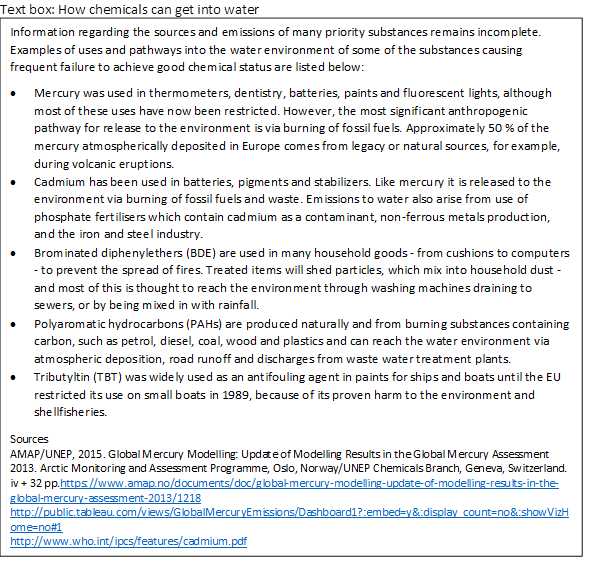
Text box: How chemicals can get into water
|
Further and detailed information on chemical status assessment is available in WISE · Monitoring of chemical status (see chapter 1) · Change in proportion unknowns unknown chemical status · Confidence in: SWB chemical status assessment Table and Graph*; |
* draft dashboards;
3.2 Chemical status of surface waters
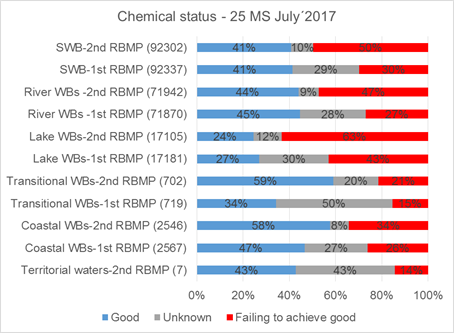
Reporting under the second RBMP shows that 38 % of surface water bodies are in good chemical status (by number of waterbodies), while 46 % are not achieving good status and the status of 16 % is unknown (Figure 3.1). While the percentage of water bodies in good status is more or less similar in rivers and in transitional and coastal waters at 40-58 %, that in territorial waters and lakes is considerably lower (15-24 %). The lower quality of lakes is driven by widespread contamination by mercury in Finland and Sweden.
Figure 3.1: Chemical status of surface water bodies, with and without and uPBTs
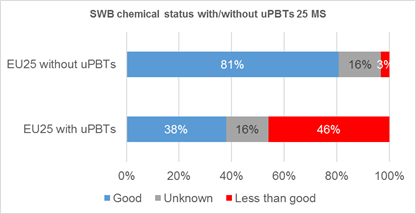
Note: For some surface water bodies in Poland (1265 WBs) and Italy (265 WBs), there is no information on the priority substances causing failure and it is therefore not possible to identify if the failure is caused by uPBTs or other priority substances.
Source: Preliminary results based on WISE-SoW database including data from 25 Member States (EU28 except Greece, Ireland and Lithuania).
The uPBTs are mercury, polybrominated diphenylethers (“BDEs”), tributyltin and certain[4] polycyclic aromatic hydrocarbons (PAHs). Widespread failure of mercury, and to a lesser extent BDEs (used as flame retardants), leads to significant failure to achieve good chemical status, as can be seen in Figure 3.2, where omission of the uPBTs shows 3 % of the surface water bodies as not being in good chemical status.
Map 3: Chemical status per RBD – one map with uPBTs and one map without uPBTs A map has not been included – EEA is exploring different option on presenting the information on interactive map services. The map service should present chemical status per RBD for either the first or second RBMP with filters for the four categories (rivers, lakes, transitional and coastal waters) and by count of water bodies and by size (Length for rivers; and area for the other categories) and with pop-up windows with the results for the specific RBD. See results for map Table
There are substantial differences between Member States. Some report that over 90 % of their surface water bodies are in good chemical status, while others report that fewer than 10 % are in good chemical status (Figure 3.2). In addition, the proportion with status reported as “unknown” differs widely between Member States. For several Member States there is a marked change in the proportion failing to achieve good chemical status when the water bodies failing due to uPBTs are omitted.
Figure 3.2: Chemical status of all surface water bodies, with all priority substances (on left) and without uPBTs (on right)
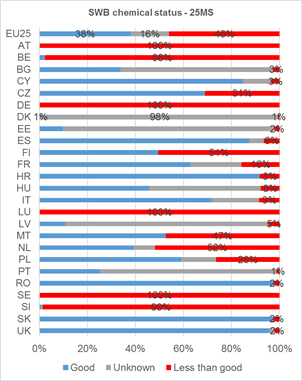
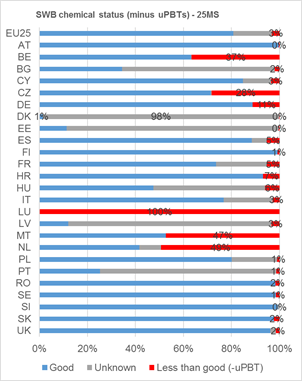
Note: For some surface water bodies in Poland (1265 WBs) and Italy (265 WBs), there is no information on the priority substances causing failure and it is therefore not possible to identify if the failure is caused by uPBTs or other priority substances.
Source: Preliminary results based on WISE-SoW database including data from 25 Member States (EU28 except Greece, Ireland and Lithuania).
Some variation between Member States might be expected, owing to differences e.g. in population density, industry or geography, but such extreme variation needs to be understood. Member States have interpreted information in different ways, leading to some variation. For example, some Member States applied the revised – generally stricter - EQS set out in the 2013 amendment to the Priority Substances Directive (LU, NL, SE) while most countries used those from the 2008 version of the Directive. However, the major contribution to variability seems to arise from the approach taken to monitoring, modelling and extrapolation of results, and from the choice of monitoring matrix – water, sediment or biota (e.g. fish). Some countries extrapolated failure of the standard at monitoring sites to all water bodies, while others reported failure only where failure was confirmed (Table 3.1). Typically, measurements of mercury in biota extrapolated to all similar waterbodies lead to widespread failure to meet the EQS.
Luxembourg failed to achieve good chemical status in any of its surface water bodies, owing to application of the 2013 EQS for fluoranthene, while neighbouring countries applied the 2008 standard.
Table 3.1 Broad approaches to chemical status reporting, based on results shown in Fig 3.2.
|
With uPBTs |
Without uPBTs |
Approach taken |
Countries using this approach |
|
Widespread (80-100%) failure to achieve good chemical status |
Few failures to achieve good chemical status |
Extrapolation of monitoring results – usually, mercury in biota |
AT, (BE), DE, FI, (LU) SE, SI |
|
Frequent (30-50%) failure to achieve good chemical status |
Frequent/widespread failure to achieve good chemical status |
Other priority substances identified as causing failure to achieve good chemical status |
(BE), CZ, (LU), MT, NL |
|
Widespread good chemical status |
Widespread good chemical status |
Extrapolation not widely applied: status shows confirmed status only |
CY, ES, FR, HR, IT, PL, RO, SK, UK |
|
Frequent/widespread unknown chemical status |
Frequent/widespread unknown chemical status |
Extrapolation not widely applied: status shows confirmed status only |
BG, DK, EE, HU, LV, PT |
|
Further and detailed information on chemical status is available in WISE · Surface water bodies: Number and Size, by Chemical status Table · Chemical status by category, Member States – Table and with and without uPBTs graphEU - graphMS - MemberStates · Chemical status by RBDs (Maps) results for map Table - with and without uPBTs · Chemical status in 2015 Table |
* draft dashboards;
3.3 Chemical substances causing failure in achieving good status
Chemicals legislation focuses on controlling the use of a particular substance, supported by regulation to control emissions. Chemical status under the WFD provides an overview of contamination and the effectiveness of measures. If a priority substance is causing failure, either pollution prevention is not yet delivering the required environmental objective, or the contamination results from historic sources. For some substances, chemical pollution may be a local issue which can be controlled within the river basin district. But where several Member States report that a substance is not meeting the standard for good chemical status, and a significant number of waterbodies are failing the standard, the issue may be of wider concern, particularly where persistent, bioaccumulative and/or toxic substances are concerned.
Table 3.2 shows the most frequently reported “top 15” priority substances found in surface water bodies; all the uPBTs are in this list. Looking at the number of water bodies it is clear that mainly mercury and brominated diphenylethers are responsible for failure to achieve good chemical status. The other substances cause failure in relatively low numbers of water bodies. Table 3.2 shows that large numbers of records from a particular Member State can significantly impact the listing of “most frequently reported” substances failing a standard. Therefore, in terms of understanding the relevance of a pollutant at a European scale, a larger number of countries reporting a particular substance is indicative of more widespread issues.
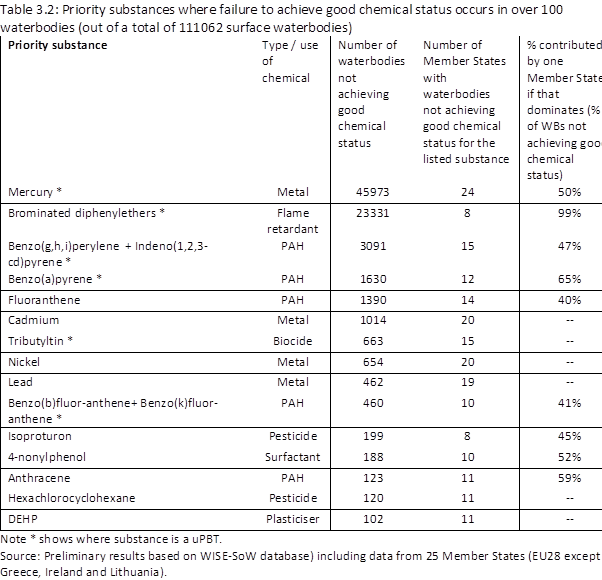
Note * shows where substance is a uPBT.
Source: Preliminary results based on WISE-SoW database) including data from 25 Member States (EU28 except Greece, Ireland and Lithuania).
Some priority substances are causing few or no failures to achieve good chemical status, suggesting that efforts to control them have been effective [ref ch 6 / 1.5.2a chemicals report]. Those affecting fewer than 15 waterbodies are shown in table 3.3.
Table 3.3 Priority substances where good chemical status reported in all but 15 waterbodies or fewer (out of 111 062 surface water bodies)
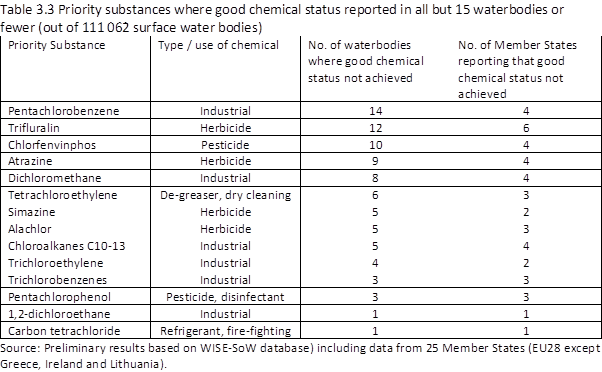
Source: Preliminary results based on WISE-SoW database) including data from 25 Member States (EU28 except Greece, Ireland and Lithuania).
3.4 Chemical pressures
Priority substances are or have been emitted to water bodies through a range of pathways and from a variety of sources, including industry, agriculture, transport, mining and waste disposal, as well as from our own homes. Significant levels of some priority substances have built up from historic use and this legacy pollution may persist in water bodies long after polluted discharges and inputs have ended. In addition, some priority substances occur naturally, e.g. metals and PAHs, so achieving near natural, “background” concentrations is the objective for such substances.
Chemicals used in industrial processes and products sometimes enter sewers and, via waste water treatment plants, are discharged into water bodies. Burning of fossil fuels and waste leads to emission of some hazardous substances, and subsequent deposition from the atmosphere can be a major pathway for such substances to move long distances before they enter the water environment. Pesticides used in agriculture have been widely detected in groundwater and surface water. Mining can exert locally significant pressure upon the chemical quality of water resources in parts of Europe, particularly with respect to the discharge of heavy metals. Landfill sites and contaminated land from historical industrial and military activities can be a source of pollution for the aquatic environment. Shipping, harbour and port activities, and aquaculture can lead to the emission of a variety of chemical pollutants.
The major pressure reported by Member States as causing failure in good chemical status, was atmospheric deposition leading to contamination with mercury. Inputs from urban waste water treatment plants were less significant but led to contamination with PAHs, mercury, cadmium, lead and nickel.
|
Member States have reported an inventory of priority substances emitted into each river basin. The input most commonly recorded was that from waste water treatment plants, which may reflect the relative ease of monitoring such sources as compared with others, such as run-off or diffuse pollution (e.g. atmospheric deposition). The most frequently reported substances were the metals - mercury, lead, cadmium and nickel, which occurred in nearly all river basins (110 at May 2017) while all the priority substances were reported as being emitted into at least [25] river basin districts. The presence of a priority substance in a river basin, without causing many failures of chemical status, indicates that controls to maintain concentrations below the environmental quality standard are effective. All the priority hazardous substances were recorded as being emitted into some river basins, suggesting the cessation of emissions target for such substances remains challenging (WFD Art. 6(6)). (See also RBSPs in chapter 2.3 and discussion in chapter 6.) |
|
Further and detailed information on pressures and impact results is available in WISE · Main pressures by category table, · Main impacts by category table · Detailed pressures table; point source pressures table, diffuse source pressures table and other pressures table |
3.5 Changes between the first and second RBMPs
Comparison of the chemical status reported in the first and second RBMPs shows that the proportion of water bodies with unknown chemical status has dropped significantly. Chemical status has improved in transitional and coastal waters, remained similar in rivers and declined slightly in lakes (Figure 3.3). Thus, the knowledge on chemical status has improved, but, in return, a higher number of water bodies is classified as failing to achieve good chemical status.
Figure 3.4 Change in chemical status of surface water bodies by water category
Note: Proportion of surface water bodies in good and failing to achieve good chemical status. Overall percentage is different from that in Fig 3.2 owing to the need to compare similar water bodies in each period. Based on all water bodies in first and second RBMPs the change in unknowns is from 39 % to 16 %.
Source: Preliminary results based on WISE-SoW database) including data from 25 Member States (EU28 except Greece, Ireland and Lithuania).
|
Further and detailed information on chemical status results is available in WISE · Comparison of chemical status in first and second RBMP periods table* - graphEU - graphMS – MemberStates - |
* draft dashboards;
However, Member States are making significant progress on tackling certain individual priority substances, excepting mercury, BDEs and PAHs. In several cases, a third of waterbodies improved between the first and second RBMP cycle for a particular priority substance (Figure 3.5).
For cadmium, nickel and lead, 969 water bodies improved in status during the first RBMP cycle compared to 2288 water bodies still failing in the second RBMPs. For pesticides (isoproturon, endosulfan, chlorpyrifos, diuron, DDT, total DDT, cyclodiene, trifluralin, atrazine, alachlor), 554 water bodies improved from failing to good compared to 525 water bodies failing to achieve good chemical status in the second RBMPs. If this development continues in the next RBMP cycle, the number of water bodies failing to achieve good status as a result of priority pesticides may become very low.
Figure 3.5: Numbers of water bodies where status of a priority substance has improved since first RBMP and the number failing in the second RBMPs.
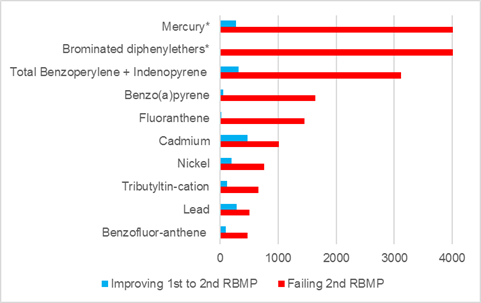
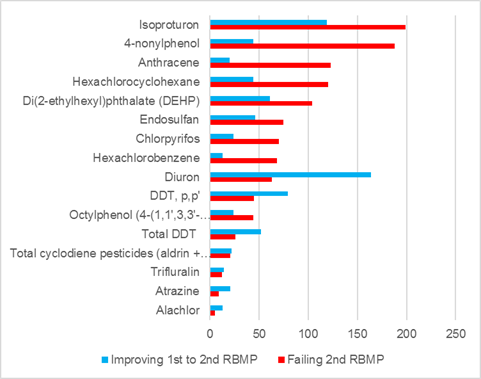
Note: Member States have reported if a priority substance improved from failing to achieve good to good chemical status since the first RBMP. This is compared with the number of water bodies failing in the second RBMPs. The diagram has been split into two to account for differences in number of water bodies. Mercury and brominated diphenylethers were causing failure in 45973 and 23331 water bodies, respectively.
Source: Preliminary results based on WISE-SoW database) including data from 25 Member States (EU28 except Greece, Ireland and Lithuania).
Chemicals designated in 2001 (and listed with EQS in 2008) as priority substances represent those recognised for a long time as being harmful to or via the aquatic environment. They are a small subset of the thousands of chemicals in daily use and in many cases restrictions have been in place for decades. More recent concerns, for example newly-identified harmful substances or issues such as toxicity of mixtures of chemicals, are not reflected in the list of priority substances relevant for the second RBMP reporting. However, some indication of the on-going challenge for chemicals is provided by reporting of certain countries which applied the new and revised standards under the Priority Substances Directive. These standards, which should be met in 2021, were applied by e.g. Sweden, where the revised biota standard for brominated diphenylethers (flame retardardants) was failed in all waterbodies; and Luxembourg, where the revised standard for fluoranthene (a PAH) was failed in all surface waterbodies.
[1] http://ec.europa.eu/environment/water/water-dangersub/pri_substances.htm
[2] http://eur-lex.europa.eu/LexUriServ/LexUriServ.do?uri=OJ:L:2013:226:0001:0017:EN:PDF
[3] Definition of ”ubiquitous” - present, appearing, or found everywhere
[4] Benzo(a)pyrene , benzo(g,h,i)perylene, indeno(1,2,3-cd)pyrene, benzo(b)fluor-anthene and benzo(k)fluor-anthene