
Post a comment on the text below
3.5 Changes between the first and second RBMPs
Comparison of the chemical status reported in the first and second RBMPs shows that the proportion of water bodies with unknown chemical status has dropped significantly. Chemical status has improved in transitional and coastal waters, remained similar in rivers and declined slightly in lakes (Figure 3.3). Thus, the knowledge on chemical status has improved, but, in return, a higher number of water bodies is classified as failing to achieve good chemical status.
Figure 3.4 Change in chemical status of surface water bodies by water category
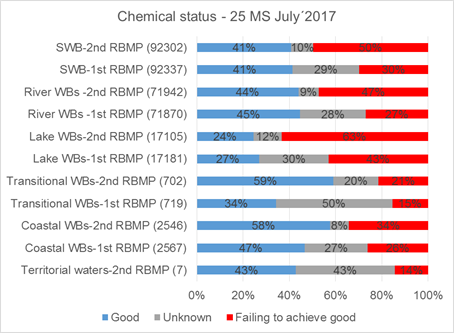
Note: Proportion of surface water bodies in good and failing to achieve good chemical status. Overall percentage is different from that in Fig 3.2 owing to the need to compare similar water bodies in each period. Based on all water bodies in first and second RBMPs the change in unknowns is from 39 % to 16 %.
Source: Preliminary results based on WISE-SoW database) including data from 25 Member States (EU28 except Greece, Ireland and Lithuania).
|
Further and detailed information on chemical status results is available in WISE · Comparison of chemical status in first and second RBMP periods table* - graphEU - graphMS – MemberStates - |
* draft dashboards;
You cannot post comments to this consultation because you are not authenticated. Please log in.
Previous comments
50% chemical status less than good in Fig 3.4, while this is 46% in Fig 3.2 and 3.1.