
Table of contents
- Guidance to the reader
- General comments
- Executive summary
- 1. EEA State of Water assessment and EU water policy context
- 2. Ecological status and pressures
- 3. Chemical status and pressures in surface waters
- 4. Groundwater chemical status and pressures
- 5. Groundwater quantitative status and pressures
- 6. Overall status, progress achieved and future challenges
4. Groundwater chemical status and pressures
- Agriculture is the main pressure causing failure of chemical status of groundwater, through pollution by nitrates and pesticides. Nitrates affect over 18 % of the area of groundwater bodies.
- In total 160 pollutants caused failure to achieve good status. Most pollutants were reported in few Member States, and only fifteen pollutants were reported by five or more Member States.
- There is only limited improvement in groundwater chemical status between the first and second River Basin Management Plans as a result of sustained pressure from agriculture and lag time in recovery.
4.1 Introduction
Groundwater provides a major source of drinking water for many EU citizens and provides the steady, base flow of rivers and wetlands. Maintaining this flow and keeping it free from pollution is vital for both humans and surface water ecosystems.
Pressures on groundwater chemical quality may arise mainly from diffuse pollution of nitrates and pesticides. Diffuse pollution, caused by nitrates applied to land in fertiliser or in manure and by pesticides, presents a significant and widespread challenge. Nitrogen pollution can also occur in areas where there is no sewerage system. Contaminated industrial sites, waste sites and old mines can lead to contamination by organic pollutants and metals such as arsenic, lead and copper. Pollutants may also be of natural origin, for example, when the bedrock contains high concentrations of metals and salts such as sulphates and fluorides. In coastal areas, saltwater may intrude into the groundwater aquifer where freshwater is abstracted e.g. for drinking water supply.
Once pollutants are in the groundwater, recovery can take years or even many decades, owing to residence times and slow degradation of pollutants. The time of recovery will depend on many factors such as the nature of the hydrogeological setting, the rate of groundwater recharge and the properties of the pollutant.
The Water Framework Directive requires Member States to designate separate groundwater bodies and ensure that each one achieves “good chemical status”. The volume of the water bodies is addressed by groundwater quantitative status (chapter 5).
Good groundwater chemical status is achieved when the concentrations of pollutants:
- show no signs of saline intrusion in the groundwater body,
- do not exceed the applicable quality standards,
- do not result in failure of ecological or chemical status of associated surface waters nor any significant damage to terrestrial ecosystems which depend directly on the groundwater body, andTo be good quality groundwater, hazardous substances should be prevented from entry into groundwater and the entry into groundwater of all other pollutants – such as nitrate - should be limited. Additionally, Member States must prevent deterioration of status, reverse any significant and sustained upward trends in pollutant concentrations in groundwater, and, as with priority substances in surface water, progressively reduce pollution.
Chemical status in groundwater is assessed as good or failing to achieve good chemical status, according to compliance with EU standards of nitrates (50 mg/l[1]) and pesticides (0.1 µg/l individual; max 0.5 µg/l total), and with “threshold values” for other groundwater pollutants established by Member States. These threshold values can be set at groundwater body, national, river basin or international river basin level, with criteria[2] broadly requiring that:
- Concentrations do not present significant environmental risk
- Provisions do not apply to high concentrations of naturally-occurring substances
- Should consider impact on, and interrelationship with, associated surface waters and directly dependent terrestrial ecosystems and wetlands;
- Shall take into account human toxicology and ecotoxicology knowledge.
4.2 Groundwater chemical status
Status in second river basin management plans
Reporting by Member States for the second RBMPs shows that 74 % of EU groundwater bodies (by area) are in good chemical status and 25 % fail to reach good chemical status, with 1 % where status is unknown (Figure 4.1).
Figure 4.1 Groundwater chemical status of groundwater bodies reported in first and second RBMPs
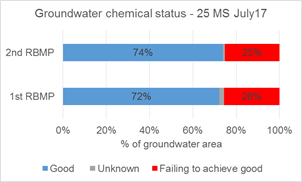
Note: Proportion of groundwater area in good and failing to achieve good chemical status. Total groundwater area (EU25) is 4.3 million km2.
Source: Preliminary results based on WISE-SoW database including data from 25 Member States (EU28 except Greece, Ireland and Lithuania).
|
Further and detailed information on improvements in groundwater chemical status assessment is in WISE · Monitoring of groundwater chemical status – number of monitoring sites (missing) · Change in proportion unknowns: unknown chemical status · Confidence in GW chemical status assessment Table and Graph* |
* draft dashboards;
Member States should identify whether the chemical status of a groundwater body is at risk. The aim of the risk assessment is to assess the effort needed to meet good chemical status and prevent the deterioration of good status. In the second RBMP, the overall proportion of groundwater bodies not at risk of achieving good quality status was slightly lower at 69% than those in good chemical status (74%), although there was significant variation at country level, from no water bodies being at risk to 99% being at risk.
[To review: Lowest groundwater quality is focused in central and western Europe where there [is intensive agricultural production, and in some cases, where there was heavy industry (Figure/map 4.2.]
Figure 4.2 Map of river basin groundwater chemical status – currently 2012 map: will be updated
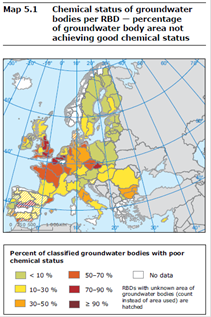
An updated map has not been included – EEA is exploring different option on presenting the information on interactive map services. The map service should present chemical status per RBD for either the first or second RBMP with different filters and with pop-up windows with the results for the specific RBD. The RBD and subunit results are available by the below links in WISE.
|
Further and detailed information on groundwater chemical status results is available at in WISE · Groundwater chemical status Table (EU & MS by geological formation) Table2; Graph*, Graph2 (MS comparison); MemberStates · Comparison of groundwater chemical status Graph; GraphMS; MemberStates · Groundwater at risk failing chemical status Groundwater area at risk* · Groundwater area, expected good chemical status Table |
* draft dashboards;
Intercomparability of groundwater chemical assessment
The range in good groundwater chemical status is from [38%] to 100%. As with RBSPs (chapter 2.3), Member States identify substances which pollute groundwater bodies and set “threshold values” at national level as a benchmark for good chemical status. This can lead to a range of approaches, for example, some Member States have considered threshold values for over 90 pollutants, while others have assessed status using fewer than 10. The monitoring of more substances could lead to a greater chance of failing to achieve good chemical status. In addition, the range of concentrations for which threshold values are set can vary quite widely and there are differences in methodologies for establishing threshold values and natural background levels. These factors together mean that caution should be applied when comparing groundwater chemical status between countries.
Change in status between first and second RBMPs
There has been little change in the chemical status of groundwater bodies since the first RBMPs, with an increase in good chemical status of 2% at EU level (Figure 4.1). This perhaps reflects the long timescales which may be involved in observing changes in groundwater quality after measures have been introduced to reduce pressures, or that effective measures have yet to be taken. There may also have been changes in the selection of relevant pollutants and changes in the threshold values, affecting direct comparison between the two RBMPs.
4.3 Reasons for failure to achieve good chemical status
Failure to achieve good chemical status was most frequently attributed to “general water quality”. This reason considers significant impairment of human uses and significant environmental risk from pollutants across the groundwater body, but it does not include assessment of more stringent objectives, such as those for drinking water or dependent terrestrial ecosystems.
The second most frequent reason was failure owing to requirements for Drinking Water Protected Areas; other reasons were less significant (Figure 4.3).
Figure 4.7 4.3. Reason for failure of good chemical status by area (number of countries in brackets

Source: Preliminary results based on WISE-SoW database including data from 25 Member States (EU28 except Greece, Ireland and Lithuania). Latvia reported all groundwater bodies in good chemical status.
|
Further and detailed information on groundwater reason for failing chemical status is available in WISE · Groundwater bodies: reasons for failure to achieve good chemical status Table - TableEU |
Pollutants causing failure to achieve good status
In total, 160 chemicals were reported as causing poor chemical status. Some of these (iron, potassium, bicarbonate, calcium, magnesium, sodium and hardness) may be considered by some countries to characterise the natural background conditions of the aquifer and so in those places are not necessarily classified as anthropogenic pollutants. Electrical conductivity may be attributed to saline intrusions, where freshwater abstraction draws in saltwater, as only Member States with coastal areas reported this as a reason for failure.
The main pollutant causing failure to achieve good chemical status is nitrate. “Pesticides” are also reported as causing a large number of failures of good chemical status. Nitrate is the predominant groundwater pollutant throughout the EU (reported by 24 Member States causing failure in 18 % of groundwater area) (figure 4.3). Pesticides cause failure in 6.5 % of the groundwater bodies (by area).
Figure 4.3 Substances causing failure to achieve good chemical status in at least five Member States.
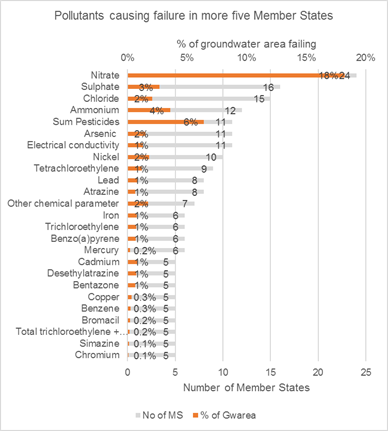
<needs to be updated with corrected EEA_00-00-0 other parameter & to change ”Sum pesticides” to ”Pesticides”>
Note: Pollutants causing failure in at least five Member States, shown by % of total GWB area
Source: Preliminary results based on WISE-SoW database including data from 25 Member States (EU28 except Greece, Ireland and Lithuania).
The list of substances most frequently leading to groundwater bodies not achieving good chemical status is dominated by substances used in agriculture (e.g. nitrate) and arising from salt intrusion (e.g. chloride). In addition, some industrial chemicals e.g. tetrachloroethylene, and metals arising from e.g. mining, contaminated sites and waste water, such as arsenic, nickel and lead, are causes of failure to achieve good chemical status.
|
Further and detailed information on groundwater pollutants including threshold values is available in WISE · Number and name of groundwater pollutants per Member State Table - TableEU - Graph |
Significant upward trend and trend reversal of pollutants
The Groundwater Directive requires that significant and sustained upward trends of pollutants should be identified and reversed. A significant trend is one that could lead to a groundwater body failing to meet its environmental objectives before 2021, if measures are not put in place to reverse it. Only a few countries reported any upward trend for the first RBMP, so comparison is difficult.
The total groundwater area with identified upward trend (9.9 % of groundwater area) is nearly double the area with a trend reversal (5.9 % of groundwater area).
Significant and sustained upward trends were identified for 58 pollutants, mainly for nitrate, which were detected in 19 Member States (Figure 4.4). Other substances with upward trends are similar to those in Figure 4.3.
In contrast, trend reversals were reported for 65 pollutants by 14 Member States (Figure 4.5), mainly for nitrates, sulphates, ammonium and chlorides.
Figure 4.4. Pollutants with an upward trend by area of groundwater bodies
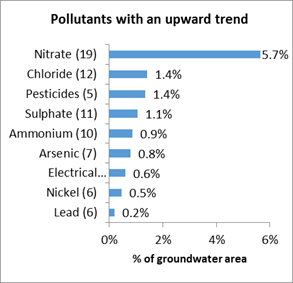
Figure 4.5. Pollutants with a trend reversal by area of groundwater bodies
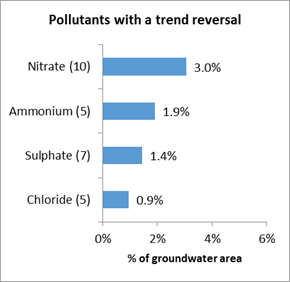
Note Over 10 GWBs and over four countries shown - Number of countries in brackets
Source: Preliminary results based on WISE-SoW database including data from 25 Member States (EU28 except Greece, Ireland and Lithuania).
As groundwater chemical data for second cycle RBMPs were mainly collected during 2010 – 2012 and the effect of measures is likely to take time, increased trend reversal of existing pollutants may be expected in future years.
|
Further and detailed information on groundwater pollutants with upward trend or trend reversal is available in WISE · Groundwater pollutants trend reversal · Groundwater pollutants upward trend |
4.4 Pressures on groundwater chemical status
Most countries report diffuse sources of pollution as being a pressure for groundwater (24 out of 25 Member States), while 20 reported point sources as a pressure. Diffuse sources affect 22 % of the groundwater bodies by area (Figure 4.7). Diffuse pollution from agriculture is the major pressure causing failure of good chemical status affecting 20 % of groundwater bodies (by area). Other pressures are of less significance (Fig. 4.7).
Fig 4.7 Main pressures identified in relation to groundwater chemical status
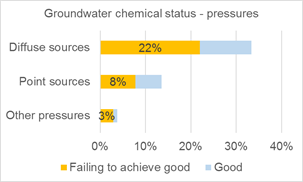
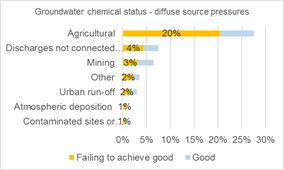
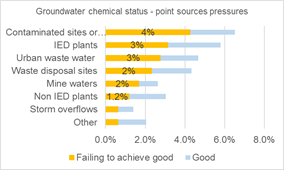
Note: Proportion of groundwater area affected by the main pressure groups and by detailed pressures for diffuse sources and point source pressures. Some Member States have reported groundwater bodies in good chemical status with diffuse or point source pressures, the proportion of these are indicated by light blue in the diagrams. Remark differences in the scale of the X-axis.
Source: Preliminary results based on WISE-SoW database including data from 25 Member States (EU28 except Greece, Ireland and Lithuania). Latvia reported all groundwater bodies in good chemical status.
The main impacts were chemical (22 % of groundwater bodies by area) and nutrient pollution (19 %).
|
Further and detailed information on pressures and impacts in relation to chemical status is available in WISE · Groundwater chemical status, main pressure groups table · Groundwater chemical status, detailed pressures point pollution sources, diffuse pollution sources, · Groundwater chemical status, significant impacts - table |
[1] Note, some Member States set more stringent nitrate standards (below 50 mg/l).
[2] Specific criteria are set out in Annex II of the Groundwater Directive REF