
Post a comment on the text below
Member States should identify whether the chemical status of a groundwater body is at risk. The aim of the risk assessment is to assess the effort needed to meet good chemical status and prevent the deterioration of good status. In the second RBMP, the overall proportion of groundwater bodies not at risk of achieving good quality status was slightly lower at 69% than those in good chemical status (74%), although there was significant variation at country level, from no water bodies being at risk to 99% being at risk.
[To review: Lowest groundwater quality is focused in central and western Europe where there [is intensive agricultural production, and in some cases, where there was heavy industry (Figure/map 4.2.]
Figure 4.2 Map of river basin groundwater chemical status – currently 2012 map: will be updated
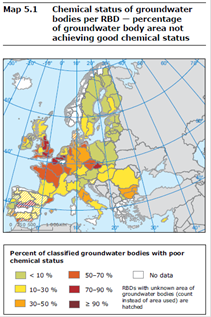
An updated map has not been included – EEA is exploring different option on presenting the information on interactive map services. The map service should present chemical status per RBD for either the first or second RBMP with different filters and with pop-up windows with the results for the specific RBD. The RBD and subunit results are available by the below links in WISE.
|
Further and detailed information on groundwater chemical status results is available at in WISE · Groundwater chemical status Table (EU & MS by geological formation) Table2; Graph*, Graph2 (MS comparison); MemberStates · Comparison of groundwater chemical status Graph; GraphMS; MemberStates · Groundwater at risk failing chemical status Groundwater area at risk* · Groundwater area, expected good chemical status Table |
* draft dashboards;
You cannot post comments to this consultation because you are not authenticated. Please log in.
Previous comments
Sentence: "In the second RBMP, the overall proportion of groundwater bodies not at risk of achieving good quality status was slightly lower at 69% than those in good chemical..."
Please check the content: Do you mean "the overall proportion of groundwater bodies not at risk of achieving good quality status was slightly lower at 69%.. "
or
Do you mean "the overall proportion of groundwater bodies at risk of not achieving good quality status was slightly lower at 69%..
? - We are not sure here.
BE-FLA (WV): p. 44 - 45 … the overall proportion of groundwater bodies not at risk of achieving good quality status was slightly lower at 69% than those in good chemical status (74%), although there was significant variation at country level, from no water bodies being at risk to 99% being at risk.
% mentioned is “by area”, important to note that.
(AT) 1st para: 'Member States should identify whether ... is at risk of not meeting the good status objectives at the end of the plan period. The aim of the risk assessment is to assess the effort needed to meet good chemical status and prevent the deterioration of good status. In the second RBMP, the overall proportion of groundwater bodies body area not at risk ...'.
SK: Page 44, Last paragraph: We propose to support the statements in the last sentence (74%, 99%) by providing a figure, similar to figure 4.1.
BE-WAL (NFP): Figure 4.2
Could you kindly give us more information on the data that will be used for updating this map? As the current map doesn't show any information for the Walloon data, could you confirm that you will use last available data (from 2013 or even more recent data)?
The tool for data visualisation is very efficient and allows different kinds of requests.
However it is very difficult to understand data visualisation on « Groundwater bodies: Pollutants », especially « Upward trend » variable. Maybe a some guidance/explanation for the reader would be useful (or a tool with less input parameters)
For exemple, addition of trends of Nitrates by country do not give 100 % ( Trend reversal « YES » + Trend reversal « No » + Trend reversal « Unknown »)
https://tableau.discomap.eea.europa.eu/t/Wateronline/views/WISE_SOW_gwPollutant/GWB_gwPollutant_Europe_G?:embed=y&:showAppBanner=false&:showShareOptions=true&:display_count=no&:showVizHome=no