
Table of contents
- Guidance to the reader
- General comments
- Executive summary
- 1. EEA State of Water assessment and EU water policy context
- 2. Ecological status and pressures
- 3. Chemical status and pressures in surface waters
- 4. Groundwater chemical status and pressures
- 5. Groundwater quantitative status and pressures
- 6. Overall status, progress achieved and future challenges
4. Groundwater chemical status and pressures
Key messages
- 74 % of the area of EU groundwater bodies is in good chemical status.
-
BE-FLA (WV): p. 43 (box)
74 % of EU groundwater bodies (by area) are in good chemical status
-
(AT) We agree that the groundwater bodies are only presented and compared by area and not by numbers.
-
74% or 70% ? see page 56
- Agriculture is the main pressure causing failure of chemical status of groundwater, through pollution by nitrates and pesticides. Nitrates affect over 18 % of the area of groundwater bodies.
-
SK: We suggest to elaborate on the overall improvement/deterioration of other pollutants from non-agricultural sources such as As.
- In total 160 pollutants caused failure to achieve good status. Most pollutants were reported in few Member States, and only fifteen pollutants were reported by five or more Member States.
- There is only limited improvement in groundwater chemical status between the first and second River Basin Management Plans as a result of sustained pressure from agriculture and lag time in recovery.
-
The basis for this conclusion should be elaborated.
4.1 Introduction
Groundwater provides a major source of drinking water for many EU citizens and provides the steady, base flow of rivers and wetlands. Maintaining this flow and keeping it free from pollution is vital for both humans and surface water ecosystems.
Pressures on groundwater chemical quality may arise mainly from diffuse pollution of nitrates and pesticides. Diffuse pollution, caused by nitrates applied to land in fertiliser or in manure and by pesticides, presents a significant and widespread challenge. Nitrogen pollution can also occur in areas where there is no sewerage system. Contaminated industrial sites, waste sites and old mines can lead to contamination by organic pollutants and metals such as arsenic, lead and copper. Pollutants may also be of natural origin, for example, when the bedrock contains high concentrations of metals and salts such as sulphates and fluorides. In coastal areas, saltwater may intrude into the groundwater aquifer where freshwater is abstracted e.g. for drinking water supply.
Once pollutants are in the groundwater, recovery can take years or even many decades, owing to residence times and slow degradation of pollutants. The time of recovery will depend on many factors such as the nature of the hydrogeological setting, the rate of groundwater recharge and the properties of the pollutant.
The Water Framework Directive requires Member States to designate separate groundwater bodies and ensure that each one achieves “good chemical status”. The volume of the water bodies is addressed by groundwater quantitative status (chapter 5).
Good groundwater chemical status is achieved when the concentrations of pollutants:
- show no signs of saline intrusion in the groundwater body,
- do not exceed the applicable quality standards,
- do not result in failure of ecological or chemical status of associated surface waters nor any significant damage to terrestrial ecosystems which depend directly on the groundwater body, andTo be good quality groundwater, hazardous substances should be prevented from entry into groundwater and the entry into groundwater of all other pollutants – such as nitrate - should be limited. Additionally, Member States must prevent deterioration of status, reverse any significant and sustained upward trends in pollutant concentrations in groundwater, and, as with priority substances in surface water, progressively reduce pollution.
Chemical status in groundwater is assessed as good or failing to achieve good chemical status, according to compliance with EU standards of nitrates (50 mg/l[1]) and pesticides (0.1 µg/l individual; max 0.5 µg/l total), and with “threshold values” for other groundwater pollutants established by Member States. These threshold values can be set at groundwater body, national, river basin or international river basin level, with criteria[2] broadly requiring that:
- Concentrations do not present significant environmental risk
- Provisions do not apply to high concentrations of naturally-occurring substances
- Should consider impact on, and interrelationship with, associated surface waters and directly dependent terrestrial ecosystems and wetlands;
- Shall take into account human toxicology and ecotoxicology knowledge.
-
"The volume of the water bodies is addressed by groundwater quantitative status (chapter 5)." please delete this sentence.
-
In reference to the sentence starting with "Contaminated industrial sites, waste sites and old mines": In the European Union, a vast majority of aggregates extraction sites are dealing with inert materials such as sand, gravel and crushed rock, and produce inert wastes according to EU definitions and criteria included in EU Directives. The industry’s production process and treatment plants do not include the use of chemicals, as in most of the cases the processes are based on mechanical crushing, milling, grinding, and size grading. The Aggregates Industry does not represent a threat for water quality. It is necessary to make a clear distinction between the concept of mining and quarrying, as the nature of their activities and the properties of the materials they extract are very different. It is very important to avoid that a mention to very rare and specific problem is extended to most of the sites that are managing inert materials. It is therefore essential to define clearly in the report what is meant by mining. As mining sites counting for less than 5% in comparison with quarries, sand and gravel extraction sites representing 95%, it would be recommended to clearly define which measures apply to mining and which ones to the Aggregates Industry rather than addressing the entire extractive industry.
-
BE-FLA (RV): p.53 §6 do not result in failure of ecological or chemical status of associated surface waters nor any significant damage to terrestrial ecosystems which depend directly on the groundwater body, and
do not result in failure of ecological or chemical status of associated surface waters nor any significant damage to terrestrial ecosystems which depend directly on the groundwater body., and
-
(AT) 2nd paragraph, ....'Pollutants may also be of natural origin, for example, when...'
In case elevated concentrations occur natural, it is not a pollutant according to definitions in Art. 2 WFD 31 and 33. Please use the term ’substances’.
-
(AT) Enumeration starting with 'Groundwater chemical status is achieved when...'
The obligation that the requirements of WFD Article 7(3) for Drinking Water Protected Areas be met is missing (= the DWPA test). Note that this requirement is included in Figure 4.7, but is missing here.
-
(AT): Paragraph: To be good quality groundwater, hazardous substances should be prevented from ...., progressively reduce pollution
To be of good status, appropriate measures have to be implemented. The 1st sentence is not a good status provision. It is a general provision to prevent or limit inputs - not only focused at the GW-body but at all groundwater.
Please use for chemical status the definition and criteria from GWD and do not mix with prevent or limit.
-
(AT): Last para starting with: 'Chemical status in groundwater is assessed as good or failing ...“threshold values” for other groundwater pollutants established...'
More stringent TVs can be set for Nitrate and Pesticides as well.
-
SK: Page 43, Chapter 4.1, 4th paragraph: The last sentence “The volume of the water bodies is ...“ is not exactly in line with the definition of quantitative status in WFD Art. 2(26). Although simplification may be needed to appeal to general public, it needs to stay true.
-
SK: Comments to online WISE SoW Tables:
Table: Groundwater bodies: delineation of the management units in the 1st and 2nd RBMP - Table is correct, but misleading. We suggest increasing number of decimal points in % area cells. In the case of Slovakia, one additional geothermal body has been delineated as correctly stated. But overall the area of delineated GWB changed by nearly 0,1%. Currently it shows 0.
-
SK: Comments to online WISE SoW Figures:
Figures "Groundwater bodies: Evolution type, by country" and "Groundwater bodies: Evolution type, by geological formation and country" show similar data to "Evolution type, by geological formation", however with different results for 1st RMBP for Slovakia.
Four figures for "Groundwater bodies: Pollutants": Not clear what the figure is supposed to display, please provide a more detailed legend. As for upward trend figure, in SK case, there is no 70% upward trend detection for Cl and so on.
-
If possible, insert a graph or map displaying the number of "treshold values for other groundwater pollutants established by Memer States" at national level by country
4.2 Groundwater chemical status
Status in second river basin management plans
Reporting by Member States for the second RBMPs shows that 74 % of EU groundwater bodies (by area) are in good chemical status and 25 % fail to reach good chemical status, with 1 % where status is unknown (Figure 4.1).
Figure 4.1 Groundwater chemical status of groundwater bodies reported in first and second RBMPs
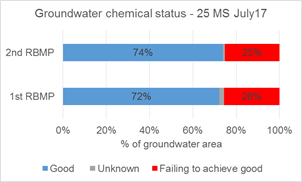
Note: Proportion of groundwater area in good and failing to achieve good chemical status. Total groundwater area (EU25) is 4.3 million km2.
Source: Preliminary results based on WISE-SoW database including data from 25 Member States (EU28 except Greece, Ireland and Lithuania).
|
Further and detailed information on improvements in groundwater chemical status assessment is in WISE · Monitoring of groundwater chemical status – number of monitoring sites (missing) · Change in proportion unknowns: unknown chemical status · Confidence in GW chemical status assessment Table and Graph* |
* draft dashboards;
-
"Reporting by Member States for the second RBMPs shows that 74 % of EU groundwater bodies (by area) are in good chemical status and 25 % fail to reach good chemical status, with 1 % where status is unknown (Figure 4.1)."
Please replace "reach" by "achieve".
-
Please change the titel of figure 4.1:
delete "groundwater bodies" and replace by "groundwater by area".
-
"Note: Proportion of groundwater area in good and failing to achieve good chemical status. Total groundwater area (EU25) is 4.3 million km2. "
Please add "status" between "good and"
-
In the legend of figure 4.1 ”failing to achieve good” should be replaced by ”poor” and the colour code for good status is green and not blue.
-
The figures in this section needs quality assurance in line with comment by DK to key messages.
-
(AT) Groundwater ≠ Groundwater body. Please do not use 'groundwater area' but 'groundwater body area'.
WFD and GWD tackle groundwater bodies only, except for the prevent or limit provision in the GWD which covers all groundwater. Groundwater bodies are parts of the whole groundwater.
-
Please explain, e,g, in a footnote, how the confidence level is estimated/reported https://public.tableau.com/profile/peterk.eea#!/vizhome/GW_status/GWchemStatconfgraph
Member States should identify whether the chemical status of a groundwater body is at risk. The aim of the risk assessment is to assess the effort needed to meet good chemical status and prevent the deterioration of good status. In the second RBMP, the overall proportion of groundwater bodies not at risk of achieving good quality status was slightly lower at 69% than those in good chemical status (74%), although there was significant variation at country level, from no water bodies being at risk to 99% being at risk.
[To review: Lowest groundwater quality is focused in central and western Europe where there [is intensive agricultural production, and in some cases, where there was heavy industry (Figure/map 4.2.]
Figure 4.2 Map of river basin groundwater chemical status – currently 2012 map: will be updated
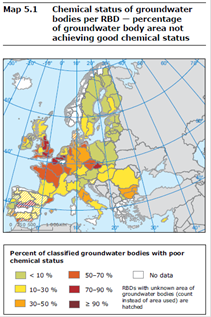
An updated map has not been included – EEA is exploring different option on presenting the information on interactive map services. The map service should present chemical status per RBD for either the first or second RBMP with different filters and with pop-up windows with the results for the specific RBD. The RBD and subunit results are available by the below links in WISE.
|
Further and detailed information on groundwater chemical status results is available at in WISE · Groundwater chemical status Table (EU & MS by geological formation) Table2; Graph*, Graph2 (MS comparison); MemberStates · Comparison of groundwater chemical status Graph; GraphMS; MemberStates · Groundwater at risk failing chemical status Groundwater area at risk* · Groundwater area, expected good chemical status Table |
* draft dashboards;
-
Sentence: "In the second RBMP, the overall proportion of groundwater bodies not at risk of achieving good quality status was slightly lower at 69% than those in good chemical..."
Please check the content: Do you mean "the overall proportion of groundwater bodies not at risk of achieving good quality status was slightly lower at 69%.. "
or
Do you mean "the overall proportion of groundwater bodies at risk of not achieving good quality status was slightly lower at 69%..
? - We are not sure here.
-
BE-FLA (WV): p. 44 - 45 … the overall proportion of groundwater bodies not at risk of achieving good quality status was slightly lower at 69% than those in good chemical status (74%), although there was significant variation at country level, from no water bodies being at risk to 99% being at risk.
% mentioned is “by area”, important to note that.
-
(AT) 1st para: 'Member States should identify whether ... is at risk of not meeting the good status objectives at the end of the plan period. The aim of the risk assessment is to assess the effort needed to meet good chemical status and prevent the deterioration of good status. In the second RBMP, the overall proportion of groundwater bodies body area not at risk ...'.
-
SK: Page 44, Last paragraph: We propose to support the statements in the last sentence (74%, 99%) by providing a figure, similar to figure 4.1.
-
BE-WAL (NFP): Figure 4.2
Could you kindly give us more information on the data that will be used for updating this map? As the current map doesn't show any information for the Walloon data, could you confirm that you will use last available data (from 2013 or even more recent data)?
-
The tool for data visualisation is very efficient and allows different kinds of requests.
However it is very difficult to understand data visualisation on « Groundwater bodies: Pollutants », especially « Upward trend » variable. Maybe a some guidance/explanation for the reader would be useful (or a tool with less input parameters)
For exemple, addition of trends of Nitrates by country do not give 100 % ( Trend reversal « YES » + Trend reversal « No » + Trend reversal « Unknown »)
https://tableau.discomap.eea.europa.eu/t/Wateronline/views/WISE_SOW_gwPollutant/GWB_gwPollutant_Europe_G?:embed=y&:showAppBanner=false&:showShareOptions=true&:display_count=no&:showVizHome=no
Intercomparability of groundwater chemical assessment
The range in good groundwater chemical status is from [38%] to 100%. As with RBSPs (chapter 2.3), Member States identify substances which pollute groundwater bodies and set “threshold values” at national level as a benchmark for good chemical status. This can lead to a range of approaches, for example, some Member States have considered threshold values for over 90 pollutants, while others have assessed status using fewer than 10. The monitoring of more substances could lead to a greater chance of failing to achieve good chemical status. In addition, the range of concentrations for which threshold values are set can vary quite widely and there are differences in methodologies for establishing threshold values and natural background levels. These factors together mean that caution should be applied when comparing groundwater chemical status between countries.
-
Please delete the quotation marks "" (..."threshold values")
-
Please change "These factors together" in "Together, these factors"
-
BE-FLA (RV): p. 45, last § The monitoring of more substances could lead to a greater chance of failing to achieve good chemical status.
This remark also applies to SWBs.
-
BE-FLA (WV): p. 45, last § These factors together mean that caution should be applied when comparing groundwater chemical status between countries.
These issues can partly be tackled by making substance-specific graphs and comparing for ex. The 15 pollutants that’s are mentioned by more than 5 MS
-
(AT)
Perhaps include a reference to previous analytical work on this topic conducted under CIS WG Groundwater
Member States identify substances which pollute cause risk that groundwater bodies are failing good status and set “threshold values” at national level various levels (Member State, RBD, groundwater body) as a benchmark for good chemical status.
not 'pollute' but causing risk of failing good status.
In addition, the range of concentrations for which threshold values are set can vary quite widely and there are differences in methodologies for establishing threshold values and natural background levels .
Variation of TVs also due to variability in receptors which need to be protected and for which TVs are derived. Furthermore the methodologies of calculating average values, which are then compared against the standards/threshold values, are different from MS to MS.
Change in status between first and second RBMPs
There has been little change in the chemical status of groundwater bodies since the first RBMPs, with an increase in good chemical status of 2% at EU level (Figure 4.1). This perhaps reflects the long timescales which may be involved in observing changes in groundwater quality after measures have been introduced to reduce pressures, or that effective measures have yet to be taken. There may also have been changes in the selection of relevant pollutants and changes in the threshold values, affecting direct comparison between the two RBMPs.
-
Considering the uncertainties (some bodies are compared while others are not), the differences in methodologies between Member States and in the two RBMPs, it is recommended to be cautious and hesitate to make comparisons at all. Instead the EEA should describe the first planning cycle and the second planning cycle separately - and only then describe progress and valuable information about the assessment of the Member States' RBMPs.
-
(AT)
No information on confidence in chemical status assessment included. Note that such information is included in chapter 5.2 on quantitative status assessment.
Similarly, no information included on an outlook of when good status will be achieved for what percentage of groundwater body area. Such information is included in chapter 5.3 on quantitative status.
4.3 Reasons for failure to achieve good chemical status
Failure to achieve good chemical status was most frequently attributed to “general water quality”. This reason considers significant impairment of human uses and significant environmental risk from pollutants across the groundwater body, but it does not include assessment of more stringent objectives, such as those for drinking water or dependent terrestrial ecosystems.
The second most frequent reason was failure owing to requirements for Drinking Water Protected Areas; other reasons were less significant (Figure 4.3).
Figure 4.7 4.3. Reason for failure of good chemical status by area (number of countries in brackets

Source: Preliminary results based on WISE-SoW database including data from 25 Member States (EU28 except Greece, Ireland and Lithuania). Latvia reported all groundwater bodies in good chemical status.
|
Further and detailed information on groundwater reason for failing chemical status is available in WISE · Groundwater bodies: reasons for failure to achieve good chemical status Table - TableEU |
-
Parts of the text in figure 4.7 are unreadable.
-
BE-FLA (RV): p. 46, fig 4.7
1) Check figure number!
2) Not all reasons can be mentioned in the same way. Reasons 1, 2 and 5 are primary impacts (impacts of substances on GWBs); reasons 3 and 4 are secondary impacts (impacts of GWBs on the terrestrial ecosystem)!
-
(AT) Continue 2nd sentence with '...and associated surface waters'
Pollutants causing failure to achieve good status
In total, 160 chemicals were reported as causing poor chemical status. Some of these (iron, potassium, bicarbonate, calcium, magnesium, sodium and hardness) may be considered by some countries to characterise the natural background conditions of the aquifer and so in those places are not necessarily classified as anthropogenic pollutants. Electrical conductivity may be attributed to saline intrusions, where freshwater abstraction draws in saltwater, as only Member States with coastal areas reported this as a reason for failure.
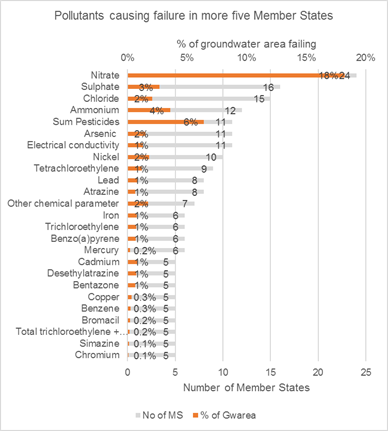
The main pollutant causing failure to achieve good chemical status is nitrate. “Pesticides” are also reported as causing a large number of failures of good chemical status. Nitrate is the predominant groundwater pollutant throughout the EU (reported by 24 Member States causing failure in 18 % of groundwater area) (figure 4.3). Pesticides cause failure in 6.5 % of the groundwater bodies (by area).
Figure 4.3 Substances causing failure to achieve good chemical status in at least five Member States.
<needs to be updated with corrected EEA_00-00-0 other parameter & to change ”Sum pesticides” to ”Pesticides”>
Note: Pollutants causing failure in at least five Member States, shown by % of total GWB area
Source: Preliminary results based on WISE-SoW database including data from 25 Member States (EU28 except Greece, Ireland and Lithuania).
The list of substances most frequently leading to groundwater bodies not achieving good chemical status is dominated by substances used in agriculture (e.g. nitrate) and arising from salt intrusion (e.g. chloride). In addition, some industrial chemicals e.g. tetrachloroethylene, and metals arising from e.g. mining, contaminated sites and waste water, such as arsenic, nickel and lead, are causes of failure to achieve good chemical status.
|
Further and detailed information on groundwater pollutants including threshold values is available in WISE · Number and name of groundwater pollutants per Member State Table - TableEU - Graph |
-
"Some of these (iron, potassium, bicarbonate, calcium, magnesium, sodium and hardness) may be considered by some countries to characterise the natural background conditions of the aquifer and so in those places are not necessarily classified as anthropogenic pollutants."
If thats the case, Art. 4.4 a(iii) of the WFD matches! "natural conditions do not allow timely improvement in the status of the body of water".
-
The report should include information about the bias that nitrates and pesticides are the substances which have to be monitored and assessed in all Member States.
-
In reference to the sentence starting with "Contaminated industrial sites, waste sites and old mines": In the European Union, a vast majority of aggregates extraction sites are dealing with inert materials such as sand, gravel and crushed rock, and produce inert wastes according to EU definitions and criteria included in EU Directives. The industry’s production process and treatment plants do not include the use of chemicals, as in most of the cases the processes are based on mechanical crushing, milling, grinding, and size grading. The Aggregates Industry does not represent a threat for water quality. It is necessary to make a clear distinction between the concept of mining and quarrying, as the nature of their activities and the properties of the materials they extract are very different. Arsenic, nickel, lead and copper are present in very few sites in Europe, it is therefore important to avoid that a mention to very rare and specific problem is extended to most of the sites that are managing inert materials. It is therefore essential to define clearly in the report what is meant by mining. As mining sites counting for less than 5% in comparison with quarries, sand and gravel extraction sites representing 95%, it would be recommended to clearly define which measures apply to mining and which ones to the Aggregates Industry rather than addressing the entire extractive industry.
-
BE-FLA (WV): p. 47. Fig. 4.3 “other chemical parameter”
This is a non-defined pollutant, so what is the relevance?
-
SK: Page 47, Figure 4.3: Adjust title and legend for “Gwarea” to be more understandable in the chart.
-
SK: Page 47, 1st paragraph: There is a chloride mentioned as an example in the first sentence. Is Cl also problematic in landlocked countries? If so, please explain the sources.
-
Could you precise what does GWB Area (km2) means (in text or tables) or make reference to 1.2 - Surface water and groundwater, if total GWB area is considered . In graph, % of groundwater area failing is making reference to the total area of at least five MS or to the mean of proportions of national GWB area of MS (maybe more relevant indicator)?
-
Tertrachlorethylene seems to be frequently used also as a solvent, including for households, and for dry cleaning
Significant upward trend and trend reversal of pollutants
The Groundwater Directive requires that significant and sustained upward trends of pollutants should be identified and reversed. A significant trend is one that could lead to a groundwater body failing to meet its environmental objectives before 2021, if measures are not put in place to reverse it. Only a few countries reported any upward trend for the first RBMP, so comparison is difficult.
The total groundwater area with identified upward trend (9.9 % of groundwater area) is nearly double the area with a trend reversal (5.9 % of groundwater area).
Significant and sustained upward trends were identified for 58 pollutants, mainly for nitrate, which were detected in 19 Member States (Figure 4.4). Other substances with upward trends are similar to those in Figure 4.3.
In contrast, trend reversals were reported for 65 pollutants by 14 Member States (Figure 4.5), mainly for nitrates, sulphates, ammonium and chlorides.
Figure 4.4. Pollutants with an upward trend by area of groundwater bodies
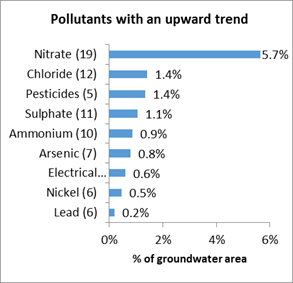
Figure 4.5. Pollutants with a trend reversal by area of groundwater bodies
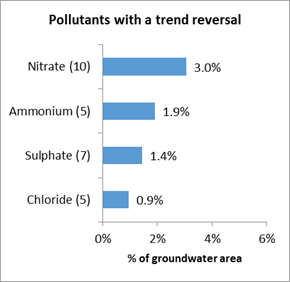
Note Over 10 GWBs and over four countries shown - Number of countries in brackets
Source: Preliminary results based on WISE-SoW database including data from 25 Member States (EU28 except Greece, Ireland and Lithuania).
As groundwater chemical data for second cycle RBMPs were mainly collected during 2010 – 2012 and the effect of measures is likely to take time, increased trend reversal of existing pollutants may be expected in future years.
|
Further and detailed information on groundwater pollutants with upward trend or trend reversal is available in WISE · Groundwater pollutants trend reversal · Groundwater pollutants upward trend |
-
Part of the text in figure 4.4 is unreadable.
-
"Note Over 10 GWBs and over four countries shown - Number of countries in brackets" should be deleted.
-
(AT) 1st para:
The Groundwater Directive requires that significant and sustained upward trends of pollutants should be identified and reversed. A significant upward trend is one that could lead to a groundwater body failing to meet its environmental objectives before the end of this plan period in 2021, if measures are not put in place to reverse it. Only a few countries reported any upward trend for the first RBMP mainly due to the lack of suffiently long time series, so comparison is difficult
Groundwater Directive: Not the GWB buit the WFD requires that in Art 4.1.b.iii
-
SK: Page 48, 1st paragraph: In the last sentence, there is mentioned that only a few countries reported any upward trend for the first RBMP, so comparison is difficult. If it is possible, please, explain the reason behind it.
-
SK: Page 48, 4th paragraph: Can you shed some light why there are more pollutants with trend reversal than there are pollutants with upward trends? Particularly in reference to the lack of trend analyses for the 1st RBMP.
-
"Significant and sustained upward trends were identified for 58 pollutants, mainly for nitrate, which were detected in 19 Member States (Figure 4.4). Other substances with upward trends are similar to those in Figure 4.3.
In contrast, trend reversals were reported for 65 pollutants by 14 Member States (Figure 4.5), mainly for nitrates, sulphates, ammonium and chlorides."
Error bars here would be most helpful, are these changes significant at any level? It is difficult to interpret these figures without the appropriate context in regard to how important the changes reported might be, beyond qualitative indications.
-
The tool for data visualisation is very efficient and very pleasant.
However it's very difficult to understand data visualisation on « Groundwater bodies: Pollutants », especially « Upward trend » variable. For exemple, addition of trends of Nitrates by country don’t give 100 % ( Trend reversal « YES » + Trend reversal « No » + Trend reversal « Unknown »)Maybe a guidance would be useful, or a tool with less input parameters, or verification
4.4 Pressures on groundwater chemical status
Most countries report diffuse sources of pollution as being a pressure for groundwater (24 out of 25 Member States), while 20 reported point sources as a pressure. Diffuse sources affect 22 % of the groundwater bodies by area (Figure 4.7). Diffuse pollution from agriculture is the major pressure causing failure of good chemical status affecting 20 % of groundwater bodies (by area). Other pressures are of less significance (Fig. 4.7).
Fig 4.7 Main pressures identified in relation to groundwater chemical status
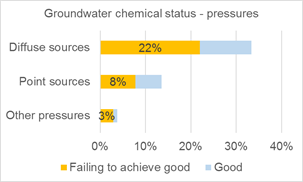
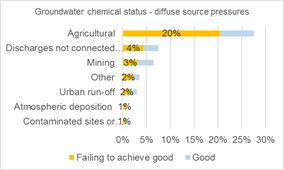
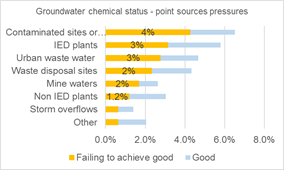
Note: Proportion of groundwater area affected by the main pressure groups and by detailed pressures for diffuse sources and point source pressures. Some Member States have reported groundwater bodies in good chemical status with diffuse or point source pressures, the proportion of these are indicated by light blue in the diagrams. Remark differences in the scale of the X-axis.
Source: Preliminary results based on WISE-SoW database including data from 25 Member States (EU28 except Greece, Ireland and Lithuania). Latvia reported all groundwater bodies in good chemical status.
The main impacts were chemical (22 % of groundwater bodies by area) and nutrient pollution (19 %).
|
Further and detailed information on pressures and impacts in relation to chemical status is available in WISE · Groundwater chemical status, main pressure groups table · Groundwater chemical status, detailed pressures point pollution sources, diffuse pollution sources, · Groundwater chemical status, significant impacts - table |
[1] Note, some Member States set more stringent nitrate standards (below 50 mg/l).
[2] Specific criteria are set out in Annex II of the Groundwater Directive REF
-
Parts of the text in figure 4.7 are missing and ”failing to achieve good” should be replaced by ”poor”. The colour code for good status is green and for poor status red.
-
The language of the section should be improved as it is difficult to understand. The last sentence "The main impacts were chemical (22 % of groundwater bodies by area) and nutrient pollution (19%) should be integrated with the section above.
-
The language of the section should be improved as it is difficult to understand. The last sentence "The main impacts were chemical (22 % of groundwater bodies by area) and nutrient pollution (19%) should be integrated with the section above.
-
BE-FLA (RV): p. 49 §1 Most countries report diffuse sources of pollution as being a pressure for groundwater (24 out of 25 Member States), while 20 reported point sources as a pressure.
Sounds as there is only one choice. Proposal:
- 20 countries reported both point and diffuse source pressures
- 4 countries reported only diffuse source pressures
# countries reported only point source pressures
-
BE-FLA (RV): p. 49, fig 4.7
Compare Atmospheric deposition on GWBs 1% with impact Atmospheric deposition on SWBs 38% (p. 32) and with precipitation 11% (p. 50)
-
BE-FLA (WV): p. 49 §1 Other pressures are of less significance
“of less significance” in terms of the total area of GWB or is some other reference used?
-
(AT) Note: Proportion of groundwater body area...
-
Environment Ageny: In checking the values reported for Diffuse and Point pressures there seems to be some disparity between the figures in the table and the figures reported in the RBMPs. Can there be some clarity please on the categories?. Also, when looking at the totals displayed at the bottom of the list of pressures I don't get the same total as displayed. This could be from my mis-interpretation of the calculation.
-
SK: Page 44, Footnote 25: REF (reference) is missing.
The report does not present data for each individual member state. The EEA has chosen to calculate the results for groundwater in relation to the the area of groundwater bodies. The Danish Environment Protection Agency finds that such an approach leads to significant methodological problems. 1) it is unclear whether the EEA applies projection areas. 2) It is unclear if one body is considered to be in good status, then the entire area is in good status or if it has been estimated if parts of the area is not included because they do not fulfil the requirements. The different methodologies can affect the result at EU level. For Member States such as Denmark and France, areas of groundwater bodies can exceed the total area of the Member State.