
Post a comment on the text below
There are several possible explanations for the limited improvements in overall status from the first to the second RBMPs.
- First, additional biological and chemical monitoring was put in place after 2009 and the classification methods were improved, and in some cases, stricter standards or standards in another matrix than water (biota) were introduced.
- Second, for some water bodies some quality elements have improved in status, but there has been no improvement in the overall status.
- Third, the second RBMPs generally show status classification up to 2012/13 and at that time, many measures were only in the process of being implemented and there may be a lag time before the pressures are reduced and there are improvements in status.
- Finally, some pressures may have been unknown in 2009; and the measures implemented may not have been sufficient and as effective as expected at reducing all the pressures.
Figure 6.1 Comparison of status (ecological, chemical and quantitative status) in the first and second RBMPs.
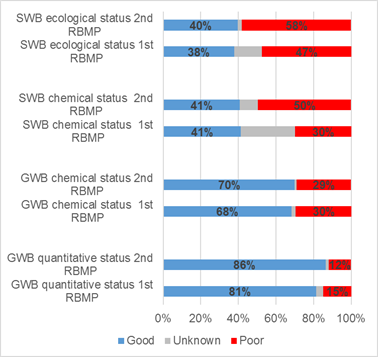
Source: Preliminary results based on WISE-SOW database – 25 Member States 2017.
Notes: Ecological status: Good = High and good ecological status/potential and Failing to achieve good is moderate, poor and bad status. Only water bodies that are comparable between the two cycles of RBMPs (WISE evolution type nochange, change, changecode) are compared. Status for surface water bodies is based on count of water bodies (92 346 water bodies), while status of groundwater bodies is by the area of groundwater bodies (3.04 million km2).
You cannot post comments to this consultation because you are not authenticated. Please log in.
Previous comments
"There are several possible explanations for the limited improvements in overall status from the first to the second RBMPs." please delete the word "overall".
In the notes, "Failing to achieve good" should be replaced by "Poor" as the word "Poor" is used in the legend of figure 6.1.
BE-FLA (WV): p.56 Figure 6.1. % GWB chem. Status and quant. status
% p.44 figure 4.1. and p.51 figure 5.1.does not correspond with % given in figure 6.1. for GWB status; maybe this is due to the area of GWB that is not the same 4.3mil. km² vs. 3.04 mil. km²?
"...at reducing all the pressures."
If you don't know the pressure, the setting of measures is obviously not successful. Even more - not only that an unknown goal cannot be reached, all the efforts incl. financing are lost. -> learning for the future: no measures must be fixed unless the pressures are defined and most efficient measures are developed.
SK: Notes below the Figure 6.1: Notes below the Figure 6.1 should be corrected: Good status in the legend presents Good + High ecological status/potential and Poor status in the legend presents moderate+ poor+ bad status. That´s mean that explanation of “Failing to achieve good” in the notes, should be harmonised with overall “Poor” used in legend in the graph.
(AT) Figure 6.1:
Please add: share or proportion of number of water bodies – to avoid confusion with other charts where length or area of water bodies is presented.
The figures for GW do not fit to the figures in the tables.