
Post a comment on the text below
Diffuse source pollution
In Europe, diffuse source pollution is mostly due to excessive emissions of nutrients (nitrogen and phosphorus) and chemicals such as pesticides. In the second RBMPs, Member States identified that diffuse pollution affects 37 % of surface water bodies[8] and 34 % of the area of groundwater bodies. Agricultural production is a major source of diffuse pollution affecting 68 % of water bodies affected by diffuse pollution pressures[9]. Further drivers include rural dwellings (emissions from households not connected to sewage systems), run-off from urban areas and forested land. Nutrient enrichment causes eutrophication, which in turn leads the loss of aquatic biodiversity and reduction of fish stocks. Excessive nutrient enrichment can be dangerous for human health, e.g. due to toxic algal blooms, and impair the use of drinking water and bathing.
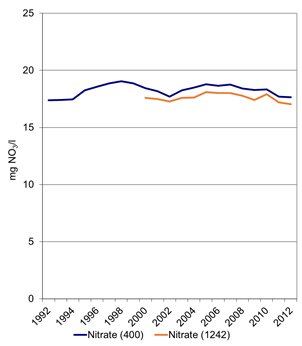
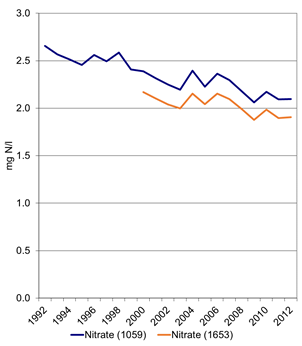
The average nitrate concentration declined by 20 % in European rivers between 1992 and 2012, while already in 2011 groundwater nitrate concentrations almost returned to the levels in 1992 (Figure 6.6). The decline in nitrate concentration reflects the effects of measures to reduce agricultural emissions of nitrate, as well as improvements in wastewater treatment. Decreasing trends are more visible in rivers as they react fairly quickly to changes in nutrient surplus; in contrast, the comparatively long residence time of groundwater may cause delays in recovery in the order of years to decades between the application of nutrient control measures and measurable improvements in water quality.
Figure 6.6: Trend in water quality – nitrate in rivers and groundwater
|
Note: The diagram depicts two-time series: the longer time series has fewer stations (400) and the shorter time series has more (1242). Source: Link |
Note: The diagram depicts two-time series: the longer time series has fewer stations (1059) and the shorter time series has more (1653). Source: Link |
You cannot post comments to this consultation because you are not authenticated. Please log in.
Previous comments
Please, check the links under the diagramms of figure 6.6.
The links have now been corrected.
Figure 6.6:
1. The same comment as for figure 6.5.
2. Please check the titel and the diagrams.
It is not visible which of the two diagrams shows nitrate for rivers and nitrate for groundwater. In the right diagram the y - axis is named with " mg N /l" but in the titel "nitrate" is mentioned.
In the left diagram we do not see a clear decreasing trend as described at page 61. Please change the sentence at pages 61 and clarify the content.
Please also check or discuss with your colleagues whether the diagram for groundwater is really needed or not. If not please delete this diagram.
BE-FLA (RV): p. 61 In Europe, diffuse source pollution is mostly due to excessive emissions of nutrients (nitrogen and phosphorus) and chemicals such as pesticides. In the second RBMPs, Member States identified that diffuse pollution affects 37 % of surface water bodies34 and 34 % of the area of groundwater bodies. Agricultural production is a major source of diffuse pollution affecting 68 % of water bodies affected by diffuse pollution pressures.
p. 31: 38%
p. 32: 38%
p. 49: 22%
BE-WAL (EC): p. 62 figure 6.6
Why don't you choose the same unit for the 2 graphs?
SK: Figure 6.6: Does the each graph under Figure 6.6 present nitrates and nitrogen together for rivers and groundwater?
We propose:
(AT): 2nd para, 1st sentence: The average nitrate concentration declined by 20 % in European rivers between 1992 and 2012, while already in 2011 groundwater nitrate concentrations almost returned to the levels in 1992 (Figure 6.6).
Are the data representative for EEA area? Is this assessment in line with observations according to the Nitrate-Directive?
(AT) Figure 6.6
The different presentation of Nitrate in GW as NO3 and in rivers as N in the two charts (close to each other) gives a misleading impression – for rivers at least NO3 should be added.
Please indicate which graph presents rivers and which groundwater.
SK: Figure 6.6: Source links do not work in the word and pdf file.
SE: Figure 6.6 needs clarification. Explain which diagram corresponds to groundwater and rivers respectively, and the reason for showing mg NO3/l in one diagram and mg N/l in the other and how to interpret the difference.
CZ: Fig. 6.6:
It is hard to distinguish chart for groundwater and chart for surface water (no titles). Both charts should use same units.