
Table of contents
- Guidance to the reader
- General comments
- Executive summary
- 1. EEA State of Water assessment and EU water policy context
- 2. Ecological status and pressures
- 3. Chemical status and pressures in surface waters
- 4. Groundwater chemical status and pressures
- 5. Groundwater quantitative status and pressures
- 6. Overall status, progress achieved and future challenges
6. Overall status, progress achieved and future challenges
Key messages
- The second RBMPs provide a better understanding of the status and the pressures causing failure to achieve good status and the needed mitigation measures. Evidence has also improved through more and better monitoring of pollutants and quality elements.
- A higher proportion of water bodies are in good status (ecological, chemical and quantitative) in the second RBMPs than in the first RBMPs; however, there is also an increase in the proportion of surface water bodies failing to achieve good status, in part corresponding to a fall in the proportion whose status was unknown.
-
Most of the text is skewed to a positive outcome. “A higher proportion of water bodies are in good status (ecological, chemical and quantitative) in the second RBMPs than in the first RBMPs; however, there is also an increase in the proportion of surface water bodies failing to achieve good status, in part corresponding to a fall in the proportion whose status was unknown.” Why is the increase in proportion failing partly attributed to less unknown and why is this not the case for the higher proportion of good status?
- Marked efforts have been made by Member States to improve water quality and hydromorphology. Some of the measures have immediate effect; others will result in improvement in the longer run. Results are usually visible at the level of individual quality elements or pollutants but often do not translate into an overall improved status.
- The analysis of the second RBMPs shows that there is progress in the status of single quality elements and single pollutants. In particular, ecological status has improved for many biological quality elements from the first to the second RBMPs.
- Without ubiquitous priority substances, in particular, mercury, only 4 % of surface water bodies failed to achieve good chemical status and only a few priority substances are responsible for poor chemical status in most Member States. Improvements in status for individual priority substances shows that Member States are making progress in tackling sources of contamination.
-
Please check the percentage (earlier in the text it is indicated that 3% of SWBs failed to achieve good chemical status).
-
3% or 4% ?
- Diffuse sources (62 %) and hydromorphological pressures (40 %) are the main significant pressures on surface water bodies, followed by point sources (21 %) and abstraction (7 %).
-
Please check the information related to the proportion of SWB affected by main significant pressures in the 2-nd RBMPs illustrated in figures Fig. 2.8 and Fig. 6.2.
-
BE-FLA (RV): p.55 Diffuse sources (62 %) and hydromorphological pressures (40 %) are the main significant pressures on surface water bodies, followed by point sources (21 %) and abstraction (7 %).
p. 5 + p. 57: 37% - 41% - 18% - 7%
-
Please, compare to same kind of sentence in Excecutive summary page 5.
What are the main significant pressures?
- Diffuse sources (41 %) and point sources (16 %) are the main pressures related to groundwater chemical status, while pressures from water abstraction (22 %) are the main cause of poor quantitative status.
-
BE-FLA (RV): p.55 Diffuse sources (41 %) and point sources (16 %) are the main pressures related to groundwater chemical status, while pressures from water abstraction (22 %) are the main cause of poor quantitative status.
p. 49: 22% - 8%
p. 52: 16%
- By now, many of the several thousand individual measures in the first RBMPs will have been completed and in the second RBMPs more measures are planned. <more text>
-
on what will be "more text"?
-
We would agree to elaborate further on this as suggested here (with <'more text'>), as the statement as such does not provide useful information (eg is this a lot of measures, or not enough; for the planned measures, is there funding available; briefly reasons for measures not being implemented; briefly also outlining the type of measures if possible indicating if they were adequate or not).
-
Not cristal-clear. PLease explain better.
6.1. Current status and overall progress since the first RBMPs
The results in the previous chapters show that with the second RBMPs the quantity and quality of available evidence has grown significantly. Many Member States and RBDs have invested in better or new ecological and chemical monitoring programs, with more monitoring sites, more quality elements assessed and more chemicals analysed. These improvements in monitoring and assessment mean that the status classification results are now a better interpretation of the general health of the water environment.
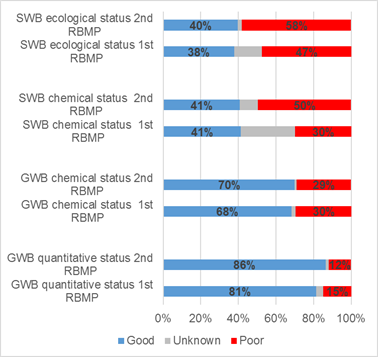
Groundwater status across Europe is generally better than surface waters (Figure 6.1). Good chemical and quantitative status was achieved for 70 % and 86 % of groundwater bodies. Around 40 % of surface water bodies have good ecological and 41 % good chemical status.
Compared to the first RBMPs, there are for all four measures of status[1] a higher proportion of water bodies in good status in the second RBMP. However, there are also for surface waters a higher proportion of water bodies in less than good status. Both the changes in proportion of good and less than good status is due to improved knowledge of the water environment (i.e. fewer water bodies have unknown status).
The analysis of the second RBMPs shows that there is progress in the status of single quality elements and single pollutants. In particular, ecological status has improved for many biological quality elements from the first to the second RBMPs.
For chemical status, a very low proportion of surface water bodies (3 %) are reported to fail to achieve good status if ubiquitous substances, especially mercury, are omitted, and in most Member States only a few priority substances (mainly heavy metals like cadmium, lead and nickel) are responsible for the poor chemical status observed. Improvement in status for several priority substances shows that Member States are making progress in tackling sources of contamination.
-
As a generall comment for chapter 6:
Please check the content of this chapter 6 and please modify contents describing the "overall status".
Explanation: As described before (in above comments) the WfD does not contain a "overall good status" per definition.
And no "overall good status" is reported to the EU-Commission. According to the WfD each water body need to be in "good ecological status / potential" and in "good chemical status" (and both are reported to the EU).
-
"The results in the previous chapters show that with the second RBMPs the quantity and quality of available evidence has grown significantly."
Please delete "evidence" and replace by "data".
-
"These improvements in monitoring and assessment mean that the status classification results are now a better interpretation of the general health of the water environment."
Please change to "These improvements in monitoring and assessment mean that the status classification results allow now a better interpretation of the general health of the water environment."
-
"Compared to the first RBMPs, there are for all four measures of status a higher proportion of water bodies in good status in the second RBMP. However, there are also for surface waters a higher proportion of water bodies in less than good status." we find these 2 sentences a bit confusing and in order to avoid any confusions it would be helpful to add an explanation how this is possible. Is it due to less surface water bodies in unknown status?
-
"(mainly heavy metals like cadmium, lead and nickel)" please add PAHs to the list.
-
BE-FLA (RV): Chapter 6 General comments
1) Significant overlap of content with the Summary chapter. Maybe this should be avoided.
2) Differences in figures compared with those mentioned in previous chapters.
-
BE-WAL (EC): p. 56 §1
We are not sure about this affirmation. The change from 38% to 40% doesn’t mean necessarily an improvement. The 2% extra could also come from unknown sources.
-
SK: Chapter 6 - In general: We propose to create links into the WISE WFD reporting statistics tables, too. Trend of EU water quality is rather low-value chart. We propose to consider presenting of water quality changes for individual significant rivers/catchments, too.
-
(AT) 2nd para, 2nd sentence: please check the figures.
Good chemical and quantitative status was achieved for 70 74 % and 86 89 % of groundwater bodies area
-
* 70%or 74 % ? 41% or 38% as written page 35, 5 and 6 ?
* Significant overlap with other intermediate summaries / global summary
There are several possible explanations for the limited improvements in overall status from the first to the second RBMPs.
- First, additional biological and chemical monitoring was put in place after 2009 and the classification methods were improved, and in some cases, stricter standards or standards in another matrix than water (biota) were introduced.
- Second, for some water bodies some quality elements have improved in status, but there has been no improvement in the overall status.
- Third, the second RBMPs generally show status classification up to 2012/13 and at that time, many measures were only in the process of being implemented and there may be a lag time before the pressures are reduced and there are improvements in status.
- Finally, some pressures may have been unknown in 2009; and the measures implemented may not have been sufficient and as effective as expected at reducing all the pressures.
Figure 6.1 Comparison of status (ecological, chemical and quantitative status) in the first and second RBMPs.
Source: Preliminary results based on WISE-SOW database – 25 Member States 2017.
Notes: Ecological status: Good = High and good ecological status/potential and Failing to achieve good is moderate, poor and bad status. Only water bodies that are comparable between the two cycles of RBMPs (WISE evolution type nochange, change, changecode) are compared. Status for surface water bodies is based on count of water bodies (92 346 water bodies), while status of groundwater bodies is by the area of groundwater bodies (3.04 million km2).
-
"There are several possible explanations for the limited improvements in overall status from the first to the second RBMPs." please delete the word "overall".
-
In the notes, "Failing to achieve good" should be replaced by "Poor" as the word "Poor" is used in the legend of figure 6.1.
-
BE-FLA (WV): p.56 Figure 6.1. % GWB chem. Status and quant. status
% p.44 figure 4.1. and p.51 figure 5.1.does not correspond with % given in figure 6.1. for GWB status; maybe this is due to the area of GWB that is not the same 4.3mil. km² vs. 3.04 mil. km²?
-
"...at reducing all the pressures."
If you don't know the pressure, the setting of measures is obviously not successful. Even more - not only that an unknown goal cannot be reached, all the efforts incl. financing are lost. -> learning for the future: no measures must be fixed unless the pressures are defined and most efficient measures are developed.
-
SK: Notes below the Figure 6.1: Notes below the Figure 6.1 should be corrected: Good status in the legend presents Good + High ecological status/potential and Poor status in the legend presents moderate+ poor+ bad status. That´s mean that explanation of “Failing to achieve good” in the notes, should be harmonised with overall “Poor” used in legend in the graph.
-
(AT) Figure 6.1:
Please add: share or proportion of number of water bodies – to avoid confusion with other charts where length or area of water bodies is presented.
The figures for GW do not fit to the figures in the tables.
Pressures and impacts causing failure to achieve good status
For surface water bodies, the main significant pressures are hydromorphological pressures (41 %), atmospheric deposition and diffuse source pollution (37 %), followed by point source pollution (18 %) and water abstraction (7 %) (Figure 6.2). Atmospheric deposition is mainly reported for water bodies failing good chemical status due to mercury.
The main impacts on surface water bodies are chemical pollution (50 %), followed by altered habitats due to morphological changes (40 %) and nutrient pollution (29 %).
Figure 6.2: Overview of the proportion of surface water bodies having A) main significant pressures and B) impacts in the second RBMPs.
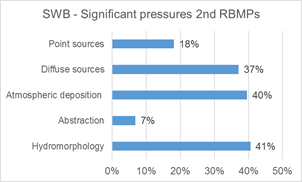
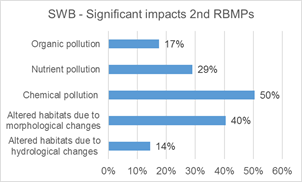
Note: Pressures from diffuse sources do not include atmospheric deposition. The diagrams show the proportion (%) of water bodies affected by each pressure and impact type for the second RBMPs, considering only water bodies which have been classified with respect to ecological status (106 329 water bodies) .
Source: Preliminary results based on WISE-SOW database – 25 Member States 2017.
-
BE-FLA (RV): p. 57 For surface water bodies, the main significant pressures are hydromorphological pressures (41 %), atmospheric deposition and diffuse source pollution (37 %), followed by point source pollution (18 %) and water abstraction (7 %) (Figure 6.2). Atmospheric deposition is mainly reported for water bodies failing good chemical status due to mercury.
1) p.31: 40% - 38% - 18% - 7%
2) Why to mention “water abstraction (7%)” separately, since it is already included in HYMO pressures?
-
BE-FLA (RV): p. 57, Figure 6.2. Note: Pressures from diffuse sources do not include atmospheric deposition.
Is confusing. Compare with Fig 2.9 on p 32
-
deposition... (40%)
-
SK: Page 57, 1st paragraph: Make sentence more clear by adding also percentage for atmospheric deposition in the brackets. Otherwise, the sentence could be understood that atmospheric deposition and diffuse source pollution together achieve 37 %.
-
SK: Figure 6.2 and 6.4 (left part of the figures) - Sort the significant pressures by increasing percentage.
-
(AT) 1st sentence: hydromorphological pressures (41 %),
The number does not fit to tab. 2.8. or?
Around 18 % of surface water bodies had no identified significant pressures, while 36 % of surface water bodies are affected by 1 pressure, and 39% are affected by multiple (more than one) significant pressures (Figure 6.3). Diffuse pollution and hydromorphology is the most common combination of two-pressures in rivers and lakes (respectively ca. 62 % and 71% of WBs with two-pressures combinations), followed by point and diffuse pollution. In contrast, the most common combination in transitional and coastal waters is point and diffuse source pollution (59 % of transitional and coastal water bodies with two-pressures combinations). Excluding pressures from atmospheric deposition one third of the water bodies are having pressures compared to 40 % of water bodies are in high and good ecological status.
Figure 6.3. Proportion of surface water bodies impacted simultaneously by single, multiple or no pressures at all; A) All pressures and B*) excluding pressures from atmospheric deposition.


Note: The diagram without pressure from atmospheric deposition gives a better indication of proportion of water bodies affected by no pressure or multiple pressures in relation to ecological status.
Source: Preliminary results based on WISE-SOW database – 25 Member States 2017.
-
"Excluding pressures from atmospheric deposition one third of the water bodies are having pressures compared to 40 % of water bodies are in high and good ecological status." this sentence is not very clear...
-
"Diffuse pollution and hydromorphology is the most common combination of two-pressures in rivers..."
In fact, 64% of WB is affected by more than 1 significant pressure. It is unclear how 39% is calculated.
-
BE-WAL (EC): p. 57 last §
47 % (26+15+6) instead of 39%? See chart 1
-
BE-WAL (EC): p. 57 figure 6.3
The colour choice is not appropriate
-
SK: Figure 6.3: Adjust the legend for “, 2, 3, 4”in the chart.
With regard to groundwater, the main pressures for chemical status are diffuse source (34 % of groundwater area) and point source (14 %) pollution, while for groundwater quantitative status; the main pressures are from water abstraction (17 %) (Figure 6.4).
The primary impacts on groundwater are related to chemical pollution (21 % of groundwater area), followed by nutrient pollution (17 %), while different impacts are identified in relation to quantitative status.
Figure 6.4: Overview of the proportion of the area of groundwater bodies having A) main significant pressures and B) impacts in the second RBMPs.
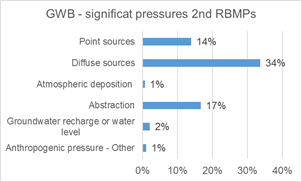
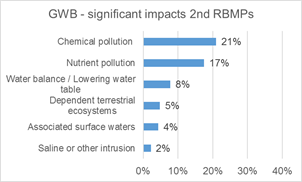
Note: Pressures from diffuse sources do not include atmospheric deposition. The diagrams show the proportion (%) of groundwater area affected by each main pressure and impact for the second RBMPs (4.3 million km2).
Source: Preliminary results based on WISE-SOW database – 25 Member States 2017.
From the first to the second RBMPs there is an increase in the proportion of water bodies being affected by significant pressures. Statements in the digital versions of the RBMPs indicate (e.g. Swedish RBMPs) that this is not due to an actual increase in pressures, but is due to a better knowledge of the pressures affecting the water bodies. In contrast, there is evidence that some pressures have decreased during the first RBMP cycle, which is leading to improved water quality (see section 6.2) and improvements in hydromorphology (see section 6.3).
-
BE-FLA (RV): p.58 With regard to groundwater, the main pressures for chemical status are diffuse source (34 % of groundwater area) and point source (14 %) pollution, while for groundwater quantitative status; the main pressures are from water abstraction (17 %) (Figure 6.4).
1) 34% and 14%: see Fig 4.7 p 49; include failed +good
2) p. 49 + p 52: 22% - 8% - 16%
-
BE-FLA (RV): p.58 The primary impacts on groundwater are related to chemical pollution (21 % of groundwater area), followed by nutrient pollution (17 %), while different impacts are identified in relation to quantitative status.
Figures can’t be traced in respective GW chapter
-
BE-FLA (RV) Figure 6.4 – significant impacts
The figure is a mixed set of impacts!
-
"From the first to the second RBMPs there is an increase..."
Proposal: instead "there is an increase", "an increase might be seen" as the following text explains that there is NO increase.
-
SK: Page 58, 1st paragraph: Replace “diffuse source” and “point source” by “diffuse sources” and “point sources”.
-
(AT) Figure 6.4:
In Fig. 4.3 Nitrate is shown as reason for failing good status for 18 % of GWB area. In previous chapters agriculture (diffuse sources) is identified as main pressure – for impacts there is split into nutrient and chemical; chemical includes pesticides??
Implementation of measures
The WFD requires an assessment of the significant pressures in a river basin, and where a water body is not in good status, a targeted Program of Measures (PoMs) needs to be developed. The first RBMPs already contained many kinds of measures. The types of measures frequently reported by Member States were construction or upgrade of urban waste water treatment plants, encouraging best practice measures in agriculture to reduce nutrient pollution, implementing measures to improve river continuity and habitat quality, ensuring adequate drinking water protection, as well as research projects to improve the knowledge base and reduce uncertainty (EC, 2015[2]).
In December 2012, Member States reported on their progress in implementing the PoMs from the first RBMPs. Already in 2012, the challenge of fully implementing all measures was obvious, as only around a quarter were reported as completed. In 2012, the implementation of most measures (66 % of basic and 54 % of supplementary measures) was still ongoing, while the implementation of other measures had not even started (11 % and 17 % for basic and supplementary measures, respectively).
The interim progress report of Member States on the PoM in 2012 indicated that in the majority of RBDs, basic measures would not be sufficient to tackle these key pressures and supplementary measures would need to be taken. Especially supplementary measures have been reported as necessary to tackle the main pressures on EU water bodies, namely diffuse pollution from agriculture and hydromorphological pressures. In the same time, only 10 % of the supplementary measures for hydromorphology and diffuse pollution sources had been completed by 2012 (75 % were ongoing and 15 % had not yet started) (EC, 2015[3]).
By now, many of the several thousand individual measures in the first RBMPs will have been completed (to be updated based on EC, 2018). However, some measures have been delayed or even not started mainly due to funding constraints, while other measures have been difficult to implement.
In the following sections (6.2 Pollution and water quality; and 6.3 Hydromorphology and water abstractions), an overview of the main issues/pressures is provided (point sources, diffuse sources, chemicals, hydromorphology, and water abstractions), along with examples of key measures that have been implemented in recent years because of the first RBMPs.
-
"The interim progress report of Member States on the PoM in 2012 indicated that in the majority of RBDs, basic measures would not be sufficient to tackle these key pressures and supplementary measures would need to be taken. Especially supplementary measures have been reported as necessary to tackle the main pressures on EU water bodies, namely diffuse pollution from agriculture and hydromorphological pressures. In the same time, only 10 % of the supplementary measures for hydromorphology and diffuse pollution sources."
According to the argument above, the 2 action fields morphology and diffuse pollution control should be switched.
-
The proposal to achieve the objectives of the WFD are much oriented towards natural-resources ingeneering. We suggest to : 1) Underline the synergy between environmental policy and sectorial policies, mainly agriculture for diffuse pollutions. 2) Underline the necessity of a long time period to observe an improvement of the state of the aquatic milieu, after enhancing ecological restauration or fighting against diffuse pollutions. 3) Recall the significant role of wetlands for biodiversity, for filtrating the pollutions or for buffering the high river flows (and supporting low flows with a progressive restitution of stored water).
6.2 Pollution and water quality
A range of pollutants in many of Europe’s waters threatens aquatic ecosystems and may raise concerns for public health. These pollutants arise from a range of sources including agriculture, industry, households and the transport sector. They are emitted to water via numerous diffuse and point pathways. Once released into freshwater, pollutants can be transported downstream and ultimately discharged to coastal waters, together with direct discharges from cities, industrial discharges and atmospheric deposition polluting coastal waters.
Clean unpolluted water is essential for our ecosystems. Aquatic plants and animals react to changes in their environment caused by changes in water quality. Pollution takes many forms: 1) faecal contamination from sewage makes water aesthetically unpleasant and unsafe for recreational activities such as swimming; 2) many organic pollutants, including sewage effluent as well as farm and food-processing wastes, consume oxygen, suffocating fish and other aquatic life; 3) excess nutrients can create eutrophication, a process characterised by increased plant growth, problematic algal blooms, depletion of oxygen, loss of life in bottom water, and undesirable disturbance to the balance of organisms present in the water; and moreover, 4) pollution through hazardous substances and chemicals can threaten aquatic ecosystems and human health.
Reducing pollution to meet the objectives of the WFD requires that several other directives and regulations are implemented. These include the Urban Waste Water Treatment Directive, the Nitrates Directive, the Directive on Sustainable Use of Pesticides, the Industrial Emissions Directive and the Regulation on the registration, evaluation, authorization and restriction of chemicals (REACH), which all play a key role in tackling point and diffuse source pollution.
-
"Pollution takes many forms: 1) faecal contamination from sewage makes water aesthetically unpleasant and unsafe for recreational activities such as swimming; 2) many organic pollutants, including sewage effluent as well as farm and food-processing wastes, consume oxygen, suffocating fish and other aquatic life; 3) excess nutrients can create eutrophication, a process..."
Please replace "organic pollutants" by "organic materials" to "...2) many organic materials, including sewage effluent as well as... "
Explanation: organic materials (or better the associated microbes) can consume oxygen during decomposition - organic pollutants do not necessarily consume oxygen ...
-
In reference to the 1st paragraph: In the European Union, a vast majority of aggregates extraction sites are dealing with inert materials such as sand, gravel and crushed rock, and produce inert wastes according to EU definitions and criteria included in EU Directives. The industry’s production process and treatment plants do not include the use of chemicals, as in most of the cases the processes are based on mechanical crushing, milling, grinding, and size grading. The Aggregates Industry does not represent a threat for water quality. According to permit conditions, main parameters to be considered in quarries and sand and gravel pits are pH, TSS, BOD, BOQ, for which the water discharge parameters are monitored and declared. With the technology in place, water quality is perfectly manageable in aggregates extraction sites. It is necessary to make a clear distinction between the concept of mining and quarrying, as the nature of their activities and the properties of the materials they extract are very different. It is therefore essential to define clearly in the report what is meant by heavy industry or mining. As mining sites counting for less than 5% in comparison with quarries, sand and gravel extraction sites representing 95%, it would be recommended to clearly define which measures apply to mining and which ones to the Aggregates Industry rather than addressing the entire extractive industry.
-
In reference to the 2nd paragraph: In the European Union, a vast majority of aggregates extraction sites are dealing with inert materials such as sand, gravel and crushed rock, and produce inert wastes according to EU definitions and criteria included in EU Directives. The industry’s production process and treatment plants do not include the use of chemicals as in most of the cases the processes are based on mechanical crushing, milling, grinding, and size grading. It is necessary to make a clear distinction between the concept of mining and quarrying, as the nature of their activities and the properties of the materials they extract are very different, and the Aggregates Industry does not represent a threat for water quality. Moreover, in the aggregates industry, it is possible to create wetlands during and after the extraction phase, according with the permit granted by the administration (including environment and water management authorities, and in many cases under the EIA scheme). Most of those new wetlands or lakes are designed according to suitable hydromorphological parameters, to achieve a new (artificial) water body that is able to grant water quality parameters and biodiversity requirements for their life time. Some of them have flood protection designs or even good quality water supply to urban areas for human consumption. Recent studies from different countries (Denmark, Austria, France, UK, Germany, Spain) are demonstrating that water quality is by far better in these artificial wetlands linked to quarries and sand and gravel pits extaction sites, compared to natural lakes. The rise of biodiversity is, again, a living proof of that. These facts have received recognition by the European Commission, research institutions, and a number of environmental NGOs.
It would be therefore recommended to clearly define what is meant by heavy industry or mining and which measures apply to mining and which ones to the Aggregates Industry, rather than addressing the entire extractive industry. -
Last paragraph (mentioning REACH):
This aspect deserves a better development: There is potentially a problem of coherence between the objectives that are fixed by the WFD (and other "milieu" approaches) and the implementation of REACH (i.e. regulation of emissions/pressures).
Point source pollution
The point source pressures for surface waters are related to effluent discharges of pollutants from urban waste water followed to a lesser degree by discharges from storm water, industries sites and aquaculture, while the point source pressures affecting groundwater is more related to leaching of hazardous substances from landfills and contaminated sites. During the last century, increased population growth and increased waste water production and discharge from urban areas and industry resulted in a marked increase in water pollution from point sources.
In the second RBMPs, Member States identified 21 % of surface water bodies being affected by point source pollution pressures, with transitional and coastal waters more affected than rivers and lakes. The main driver for point source pollution in the second RBMPs is urban waste water, being the source for around 70 % of surface water bodies affected by point sources. Furthermore, point sources from contaminated sites are a significant pressure for 14 % of groundwater body area.
Downward trends in concentrations of water pollutants associated with urban and industrial wastewater are evident in most of Europe's surface waters (Figure 6.5). This is also reflected in the quality of EU bathing waters, which has improved significantly since 1990 (EEA, 2016[4]). In 2016, more than 96 % of bathing sites had good water quality (EEA, 2017[5]). Concentrations of pollutants associated with waste water discharge such as BOD, ammonium and phosphate in European rivers and lakes have decreased markedly over the past 25 years (Figure 6.5).
Figure 6.5: Trend in Biological Oxygen Demand (BOD) and orthophosphate in European rivers.


|
Note: The diagram depicts two-time series: the longer time series has fewer stations (539) and the shorter time series has more (1 235). Source: Link |
Note: The diagram depicts two-time series: the longer time series has fewer stations (874) and the shorter time series has more (1 470). Source: Link. |
-
Figure 6.5:
This form of presentation is quite informative especially for experts - the problem with this form of presentation, to our opinion, is that the non-expert reader is "left alone" with the interpretation of the diagramms.
There are two lines showing a similar trend, based on different datasets. But, there is no explanation in the text why this form of diagramm is used and why the two lines in the graphs showing the same trend are used. A policy paper for the politics, the broader public and the administration should to our opinion include a more simplified presentation. Please use one line per graph only. As an alternative you may insert some sentences in the text -"why two lines were used?" and "which of the two lines might be the better / more useful one"
-
In reference to the 1st paragraph: In the European Union, a vast majority of aggregates extraction sites are dealing with inert materials such as sand, gravel and crushed rock, and produce inert wastes according to EU definitions and criteria included in EU Directives. The industry’s production process and treatment plants do not include the use of chemicals as in most of the cases the processes are based on mechanical crushing, milling, grinding, and size grading. It is necessary to make a clear distinction between the concept of mining and quarrying, as the nature of their activities and the properties of the materials they extract are very different, and the Aggregates Industry does not represent a threat for water quality. Moreover, in the aggregates industry, it is possible to create wetlands during and after the extraction phase, according with the permit granted by the administration (including environment and water management authorities, and in many cases under the EIA scheme). Most of those new wetlands or lakes are designed according to suitable hydromorphological parameters, to achieve a new (artificial) water body that is able to grant water quality parameters and biodiversity requirements for their life time. Some of them have flood protection designs or even good quality water supply to urban areas for human consumption. Recent studies from different countries (Denmark, Austria, France, UK, Germany, Spain) are demonstrating that water quality is by far better in these artificial wetlands linked to quarries and sand and gravel pits extaction sites, compared to natural lakes. The rise of biodiversity is, again, a living proof of that. These facts have received recognition by the European Commission, research institutions, and a number of environmental NGOs.
It would be therefore recommended to clearly define what is meant by heavy industry or mining and which measures apply to mining and which ones to the Aggregates Industry, rather than addressing the entire extractive industry. -
In reference to "Downward trends in concentrations of water pollutants associated with urban and industrial wastewater are evident in most of Europe's surface waters": That is proof of the commitment of the industrial sectors like the aggregates extraction sector, towards the permanent improvement of water management.
-
BE-FLA (RV): p. 59 §7 discharges from storm water, industries sites
discharges from storm water overflows, industriales sites
-
BE-FLA (RV): p. 59 In the second RBMPs, Member States identified 21 % of surface water bodies being affected by point source pollution pressures, with transitional and coastal waters more affected than rivers and lakes. The main driver for point source pollution in the second RBMPs is urban waste water, being the source for around 70 % of surface water bodies affected by point sources. Furthermore, point sources from contaminated sites are a significant pressure for 14 % of groundwater body area.
p. 31: 38%
p. 32: 12%
p. 49: 4%
-
SK: Figure 6.5: We propose to change the titles of axis y to concentration of BOD5, mg/l and concentration of P-PO4, mg/l.
-
(AT) 2nd para, 1st sentence: In the second RBMPs, Member States identified 21 % of surface water bodies ...
Figure 2.8 says 18%
Measures for improved wastewater treatment
Over the past few decades, clear progress has been made in reducing emissions into surface waters. Implementation of the Urban Waste Water Treatment Directive (91/271/ EEC), together with national legislation, has led to improvements in wastewater treatment across much of the European continent[6], [7]. These positive trends are due to increased connection to sewers, improvements in wastewater treatment and reduction of substances at source such as lowering the phosphate content in detergents. Table 6.1 illustrates some examples of point source measures implemented during the past years.
Table 6.1: Examples of measures on reducing point source discharges
|
Measures |
|
|
Danube iRBD
|
Sewer systems and urban waste water treatment plants have been constructed, upgraded or extended at almost 900 agglomerations (2009-2015 - ICPDR 2015) |
|
Bucharest, Romania |
After start of UWWTP operation in 2011, concentrations of organic and nutrient pollution indicators have significantly decreased (2011-2015 – EEA 2016) |
|
St. Petersburg, Russia
|
After start of UWWTP operation in St. Petersburg in 2005, inputs of nutrients in the Eastern Gulf of Finland significantly decreased; also, several UWWTP enhanced in Poland and Latvia in recent years |
|
Germany |
Total phosphorus discharges have decreased by ca. 70% from 1983 until 2014 (UBA 2018). |
Sources: ICPDR 2015; http://www.icpdr.org/main/activities-projects/river-basin-management-plan-update-2015
EEA 2016: Rivers and lakes in European cities. EEA Report No 26/2016. https://www.eea.europa.eu/publications/rivers-and-lakes-in-cities.
HELCOM: St. Petersburg http://www.portofhelsinki.fi/en/emagazine/baltic-sea-recovering
UBA 2018: Einträge von Nähr- und Schadstoffen in die Oberflächengewässer. https://www.umweltbundesamt.de/daten/wasser/fliessgewaesser/eintraege-von-naehr-schadstoffen-in-die#textpart-1
Diffuse source pollution
In Europe, diffuse source pollution is mostly due to excessive emissions of nutrients (nitrogen and phosphorus) and chemicals such as pesticides. In the second RBMPs, Member States identified that diffuse pollution affects 37 % of surface water bodies[8] and 34 % of the area of groundwater bodies. Agricultural production is a major source of diffuse pollution affecting 68 % of water bodies affected by diffuse pollution pressures[9]. Further drivers include rural dwellings (emissions from households not connected to sewage systems), run-off from urban areas and forested land. Nutrient enrichment causes eutrophication, which in turn leads the loss of aquatic biodiversity and reduction of fish stocks. Excessive nutrient enrichment can be dangerous for human health, e.g. due to toxic algal blooms, and impair the use of drinking water and bathing.
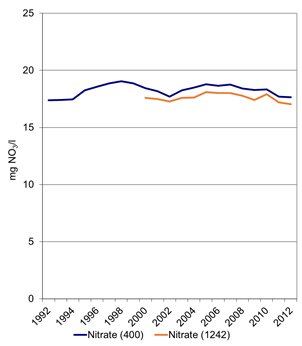
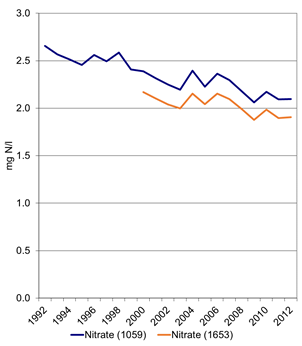
The average nitrate concentration declined by 20 % in European rivers between 1992 and 2012, while already in 2011 groundwater nitrate concentrations almost returned to the levels in 1992 (Figure 6.6). The decline in nitrate concentration reflects the effects of measures to reduce agricultural emissions of nitrate, as well as improvements in wastewater treatment. Decreasing trends are more visible in rivers as they react fairly quickly to changes in nutrient surplus; in contrast, the comparatively long residence time of groundwater may cause delays in recovery in the order of years to decades between the application of nutrient control measures and measurable improvements in water quality.
Figure 6.6: Trend in water quality – nitrate in rivers and groundwater
|
Note: The diagram depicts two-time series: the longer time series has fewer stations (400) and the shorter time series has more (1242). Source: Link |
Note: The diagram depicts two-time series: the longer time series has fewer stations (1059) and the shorter time series has more (1653). Source: Link |
-
Please, check the links under the diagramms of figure 6.6.
-
The links have now been corrected.
-
Figure 6.6:
1. The same comment as for figure 6.5.
2. Please check the titel and the diagrams.
It is not visible which of the two diagrams shows nitrate for rivers and nitrate for groundwater. In the right diagram the y - axis is named with " mg N /l" but in the titel "nitrate" is mentioned.
In the left diagram we do not see a clear decreasing trend as described at page 61. Please change the sentence at pages 61 and clarify the content.
Please also check or discuss with your colleagues whether the diagram for groundwater is really needed or not. If not please delete this diagram.
-
BE-FLA (RV): p. 61 In Europe, diffuse source pollution is mostly due to excessive emissions of nutrients (nitrogen and phosphorus) and chemicals such as pesticides. In the second RBMPs, Member States identified that diffuse pollution affects 37 % of surface water bodies34 and 34 % of the area of groundwater bodies. Agricultural production is a major source of diffuse pollution affecting 68 % of water bodies affected by diffuse pollution pressures.
p. 31: 38%
p. 32: 38%
p. 49: 22%
-
BE-WAL (EC): p. 62 figure 6.6
Why don't you choose the same unit for the 2 graphs?
-
SK: Figure 6.6: Does the each graph under Figure 6.6 present nitrates and nitrogen together for rivers and groundwater?
We propose:
- to divide Figure 6.6 into two graphs: one graph for rivers, and another graph for groundwater,
- to present the same unit in graph for rivers and in the graph for groundwater (both graphs in mg NO3/l or in mg N /l),
- to add and unify the description of the axes and the legend together with the relevant unit (on axes and in the legend.
-
(AT): 2nd para, 1st sentence: The average nitrate concentration declined by 20 % in European rivers between 1992 and 2012, while already in 2011 groundwater nitrate concentrations almost returned to the levels in 1992 (Figure 6.6).
Are the data representative for EEA area? Is this assessment in line with observations according to the Nitrate-Directive?
-
(AT) Figure 6.6
The different presentation of Nitrate in GW as NO3 and in rivers as N in the two charts (close to each other) gives a misleading impression – for rivers at least NO3 should be added.
Please indicate which graph presents rivers and which groundwater.
-
SK: Figure 6.6: Source links do not work in the word and pdf file.
-
SE: Figure 6.6 needs clarification. Explain which diagram corresponds to groundwater and rivers respectively, and the reason for showing mg NO3/l in one diagram and mg N/l in the other and how to interpret the difference.
-
CZ: Fig. 6.6:
It is hard to distinguish chart for groundwater and chart for surface water (no titles). Both charts should use same units.
Measures to reduce diffuse nutrient pollution.
EU action on curbing diffuse nutrient pollution has a long history[10], [11]. Measures taken in the last decades have resulted in a reduction of mineral fertilizer used and nutrient surpluses of agricultural origin have progressively decreased in the EU (Figure 6.7). Between 2000 and 2013, agricultural nitrogen surplus decreased by 7 % in the EU, while phosphorus surplus have decreased by 50 %[12].
Nevertheless, the overall level of fertilization remains high in parts of Europe. Large variations in the nitrogen and phosphorus surplus exist between Member States[13] and, on average fertiliser use has started increasing again in the last years.
Nutrient balances at river basin level are now used in several countries in order to define nutrient load reduction targets to support the achievement of WFD objectives. Member States have taken measures at the national level or at the level of the river basin (e.g. general binding rules, taxes, manure surplus management), while other measures are more local (e.g. protection of specific drinking water areas).
Some Member States have also focused action in “priority catchments” at higher risk of nutrient enrichment. These catchments tend to receive a greater level of awareness-raising campaigns and investments.
Figure 6.7: Trend in fertiliser use and nutrient surplus.
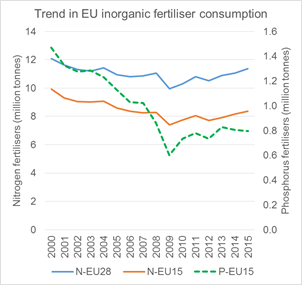
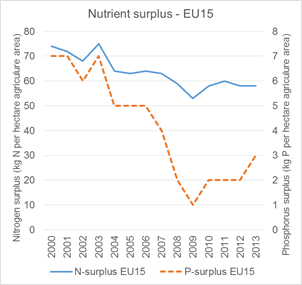
Note: Only long-term trend is available for the EU15 Member States (mention MS), except for N-fertiliser use, however EU15 accounts for the majority of fertiliser use (80 %) in the EU28.
Source : Eurostat http ://ec.europa.eu/eurostat/en/web/products-datasets/-/AEI_FM_USEFERT & http ://ec.europa.eu/eurostat/en/web/products-datasets/-/AEI_PR_GNB
-
Figure 6.7:
The diagram does to our opinion not capture regional differences in a adequate manner. Please check whether the underlying data should be used in the context of the report.
-
We suggest to Underline the synergy between environmental policy and sectorial policies, mainly agriculture for diffuse pollutions.
The proposal to achieve the objectives of the WFD are much oriented towards natural-resources ingeneering. We suggest to underline : 1) the synergy between environmental policy and sectorial policies, mainly agriculture for diffuse pollutions. 2) the necessity of a long time period to observe an improvement of the state of the aquatic milieu, after enhancing ecological restauration or fighting against diffuse pollutions.
During the implementation of the first RBMPs, there were several examples of Member States strengthened action on reduction of nutrient pollution from agriculture (Table 6.2). Member States are implementing different kinds of measures, e.g. farm-level nutrient planning, setting fertiliser standards (e.g. timing), using appropriate tillage, using nitrogen-fixing and catch crops, setting aside buffer strips, and using crop rotation.
Other measures include livestock management through improved feeding (reduced phosphate compounds) and reduced grazing, as well as optimised manure management (increased manure storage, reduced use), and manure surplus management. Manure storage, in particular, can improve timing of application to minimise risks of excessive leaching to the water environment.
Several Member States are also supporting targeted green infrastructure such as constructed wetlands, sediment boxes and run-off ponds that capture and retain nutrient losses through agricultural drainage. River restoration and less-intensive land uses such as afforestation are also increasingly recognised as effective means to tackle diffuse pollution pressures as they increase nutrient retention and recycling.
Despite on-going action to curb diffuse pollution from agriculture, the European Commission estimated recently that measures taken under the Nitrates Directive were not enough to tackle significant pressures from diffuse sources to reach good ecological status[14], [15].
Table 6.2: Examples of measures on reducing pollution from diffuse sources
|
River basin district or country |
Measures |
|
Baltic Sea |
The Nordic countries (Denmark, Finland and Sweden) and Baltic States (Estonia, Latvia and Lithunia) have introduced a wide range of measures to reduce diffuse pollution from agriculture (Andersen et al. 2014) |
|
Nitrate Directive implementation NW-EU Member States |
The impact of the Nitrate Directive implementation in the North-Western EU Member States has been reviewed for the period 1995-2008. The most significant environmental effect of the implementation of the NiD since 1995 is a major contribution to the decrease of the soil N balance (N surplus). This decrease is accompanied by a modest decrease of nitrate concentrations since 2000 in fresh surface waters in most countries (Grinsven et al. 2012). |
|
Denmark |
A series of policy action plans have been implemented since the mid-1980s with significant effects on the surplus, efficiency and environmental loadings of N. Over the last 30 years the N-leaching from the field root zone has been halved, and N losses to the aquatic and atmospheric environment have been significantly reduced. However, there is still a major challenge in complying with the EU Water Framework and Habitats Directives (Dalgaard et al. 2014) |
|
Leipzig, Germany |
Reduction of groundwater nitrate concentration from 40 mg to 20 mg per litre by incentivising organic farming and implementing hydrological measures in drinking water protected areas (BMUB/UBA, 2016) |
|
Schleswig Holstein, Germany |
Nitrogen use has in some cases halved (i.e. from 120 to 60 kilograms per ha) at the level of individual farms (BMUB/UBA, 2016) |
|
French Loire-Bretagne RBD |
Identification of priority catchments and focus on drinking water protected areas. Increase in the number of balanced manure plans on phosphorous from 53% to 81% between 2009-2012 (Loire-Bretagne RBMP 2015) |
|
Ireland |
In addition to application standards required by the Nitrates Directive, no organic or chemical fertiliser nor soiled water can be applied when heavy rain is forecast within 48 hours or when the ground slopes steeply and there is a risk of water pollution (Amery and Schoumans 2014) |
Source: Andersen et al. 2014 Mitigating diffuse nitrogen losses in the Nordic-Baltic countries. http://www.sciencedirect.com/science/article/pii/S0167880914002990
Grinsven et al. 2012: Management, regulation and environmental impacts of nitrogen fertilization in northwestern Europe under the Nitrates Directive: a benchmark study. https://biblio.ugent.be/publication/3072131
Dalgaard et al. 2014: Policies for agricultural nitrogen management—trends, challenges and prospects for improved efficiency in Denmark. http://iopscience.iop.org/article/10.1088/1748-9326/9/11/115002/meta
BMUB/UBA, 2016 Water Framework Directive The status of German waters 2015. https://www.umweltbundesamt.de/publikationen/water-framework-directive
Loire-Bretagne RBMP 2015
Amery, F. and O.F. Schoumans, 2014. Agricultural phosphorus legislation in Europe. Merelbeke, ILVO, 45 p.
-
The Danish Ministry of Environment and Food does not agree with the following sentence, "However, there is still a major challenge in compying with the EU Water Framework Directive and the Habitats Directive." It is a subjective assessment. Please delete.
Chemical pollution
In the WFD, the risks and impacts from pollution with chemical substances contribute to three different status assessments: 1) surface water chemical status based on priority substances (chapter 3); 2) ecological status as regards River Basin Specific Pollutants (chapter 2) and groundwater chemical status (chapter 4).
The main findings were:
- The percentage of surface water bodies in good chemical status within the EU is 38 %, while 46 % are not achieving good chemical status and 16 % of the water bodies have unknown chemical status. In many Member States, relatively few substances are causing failure to achieve good chemical status. Mercury causes failure in a high number of water bodies. If widespread pollution by ubiquitous substances including mercury is disregarded, the proportion in good chemical status improves to 78 % of all surface water bodies, and 4 % do not achieve good chemical status (16 % has unknown status). The main pressures leading to failure of good chemical status are atmospheric deposition and discharges from urban waste water treatment plants.
- Several Member States (Austria, Belgium, Germany, Sweden, Luxembourg and Slovenia) have extrapolated the results for failure to reach good chemical status to all water bodies, because the environmental quality standard for mercury was exceeded in all monitoring samples.
- At EU level, only 5 % of water bodies failed to achieve good status due to River Basin Specific Pollutants (RBSPs) identified by the Member States, with zinc and copper being the main RBSPs causing failure.
- 74 % of the area of groundwater bodies in the EU is in good chemical status. Of the 160 pollutants causing failure to achieve good status, 15 are reported by more than five Member States. Nitrate is the predominant groundwater pollutant throughout the EU followed by pesticides. In addition, salt intrusion (e.g. chloride), some chemicals used industrially e.g. tetrachloroethylene, and/or metals, such as arsenic, nickel and lead, are causing problems in some Member States. Agriculture is the main pressure causing failure of groundwater chemical status, and other significant pressures are discharges not connected to a sewerage system and pollution from contaminated sites or abandoned industrial sites.
Chemical pollutants are or have been emitted to water bodies through a range of pathways and from a variety of sources, including industry, agriculture, transport, mining and waste disposal, as well as from our own homes. Significant levels of some priority substances have built up from historic use and this legacy pollution may persist in water bodies long after pollutant discharges and inputs have ended.
Information regarding the sources and emissions of many pollutants remains incomplete, limiting the scope for identification and targeting of appropriate measures.
-
"Several Member States (Austria, Belgium, Germany, Sweden, Luxembourg and Slovenia) have extrapolated the results for failure to reach good chemical status to all water bodies, because the environmental quality standard for mercury was exceeded in all monitoring samples." please delete Luxembourg from the enumeration list.
-
In reference to: "In addition, salt intrusion (e.g. chloride), some chemicals used industrially e.g. tetrachloroethylene, and/or metals, such as arsenic, nickel and lead, are causing problems in some Member States. Agriculture is the main pressure causing failure of groundwater chemical status, and other significant pressures are discharges not connected to a sewerage system and pollution from contaminated sites or abandoned industrial sites." In the European Union, a vast majority of aggregates extraction sites are dealing with inert materials such as sand, gravel and crushed rock, and produce inert wastes according to EU definitions and criteria included in EU Directives. The industry’s production process and treatment plants do not include the use of chemicals as in most of the cases the processes are based on mechanical crushing, milling, grinding, and size grading. It is necessary to make a clear distinction between the concept of mining and quarrying, as the nature of their activities and the properties of the materials they extract are very different, and the Aggregates Industry does not represent a threat for water quality. Moreover, in the aggregates industry, it is possible to create wetlands during and after the extraction phase, according with the permit granted by the administration (including environment and water management authorities, and in many cases under the EIA scheme). Most of those new wetlands or lakes are designed according to suitable hydromorphological parameters, to achieve a new (artificial) water body that is able to grant water quality parameters and biodiversity requirements for their life time. Some of them have flood protection designs or even good quality water supply to urban areas for human consumption. Recent studies from different countries (Denmark, Austria, France, UK, Germany, Spain) are demonstrating that water quality is by far better in these artificial wetlands linked to quarries and sand and gravel pits extaction sites, compared to natural lakes. The rise of biodiversity is, again, a living proof of that. These facts have received recognition by the European Commission, research institutions, and a number of environmental NGOs.
It would be therefore recommended to clearly define what is meant by heavy industry or mining and which measures apply to mining and which ones to the Aggregates Industry, rather than addressing the entire extractive industry. -
In reference to: Chemical pollutants are or have been emitted to water bodies through a range of pathways and from a variety of sources, including industry(...)". In the European Union, a vast majority of aggregates extraction sites are dealing with inert materials such as sand, gravel and crushed rock, and produce inert wastes according to EU definitions and criteria included in EU Directives. The industry’s production process and treatment plants do not include the use of chemicals as in most of the cases the processes are based on mechanical crushing, milling, grinding, and size grading. It is necessary to make a clear distinction between the concept of mining and quarrying, as the nature of their activities and the properties of the materials they extract are very different, and the Aggregates Industry does not represent a threat for water quality. Moreover, in the aggregates industry, it is possible to create wetlands during and after the extraction phase, according with the permit granted by the administration (including environment and water management authorities, and in many cases under the EIA scheme). Most of those new wetlands or lakes are designed according to suitable hydromorphological parameters, to achieve a new (artificial) water body that is able to grant water quality parameters and biodiversity requirements for their life time. Some of them have flood protection designs or even good quality water supply to urban areas for human consumption. Recent studies from different countries (Denmark, Austria, France, UK, Germany, Spain) are demonstrating that water quality is by far better in these artificial wetlands linked to quarries and sand and gravel pits extaction sites, compared to natural lakes. The rise of biodiversity is, again, a living proof of that. These facts have received recognition by the European Commission, research institutions, and a number of environmental NGOs.
It would be therefore recommended to clearly define what is meant by heavy industry or mining and which measures apply to mining and which ones to the Aggregates Industry, rather than addressing the entire extractive industry. -
BE-FLA (RV): p. 64 If widespread pollution by ubiquitous substances including mercury is disregarded, the proportion in good chemical status improves to 78 % of all surface water bodies, and 4 % do not achieve good chemical status (16 % has unknown status).
p. 35: 81% - 3% - 16%
-
BE-FLA (WV): p. 65 Several Member States (Austria, Belgium, Germany, Sweden, Luxembourg and Slovenia) have extrapolated the results for failure to reach good chemical status to all water bodies, because the environmental quality standard for mercury was exceeded in all monitoring samples.
“water bodies”: specify “surface water bodies”; this remark also counts for the next main finding (see below)
-
BE-FLA (RV): p. 65 At EU level, only 5 % of water bodies failed to achieve good status due to River Basin Specific Pollutants (RBSPs) identified by the Member States, with zinc and copper being the main RBSPs causing failure.
These parameters and figures can’t be traced in the previous chapters
-
- At EU level, only 5 % of water bodies failed to achieve good status due to River Basin Specific Pollutants (RBSPs) identified by the Member States, with zinc and copper being the main RBSPs causing failure.
Please, consider our remarks made on the need to incorporate bioavailability and natural background in the compliance assessment for both metals. The consideration of both factors is crucial for making a proper ecological risk assessment related to these metals.
Effect of regulation of chemicals
Contamination caused by chemical pollutants is a major environmental concern in European waters and consequently is addressed by a number of EU legislative measures and policies. Reducing hazardous substances in water requires implementation of the current legislation, but also the adoption of more sustainable production and use of chemicals, both in Europe and beyond.
Improved efforts to retain these chemicals in waste water treatment plants with better waste water treatment should go hand in hand with clear efforts to reduce them at source. Such measures can range from raising consumer awareness, to encouraging industries to adjust the composition of their products, to, over the longer term, fundamentally reviewing our use of chemicals and product design – for instance, moving towards products, which can be easily repaired or recycled[16].
Reducing the emissions of priority substances and phasing out priority hazardous substances – The WFD requires the adoption of measures to control the discharges, emissions and losses of priority and priority hazardous substances to the aquatic environment – progressive reduction in the case of priority, cessation or phasing out in the case of priority hazardous substances. Declines have been observed in the occurrences of some pesticides (e.g. atrazine and diuron), (see section 3.5). This decline relates to banning or restrictions on their use, while the effects of measures may take time as some are persistent and will stay in waters for decades.
Land contaminated with pollutants, for example, at abandoned mining areas, old industrial sites or old fuel stations can cause damage as the pollutants slowly leach into the water environment. Appropriate remedial actions are removal of contaminated material to be treated or incinerated, settling ponds, and local treatment plants.
Table 6.3: Examples of measures on regulating chemicals
|
River basin district or country |
Measures |
|
EU |
The Sustainable Use of Pesticides Directive[17] is an important instrument to help achieve good water status. It reduces the risks and impacts of pesticides on human health; on the environment; and promotes Integrated Pest Management. |
|
France |
The French Ministry of Agriculture has implemented the Ecophyto Plan aimed at reducing agricultural pesticide use by 50% by 2018. Environmental taxes on sales of pesticides (“redevances pour pollutions diffuses”) have been introduced in order to achieve this objective. |
|
England |
In England one of the measures in the first RBMPs has been a £25m investigation program by the water industry with the focus to gain improved understanding of risks arising from wastewater treatment works discharges. |
Missing sources
-
In reference to the 1st paragraph: Activities such as sand and gravel extraction, when properly conducted, can lead to the creation of new biotopes, where the natural phenomena of denitrification becomes beneficial to the aquifer and the surrounding natural environments. UEPG holds a significant database on this scientifically proven fact.
-
In reference to the 2nd paragraph: In the European Union, a vast majority of aggregates extraction sites are dealing with inert materials such as sand, gravel and crushed rock (without added chemicals and 100% recyclable), and produce inert wastes according to EU definitions and criteria included in EU Directives. The industry’s production process and treatment plants do not include the use of chemicals as in most of the cases the processes are based on mechanical crushing, milling, grinding, and size grading. It is therefore necessary to make a clear distinction between the concept of mining and quarrying, as the nature of their activities and the properties of the materials they extract are very different. It is recommended to define clearly in the report what is meant by industry or heavy industry or mining.
-
In reference to the 3rd paragraph: In the European Union, a vast majority of aggregates extraction sites are dealing with inert materials such as sand, gravel and crushed rock and produce inert wastes according to EU definitions and criteria included in EU Directives. The industry’s production process and treatment plants do not include the use of chemicals as in most of the cases the processes are based on mechanical crushing, milling, grinding, and size grading. The Aggregates Industry does not represent a threat for water quality. According to permit conditions granted by the administration (including environment and water management authorities, and in many cases under the EIA scheme), main parameters to be considered in quarries and sand and gravel pits are pH, TSS, BOD, BOQ, for which the water discharge parameters are monitored and declared. With the technology in place, water quality is perfectly manageable in aggregates extraction sites. Arsenic, nickel, lead and copper are present in very few sites in Europe, it is therefore important to avoid that a mention to very rare and specific problem is extended to most of the sites that are managing inert materials. It is necessary to clearly define what is meant by industry, heavy industry or mining in the report and it would be recommended to make a clear distinction between the concept of mining and quarrying, as the nature of their activities and the properties of the materials they extract are very different.
-
In reference to the 4th paragraph: In the European Union, a vast majority of aggregates extraction sites are dealing with inert materials such as sand, gravel and crushed rock and produce inert wastes according to EU definitions and criteria included in EU Directives. The industry’s production process and treatment plants do not include the use of chemicals as in most of the cases the processes are based on mechanical crushing, milling, grinding, and size grading. The Aggregates Industry does not represent a threat for water quality. Arsenic, nickel, lead and copper are present in very few sites in Europe, it is therefore important to avoid that a mention to very rare and specific problem is extended to most of the sites that are managing inert materials. Moreover, every extraction site has to comply with soil pollution legislation and needs an approved rehabilitation plan by the Administration (environment) that is designed to avoid any pollution on soil or on water (surface or groundwater). This risk is even lower or null in most of the extraction sites where all the extracted materials and the extractive wastes (when present) are inert. When necessary, appropiate preventive actions are considered in the design of the project of the plant that is approved by the Administration. As mining sites counting for less than 5% in comparison with quarries, sand and gravel extraction sites representing 95%, it would be recommended to clearly define which measures apply to mining and which ones to the Aggregates Industry, rather than addressing the entire extractive industry, as the nature of their activities and the properties of the materials they extract are very different. It is necessary to clearly define what is meant by industry, heavy industry or mining in the report to avoid any mistake by an extensive interpretation to the entire industry.
Text box: Reduction of mercury in the River Lippe, North Rhine-Westphalia
|
http://wrrl.flussgebiete.nrw.de Data: LANUV NRW |
The River Lippe is a tributary of the Rhine, with rural catchment upstream of Hamm, industrial and mining catchment downstream. EQS for mercury was not being achieved, so in 2012 additional monitoring programmes were started to better characterize discharges and status. Improved data were used in modelling, showing the pollutant pathways · Industrial discharger and power plants: 30 – 45% · Municipal sewage plants: 6 – 12 % (more than 90 plants) · Diffuse sources: 30 – 45% Pollution permits were revised for power plants and the chemicals park, rain water systems improved and the chlor alkali production process [closed down]. These actions led to reduction in mercury load between 2008-14.
|

-
Please change the link in the textbox: Delete "http://wrrl.flussgebiete.nrw.de" and replace by "https://www.flussgebiete.nrw.de/lippe-218".
6.3 Altered habitat and hydrology including water abstraction
For decades, humans have altered the shape of water bodies and flow of river courses in order to facilitate farming of the land, facilitate navigation, construct hydropower plants and protect settlements and agricultural land against flooding. For these purposes, rivers have been straightened, channelized and disconnected from their floodplains; land has been reclaimed; dams and weirs built, embankments reinforced and groundwater levels lowered. These activities have resulted in altered habitats, changed flows, interruption of river continuity, loss of floodplain connectivity and severe impacts on the status of the aquatic environment. These changes have caused damage to the morphology and hydrology of the water bodies, i.e. to their hydromorphology.
Hydromorphological pressures
Hydromorphological pressures are the second most commonly occurring pressure on surface waters after diffuse sources, affecting 40% of all surface water bodies. The main impact in the context of reporting, which is relevant to hydromorphological pressures, is “altered habitats”.

The most common hydromorphological measures applied in the first RBMPs include fish passes for upstream migration, removal of barriers, establishment of ecological flow, remeandering, reconnecting of backwaters, restoration of bank structure, instream structures (large wood, boulders) and, in some cases, sediment transport management (P&M study, DG ENV, 2012).
The hydromorphological pressures are briefly reviewed and examples on the recent implementation of some of these key hydromorphological measures in European countries are given below.
-
"For decades..."
- Proposal: for centuries (not decades)
- Proposal to add: However, these constructions have been serving as benefits for human development such as agricultural production, facilitation of transport, provision of drinking water, generation of hydroelectricity, etc.
- The raising and lowering of water levels and building reservoirs are missing.
- Would it be possible to speak about the progress made with environmental European policies in particular in EEA status reports as well? From our point of view, a lot of progress has been made by the private sector to adapt projects in order to avoid impacts.
-
"These activities have resulted in altered habitats, changed flows, interruption of river continuity, loss of floodplain connectivity and severe impacts on the status of the aquatic environment. These changes have caused damage to the morphology and hydrology of the water bodies, i.e. to their hydromorphology."
- The effect is not always negative. Therefore, at least “severe” should be left out. E.g. there are several examples of new very valuable habitats in built artificial lakes.
- Better wording: not "damage" but "alterations" according to entire paragraph
-
"For these purposes, rivers have been straightened, channelized and disconnected from their floodplains; land has been reclaimed; dams and weirs built, embankments reinforced and groundwater levels lowered."
Also: raised and stabilized ground water levels
-
This graph is not very clear. The reader should have a deep understanding on river hydrology and ecology to understand the links. Water level raise and lowering from physical modifications is missing. When you build a dam, the main alteration normally is the raise of water level. This also is quite often the main cause of impacts in the rivers.
Barriers, obstacles and transverse structures - examples of measures to make barriers passable
More than half (53%) of the water bodies impacted by hydromorphological pressures are affected by physical structures which impact longitudinal continuity (barriers, dams, locks). Barriers are mainly used for hydropower, flood protection and irrigation purposes. However, for the majority of barriers reported in the second RBMPs, the driver or water use served by the barrier is unknown or even obsolete.
There are several hundred thousand barriers and transverse structures in European rivers. Some of them are large dams for hydropower production or irrigation storage reservoirs, but the majority are smaller obstacles. Obstacles in rivers cause disturbances and have impacts on river continuity, which vary according to the height of the barrier and location. A major impact on a river could be caused by a single, very damaging structure or by the accumulated effects throughout the length of the river of a series of small structures, which may have only a small impact individually.
Several European river basins have master plans or conservation plans for restoring the population of threatened fish species and restoring river continuity. These plans are often the basis for the RBMP measures against obstacles and transverse structures. Table 6.4 illustrates examples of measures implemented during recent years (first RBMP cycle).
Table 6.4: Examples of measures on making barriers passable.
|
River basin district or country |
Measures |
|
Rhine iRBD
|
480 measures aimed at improving river continuity have been implemented from 2000 to 2012 (ICPR 2015). |
|
Danube iRBD |
More than 120 fish migration aids have been constructed, whereas 667 barriers remain unpassable out of a total 1,030 barriers (2009-2015 - ICPDR 2015). |
|
Elbe iRBD |
Continuity are completed for 60 locations and planned for 88 locations for the priority network in the iRBD (2009-2015 - ICPE 2015). |
|
France, Rhône RBD |
208 out of 788 priority barriers have been made passable (2010-2015 - Rhône RBD 2016). |
|
France, Seine RBD |
254 out of 5474 barriers have measures to improve river continuity implemented (2013-2015 - Seine RBD 2016) |
|
Austria |
More than 1000 barriers were made passable for fish (2009-2015 - Austria national RBMP 2015) |
|
The Netherlands |
Around 600 barriers have been made passable from 2008 to 2015 (Kroes et al. 2015) |
|
UK, England-Wales |
229 obstructions across England and Wales have been made passable. (2009-2014 - Nasco.int, 2015 papers) |
|
UK – Scotland RBD |
Fish access to 70 water bodies secured by the removal of barriers to fish migration – out of 306 water bodies impacted by migration barriers (2009-2015 - Scotland RBMP) |
Source ICPR: River basin management plan 2015. Available at http://www.iksr.org/en/water-framework-directive/river-basin-management-plan-2015/index.html – Section 7.1.1 Restoration of biological river continuity, increase of habitat diversity.
ICPDR 2015; http://www.icpdr.org/main/activities-projects/river-basin-management-plan-update-2015
Rhône Mediterranée district 2016: Tableau de bord adopté par le comité de bassin du 27/05/2016. http://www.rhone-mediterranee.eaufrance.fr/gestion/sdage2016/tableau-de-bord.php
ICPE 2015: Aktualisierung des Bewirtschaftungsplans nach Art. 13 WRRL. https://www.fgg-elbe.de/berichte/aktualisierung-nach-art-13.html
Seine RBMP 2016: Tableau de bord http://www.eau-seine-normandie.fr/mediatheque/Dossier_partage/INSTITUTIONNEL/SDAGE_2016_2021/TdB_SDAGE_2016_CB-4.2_big.pdf
Austria national RBMP 2015: https://www.bmlfuw.gv.at/wasser/wisa/fachinformation/ngp/ngp-2015/text/textdokument_ngp2015.html
Kroes et al. 2015: Fish Migration Possibilities in the Netherlands; State of the Art (Barriers, Solutions, Monitoring). http://scholarworks.umass.edu/fishpassage_conference/2015/June24/25
UK, England-Wales http://www.nasco.int/pdf/2015%20papers/CNL_15_43.pdf
Scotland 2nd RBMP: https://www.sepa.org.uk/environment/water/river-basin-management-planning/the-current-plans/
-
BE-FLA: p. 67 More than half (53%) of the water bodies impacted by hydromorphological pressures are affected by physical structures which impact longitudinal continuity (barriers, dams, locks).
53%: p. 32: 26%+24%+x%
HYMO pressures: p. 31: 40%
-
"More than half (53%) of the water bodies impacted by hydromorphological pressures are affected by physical structures which impact longitudinal continuity (barriers, dams, locks). Barriers are mainly used for hydropower, flood protection and irrigation purposes. However, for the majority of barriers reported in the second RBMPs, the driver or water use served by the barrier is unknown or even."
- We think that this is a strong assertion, therefore evidence should be given.
- Most barriers are in fact multi-purpose facilities. Originally, many barriers were built for flood protection. Their multi-purpose-use (for irrigation, navigation and other infrastructure or hydroelectrical generation) has been added afterwards.
-
"More than half (53%) of the water bodies impacted by hydromorphological pressures are affected by physical structures which impact longitudinal continuity (barriers, dams, locks). Barriers are mainly used for hydropower, flood protection and irrigation purposes. However, for the majority of barriers reported in the second RBMPs, the driver or water use served by the barrier is unknown or even."
- We think that is a strong assertion, therefore evidence should be given.
- Most barriers are in fact multi-purpose facilities. Originally, many barriers were built for flood protection. Their multi-purpose-use (for irrigation, navigation and other infrastructure or hydroelectrical generation) has been added afterwards.
-
"A major impact on a river could be caused by a single, very damaging structure or by the accumulated effects throughout the length of the river of a series of small structures, which may have only a small impact individually."
The sentence "a major impact..." sounds like having no profound knowledge base. Effects of obstacles have to be evaluated on a site-by-site basis and, therefore, such a general statement cannot be given. It is proposed to delete the sentence.
-
"Several European river basins have master plans or conservation plans for restoring the population of threatened fish species and restoring river continuity. These plans are often the basis for the RBMP measures against obstacles and transverse structures. Table 6.4 illustrates examples of measures implemented during recent years (first RBMP cycle)."
Not only threatened fish is at focus of implementation plans/measures. All migrating fish species in a certain river stretch determine the need for site-specific solutions. However, the protection of threatened fish is not duty of the WFD. Proposal: "migrating" fish instead of "threatened"
Hydromorphological pressures other than continuity interruption and examples of measures
Except for physical structures which interrupt longitudinal continuity (via barriers on the river network), humans have made many other physical changes to rivers, lakes and estuaries. Examples are changes to the size and shape of natural river channels for land drainage and navigation, modifications to beds (via either concrete or change in sedimentation/erosion), the banks and shores of water bodies. These modifications alter natural flow levels and sediment dynamics in surface water bodies and lead to the loss of habitats and recreational uses.
Almost 60 % of the water bodies which are impacted by hydromophological pressures are affected by physical alterations in the channel, bed, riparian zone or shore. The main drivers for the physical alterations reported for water bodies in the second RBMPs are flood protection and agriculture.
Restoration of bank structures, reconnection of backwaters or floodplains and wetland restoration are among the most common measures applied to achieve hydromorphological improvements. In many rivers, habitat quality at the river banks is poor due to bank fixation. Removal of bank fixation is a prerequisite for many other measures like re-meandering or widening as well as initiating later channel migration and dynamics. Also tree-planting and/or preserving riparian zones aim to reverse the impacts of land use change by improving channel stability, aquatic habitat and terrestrial biodiversity.
Especially, wetlands and the floodplains play an important role in the ecological integrity of aquatic ecosystems and they are of significant importance when it comes to ensuring/achieving good ecological status of adjacent water bodies. Wetlands/floodplains also play a significant role for flood retention. The current situation for European floodplains is critical with 95% of the original floodplain area converted to other uses. Many of the remaining European floodplains are far from pristine and have lost most of their natural functions. For example, of the former 26 000 km² of floodplain area along the Danube and its major tributaries, about 20 000 km² are isolated by levees (summary by Tockner et al, 2008).
Reconnecting backwaters, such as oxbows and side channels, and wetlands aims to restore the lateral connectivity between the main river channel, the riparian area and the wider floodplain and to re-vitalise natural processes.
Also activities for the implementation of the Floods Directive and the elaboration of the Flood Risk Management Plans can significantly contribute to the restoration of disconnected wetlands and floodplains. Table 6.5 illustrates examples of measures implemented during the last years.
Table 6.5: Examples of measures address other hydromorphological pressures.
|
River basin district or country |
Measures |
|
Rhine iRBD
|
Reactivation of floodplains from ca. 80km² in 2005 rising to ca 125 km² in 2012. Increase of structural diversity of banks from ca. 50 km bank length in 2005 to ca. 100 km bank length in 2012 Reconnection of alluvial areas from ca. 35 areas reconnected in 2005 to 80 alluvial areas reconnected in 2012. (2005-2012 – ICPR 2015). |
|
Danube iRBD |
More than 50,000 ha of wetlands/floodplains have been partly or totally reconnected, and their hydrological regime improved respectively (2009-2015 - ICPDR 2015). |
|
Austria |
Ca. 250 water body restructuring activities were carried out to improve hydromorphological conditions in the largest waters of the so-called priority restoration zones (2009-2015 - Austria national RBMP 2015) |
|
France, Rhône RBD |
Morphological restoration works carried out on more than 160 km of rivers. Wetland restoration increased from 7 332 ha restored in 2010 to 16 069 ha restored in 2015. (2010-2015 - Rhône RBD 2016) |
|
UK Scotland RBD |
Physical conditions of 36 water bodies improved out of 255 water bodies affected by modifications to their beds, banks or shores (2009-2015 Scotland 2nd RBMP) |
Source ICPR: River basin management plan 2015. Available at http://www.iksr.org/en/water-framework-directive/river-basin-management-plan-2015/index.html – Section 7.1.1 Restoration of biological river continuity, increase of habitat diversity.
ICPDR 2015; http://www.icpdr.org/main/activities-projects/river-basin-management-plan-update-2015
Austria national RBMP 2015: https://www.bmlfuw.gv.at/wasser/wisa/fachinformation/ngp/ngp-2015/text/textdokument_ngp2015.html
Rhône Mediterranée district 2016: Tableau de bord adopté par le comité de bassin du 27/05/2016. http://www.rhone-mediterranee.eaufrance.fr/gestion/sdage2016/tableau-de-bord.php
Scotland 2nd RBMP: https://www.sepa.org.uk/environment/water/river-basin-management-planning/the-current-plans/
-
BE-FLA (RV): p. 68 Almost 60 % of the water bodies which are impacted by hydromophological pressures are
p. 32: 26%
-
Text before the table 6.5 refering to flood management: Please clarify that this is only the case if flood mitigation measures are green (green infrastructure/NRWM).
Hydrological alterations including examples of measures (ecological flows)
Hydrological alterations are pressures that alter the flow regime and/or the water levels of surface and groundwater. Where water flows and levels are not in a good condition, this can affect the abundance and diversity of aquatic plants and animals by reducing the extent, quality, diversity and connectivity of aquatic habitats.
The main pressures on flows and levels are from water abstractions (for public water supply, agriculture or industry) and reservoirs used mainly for hydroelectricity generation and irrigation. Impounded river sections may also be the result of barriers on rivers, which serve uses other than hydropower. Impoundments – in addition to interrupting river/habitat continuity – alter the upstream flow conditions of rivers. A specific type of hydrological pressure related to hydropower comes from hydropeaking activities. Hydropeaking relates to hydropower generation for the provision of peak electricity supply resulting in artificial water level fluctuations.
Hydrological alterations (mainly due to hydropower) affect 17% of the surface water bodies impacted by hydromorphological pressures. One of the key measures to mitigate hydrological impacts from water abstractions or hydromorphological pressures is the establishment of ecological flows. Table 6.6 illustrates examples of ecological flow (or minimum flow) measures implemented during the last years (first RBMP).
Table 6.6: Examples of measures related to E-flows.
|
River basin district or country |
Measures |
|
Austria
|
Minimum flow was ensured for ca. 200 residual water stretches (2009-2015 – Austria 2nd RBMPs 2015). |
|
Danube iRBD |
Ecological flow requirements for the achievement of GES/GEP have already been achieved for 13 out of 144 significant water abstractions identified in the Danube international RBD (2009-2015 - ICPDR 2015) |
|
Spain |
Minimum flow was ensured for 3200 water bodies this is an increase of more than 800 water bodies since the first RBMPs (2009-2015 – Spain 2nd RBMPs 2017). |
Source: Austria national RBMP 2015: https://www.bmlfuw.gv.at/wasser/wisa/fachinformation/ngp/ngp-2015/text/textdokument_ngp2015.html
ICPDR 2015; http://www.icpdr.org/main/activities-projects/river-basin-management-plan-update-2015
Spain 2017: Summary of Spanish River Basin Management Plans. https://servicio.magrama.gob.es/es/agua/temas/planificacion-hidrologica/summaryrbmp2ndcycledraft_tcm7-448674.pdf
-
In reference to the sentence starting by "The main pressures on flows and levels are from water abstractions (...)" : A recent study (2016-2017) on water management in the aggregates sites by the European Aggregates Association (UEPG) is showing that the impact of aggregates extraction sites on the quantitative status of surface water and ground water is negligible. All the water abstractions in quarries are subject to a permit granted by river basin management bodies. Moreover, a vast majority of aggregates sites with washing processes have in place water recycling circuits and systems with very high efficiency rates minimising water consumption. Water is reused in a closed circuit and clarified before discharged (50% of aggregates sites do not make any discharge).
According with the conclusions of that study, the demand for water is decreasing thanks to water efficiency policies and techniques.
In countries with water scarcity problems the use of water is very effcient in the aggregates sector. -
In reference to: "Hydrological alterations (mainly due to hydropower) affect 17% of the surface water bodies impacted by hydromorphological pressures. One of the key measures to mitigate hydrological impacts from water abstractions or hydromorphological pressures is the establishment of ecological flows. Table 6.6 illustrates examples of ecological flow (or minimum flow) measures implemented during the last years (first RBMP)." Suitable hydromorphological parameters are taken into consideration for aggregates extraction sites into rivers to minimise any hydrological alterations. This is guaranteed by the fact that the river basin management authorities are delivering the permits. The sector is an ally of local, regional and national authorities to maintain (when necessary) the capacity of the rivers to prevent floods.
-
BE-FLA (RV): p. 70 Hydrological alterations (mainly due to hydropower) affect 17% of
p. 32: 7%
-
"The main pressures on flows and levels are from water abstractions (for public water supply, agriculture or industry) and reservoirs used mainly for hydroelectricity generation and irrigation. Impounded river sections may also be the result of barriers on rivers, which serve uses other than hydropower. Impoundments – in addition to interrupting river/habitat continuity – alter the upstream flow conditions of rivers. A specific type of hydrological pressure related to hydropower comes from hydropeaking activities. Hydropeaking relates to hydropower generation for the provision of peak electricity supply resulting in artificial water level fluctuations."
This is true. It would be nice to add something like: this peak electricity serves the security of supply and grid stability and is hereby essential for further sustainable development of the EU.
-
"Hydrological alterations (mainly due to hydropower) affect 17% of the surface water bodies impacted by hydromorphological pressures. One of the key measures to mitigate hydrological impacts from water abstractions or hydromorphological pressures is the establishment of ecological flows. Table 6.6 illustrates examples of ecological flow (or minimum flow) measures implemented during the last years (first RBMP)."
E-flows and minimum flows are not the same (fixed and variable water flows, seasonal changes, etc.).
Water abstractions
Water scarcity and droughts are an increasing problem in many areas of Europe, at least seasonally. The environment needs water to sustain aquatic ecosystems and ecosystem services. Excess water abstraction affects surface and groundwater, altering the hydrological regime and degrading ecosystems, leading to severe ecological impacts that affect biodiversity and habitats, but also the quality of water and soils (e.g. affecting temperature in water, reducing the dilution capacity for pollutants, or salt-water intrusions).
Total water abstraction decreased by around 7 % between 2002 and 2014[18]. Agriculture and public water supply are the main pressures on renewable water resources. Agriculture accounts for 36 % of total consumptive water annual use. In summer, this increases to about 60 %. The share of agriculture in EU water abstraction (24%) has wide variations: in Southern countries the share is 65% (up to 80%), mostly used for crop irrigation. In the spring of 2014, this sector used 66 % of the total water used in Europe. Around 80 % of total water abstraction for agriculture occurred in the Mediterranean region. The total irrigated area in southern Europe increased by 12 % between 2002 and 2014, but the total harvested agricultural production decreased by 36 % in the same period in this region. In 2013, the total irrigable area in the EU-27 was 18.7 million ha, representing an increase by 13.4 % compared to 2003 (Eurostat 2016[19]). The area actually irrigated in 2013 was 10.2 million ha. The highest shares of irrigable areas at country level are expectedly found in some southern Member States: in Greece and Malta shares of 44.9 % and 38.6 % were registered respectively. Cyprus, Italy and Spain followed with 34.9 %, 33.9 % and 31.1 % respectively.
Water abstractions are a key pressure on many water bodies, in particular during temporary drought phenomena or in water scarcity prone areas. Abstractions are a significant pressure for 7 % of surface water bodies in the second RBMPs with a higher regional importance in southern Europe (e.g. in Spain, Italy and France). In the case of groundwater, abstractions (mainly for agriculture and public water supply) and artificial recharge are the main pressures of groundwater bodies in poor quantitative status.
-
BE-FLA (WV-RV): p.71 §1 “In the case of groundwater, abstractions (mainly for agriculture and public water supply) and artificial recharge are the main pressures of groundwater bodies in poor quantitative status.”
Artificial recharge is not mentioned before as one of the main pressures, cf. p.52-53
Measures to reduce impact of over abstractions
In the past, European water management has largely focused on increasing supply by drilling new wells, constructing dams and reservoirs, desalination, large-scale water-transfer infrastructures, etc. However, as Europe cannot endlessly increase water supply. Demand measures could include the use of economic instruments; water loss controls; water-reuse and recycling; increased efficiency of domestic, agricultural and industrial water use; and water-saving campaigns supported by public education programs. Water savings will bring additional benefits, for example by reducing pollution discharges and energy consumption.
Water efficiency — wasting less water and increasing the productivity per volume — is essential for building resilience into our systems and adapting to climate change. Water efficiency is an economic and environmental opportunity that serves sectors and functions that use water, helps economic growth and at the same time safeguards the environment. To realise a boost in water efficiency, both technological development and improved governance for water is needed, together with monitoring methodologies such as 'environmental accounting'.
The WFD obliges Member States to implement water-pricing policies that provide adequate incentives to use water resources efficiently. Water pricing and metering together with water saving measures have been highly effective in changing consumer behavior in many countries (Text box).
Text Box: Pricing and non-pricing measures for managing water demand in Europe [20]
|
Based on a study of a set of case studies it was found that European Union water policies encourage Member States to implement better management practices. Notably, water pricing policies (levies or tariffs on water use, for example) in combination with other measures, like encouraging the use of water saving devices on shower heads or taps, or education and awareness campaigns. A mix of the two has been used across Europe with varied results. The assessment concludes that national and local water management strategies should focus on designing the most effective combination to get the best results in reducing household water consumption and improving efficient use. The demand for water continues to increase, especially for domestic consumption. Increased intensity and frequency of droughts and water scarcity were identified as the key challenges for five (Cyprus, France, Italy, Romania, and Spain) of the eight countries studied. Overexploitation of groundwater resources was also cited, as demand for water rises not only for residential and tourist sectors but also others like industry and agriculture. |
Various practices can be implemented to ensure that agriculture uses water more efficiently. These include changing the timing of irrigation so that it closely follows crop water requirements, adopting more efficient techniques such as sprinkler and drip irrigation systems, and implementing the practice of deficit irrigation; an optimization strategy in which irrigation is applied during drought-sensitive growth stages of a crop.
Leakage of water from supply systems in parts of Europe is substantial, and countries face major challenges in the construction and maintenance of water-related infrastructure. Investing in detection and repairing leaks is important.
Additional water supply infrastructures — such as water storage, water transfers or use of alternative sources — may be considered when other demand options have been exhausted. Water reuse can have two important benefits: It effectively increases the available water resources and it minimizes wastewater outflow. Treated wastewater is currently reused in some southern European countries, primarily for irrigation — crop cultivation, public gardens, parks and golf courses.
Drought management is an essential element of water resource policy and strategies. Drought Management Plans (DMP), based on the characterization of possible droughts in a basin, their effect, and possible mitigation measures, should be prepared on a river basin scale and before emergency schemes have to be applied. DMPs, by promoting sustainable water use, are closely linked with the WFD objectives.
Land management and land-use planning are essential to the management of water resources in water-scarce areas. Important wetlands, which help to store water, have been drained throughout Europe. One priority should be to retain rainwater where it falls, enabling water infiltration, through the re-establishment of wetlands and increased recharge of aquifers.
-
In reference to: " Over exploitation of groundwater resources was also cited, as demand for water rises not only for residential and tourist sectors but also others like industry and agriculture."
A recent study (2016-2017) on water management in the aggregates sites by the European Aggregates Association (UEPG) is showing that the impact of aggregates extraction sites on the quantitative status of surface water and ground water is negligible. All the water abstractions in quarries are subject to a permit granted by river basin management bodies.
Moreover, a vast majority of aggregates sites with washing processes have in place water recycling circuits and systems with very high efficiency rates minimising water consumption. Water is reused in a closed circuit and clarified before discharged (50% of aggregates sites do not make any discharge).
According with the conclusions of that study, the demand for water is decreasing thanks to water efficiency policies and techniques.It is necessary to clearly define what is meant by industry, heavy industry or mining in the report, to distinguish mining from quarrying, to avoid any mistake by an extensive interpretation to the entire extractive industry, as the nature of their activities and the properties of extracted materials are very different.
-
In reference to the paragraph starting with: "Water efficiency — wasting less water and increasing the productivity per volume (...) " .
A recent study (2016-2017) on water management in the aggregates sites by the European Aggregates Association UEPG is showing that this industry is making a relevant progress in water efficiency. The water consumption by ton of aggregates produced is quite low. The same occurs with most of the quarries for industrial minerals and rocks. All the water abstractions in quarries are subject to a permit granted by river basin management bodies. And a huge majority of aggregates sites with washing processes have in place water recycling circuits and systems with very high efficiency rates minimising water consumption. Water is reused in close circuit and clarified before discharged (50% of aggregates sites do not make any discharge). UEPG has created in 2009 a Water Management Task Force to raise technological development within the industry, as well as governance.
So when a mention to the heavy industry or to mining is made, this should be better defined to avoid any mistake by an extensive interpretation to the whole industry and the whole extractive sector. -
In reference to the paragraph starting with: "In the past, European water management has largely focused on increasing supply (...)"
A recent study (2016-2017) on water management in the aggregates sites by the European Aggregates Association (UEPG) is showing that the impact of aggregates extraction sites on the quantitative status of surface water and ground water is negligible. All the water abstractions in quarries are subject to a permit granted by river basin management bodies. Moreover, a vast majority of aggregates sites with washing processes have in place water recycling circuits and systems with very high efficiency rates minimising water consumption. Water is reused in a closed circuit and clarified before discharged (50% of aggregates sites do not make any discharge).
According with the conclusions of that study, the demand for water is decreasing thanks to water efficiency policies and techniques.
In countries with water scarcity problems the use of water is very effcient in the aggregates sector. -
BE-FLA (RV): p.71 Leakage of water from supply systems in parts of Europe is substantial, and
There exist figures on leakages.
-
"The WFD obliges Member States to implement water-pricing policies that provide adequate incentives to use water resources efficiently. Water pricing and metering together with water saving measures have been highly effective in changing consumer behavior in many countries (Text box)."
It would be important to add that this instrument applies for water services; according to ECJ, agriculture and water supply/waste water management only.
-
(AT) Text box: The demand for water continues to increase, especially for domestic consumption
As a fact of growing population? (av. Daily water consumption per inhabitant decreases e.g. in AT)
-
SK:
The material in question does not include a section specifically concerning the economy (economic analysis). The reference is only in subchapter 6.3 and very marginally in subchapter 6.5.
Subchapter 6.3 under the heading "Measures to reduce the impact of over abstractions" states that, at the time of increasing water supply requirements, along with other measures economic instruments contributing to the efficient use of water should be used (WFD Article 9 requires EU Member States to implement a pricing policy in the area of water, which provides reasonable incentives to ensure efficient water use). The paper states that water pricing policy and water metering, along with various water-saving measures, have proven to be highly effective in many countries and have had an impact on the change in behaviour of water consumers (there is a reference to eight countries but Slovakia is not included).
Slovakia has a water valuation policy based on measured water for decades. On the other hand, it has been confirmed that the increase in water prices in previous years is an effective economic tool that has led to a significant drop in water consumption, but per capita consumption of water per day has fallen to a hygienic minimum (household water consumption in 2015 was 77.3 litre per inhabitant per day), so there is no wish for further reduction in consumption.
Despite the fact that Slovakia does not suffer on water scarcity due to the rich water resources available, the droughts are obviously already present also in Slovakia and it will be necessary to count on their even more frequent occurrence in future - which is likely to have to be reflected in the pricing policy, and also in combining it with other water efficient tools (e.g. reducing water losses, wider use of water saving devices, reconstruction of obsolete irrigation facilities in agriculture, energy-saving ways of irrigating crops, etc.).
We recommend to add the text to the relevant part of the chapter in the sense that in the context of climate change appearance the intensive use of economic instruments and their combination with other instruments in the future will also concern those countries that are not currently experiencing the water scarcity.
6.4 Outlook – what will the status be in 2021, 2027 and beyond[21]
There are two options to look on the future status accessed by Member States in the second RBMPs
- First, the proportion of water bodies in at least good status in 2021, can be predicted based on the water bodies in 2015 failing to achieve good status (ecological, chemical and quantitative) and not having exemptions.
- Second, Member States have in the reporting of the second RBMPs been asked to indicate the expected time (2021, 2027 or beyond 2027) to achieve good status for water bodies failing to achieve good status in 2015.
In the following, results on the improvements expected over the second RBMP cycle and beyond are listed.
-
“First, the proportion of water bodies in at least good status in 2021, can be predicted based on the water bodies in 2015 failing to achieve good status (ecological, chemical and quantitative) and not having exemptions.” This may be confusing. Using the interpretation of exemptions approved by WD in June 2017, all water bodies failing good status need an exemption. Some MS applied exemptions in a ‘forecasting’ way and this allows water bodies failing good status with and without an exemption. The low percentage of failing and no exemptions, could be caused by the way MS applied the exemptions.
-
- First, the proportion of water bodies in at least good status in 2021, can be predicted based on the water bodies in 2015 failing to achieve good status (ecological, chemical and quantitative) and not having exemptions.
It is unclear what is meant here.
-
Refering to the proportion of water bodies: We wondered if it would also be possible to show the projection of the state of European waters based on the size/length of the water ecosystem.
Future status predicted based on water bodies without exemptions
The table below lists the proportion of all surface water bodies (SWBS) already in High/Good ecological status/potential; the numbers failing to achieve good status with or without exemptions and the water bodies with unknown status. The results show that based on SWBs with “no exemptions”, improvements in ecological status over the second RBMP cycle are expected to be limited (3.3 %).
Table: Surface water bodies in at least good status, with and without exemptions. <Similar results may be produced for chemical and quantitative status>

Source: Preliminary results based on WISE-SoW database including data from 24 Member States (EU28 except Denmark, Greece, Ireland and Lithuania). Denmark reported a small number of water bodies with exemptions but have a relative high proportion of surface water bodies with unknown status.
-
"... with or without exemptions ..." is this in line with the provisions of the WFD? If good status is not achieved, exemptions have to be applied for these water bodies. So how is possible that good status is not reached and that no exemptions are applied?
-
"High/Good (2013)" please delete "2013" in the table.
-
If Denmark has reported through the WISE database, figures should also be included in the table.
-
The numbers are surprising: Only 3% of progress on ecological status for the second RBMP but more than 50% of progress expected during the two following periods? This part should probably be moderate with realistic hypothesis.
-
<Similar results may be produced for chemical and quantitative status>
What do the brackets mean?
-
(AT) <Similar results may be produced for chemical and quantitative status>
Difficult to understand
-
SK: Page 72, Table: Add reference year in title of table.
Member States reporting expected time when water bodies will be in good status
For water bodies failing to achieve good status (in 2015), Member States have indicated in their reporting the year (2021, 2027 or beyond 2027) by when they are expected to achieve good status: The results are summarised below
- In 2015, 43 % of all surface water bodies were in high/good (H/G) ecological status. The H/G percentage is expected to increase to 64 % and 94 % in 2021 and 2027, respectively.
- For chemical status, 51 % of surface water bodies were expected to be in good status in 2015, this is expected to increase to 53 % and 77 % in 2021 and 2027, respectively. Member States have identified more than 20 % of the surface water bodies with less stringent objectives.
- In 2015, 71 % of the area of groundwater bodies were in good chemical status. The percentage is expected to increase to 94 % in 2027.
- For groundwater bodies, a high proportion (89 %) of the area of groundwater were in good quantitative status already in 2015, and in 2027 98 % are expected to be in good status.
Table: Status (ecological, chemical and quantitative) in 2015 and the proportion expected to be in good status in 2021 and 2027. All surface water bodies (by count) and groundwater bodies (weighted by area)
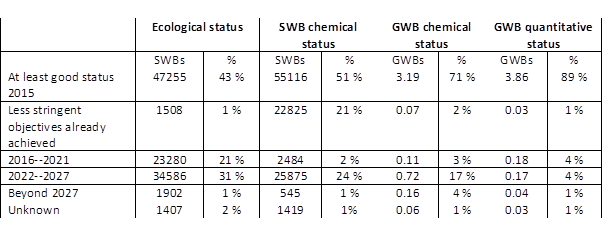
Note: GWBs area of groundwater bodies in million km2.
Source: Preliminary results based on WISE-SoW database including data from 25 Member States (EU28 except Greece, Ireland and Lithuania).
|
Further and detailed information on status in 2021, 2027 and beyond is available in WISE · Ecological status Table · Surface water chemical status Table · Groundwater chemical status Table · Groundwater quantitative status Table |
-
Although the figures and the table on page 73 are derived from the reporting by Member States the message they are giving might be biased due to the fact that under the existing WFD MS only have the option of a max. time extension for achieving the objectives until 2027 or to set less stringent objectives. Against this background an indication by MS that the objectives might not be achieved by 2027 at the latest would signal a potential breach of the WFD requirements. MS therefore certainly were avoiding such a signal irrespectively of the emerging expectation in many MS that achieving the objectives for close to all water bodies by 2027 might be unrealistic. In addition MS may have postponed decisions on less stringent objectives to a later stage due to the stringent requirements for their justification or for political reasons. The Water Directors even have started a discussion process on the need to amend the time horizons of article 4 WFD and the rules for time extensions. Against this background we would recommend to consider deleting chapter 6.4 or at least adding a comment stating that the provided figures may only give a preliminary or intermediate picture based on certain assumptions and expectations which still might be proved wrong.
-
pg. 73- Ecological status table
- for RO in the EEA table, the number for at least good status 2015 (respectively 2067 WBs) does not correspond with the RO WISE data (respectively 2066 WBs) , because the territorial (TeW) water has been included in the EEA table. Please correct the number from EEA table taking into account the RO WISE data.
-
- In 2015, 43 % of all surface water bodies were in high/good (H/G) ecological status. The H/G percentage is expected to increase to 64 % and 94 % in 2021 and 2027, respectively.
95% instead of 94%. However, it is stated in the outlook chapter that the share of surface water bodies with high and good ecological status is expected to increase to 64 % and 94 % in 2021 and 2027, respectively. This does not seem plausible in face of the ongoing need to designate HMWB in many water bodies which have a target of good ecological potential. This should be clarified.
-
“For chemical status, 51 % of surface water bodies were expected to be in good status in 2015, this is expected to increase to 53 % and 77 % in 2021 and 2027, respectively. Member States have identified more than 20 % of the surface water bodies with less stringent objectives. “
In the revised priority substance directive there are new substances introduced with objective to achieve good status later. In the Directive the newly identified substances numbered 34 to 45 in Part A of Annex I, with effect from 22 December 2018, with the aim of achieving good surface water chemical status in relation to those substances by 22 December 2027 and preventing deterioration in the chemical status of surface water bodies in relation to those substances. For this purpose, Member States shall, by 22 December 2018, establish and submit to the Commission a supplementary monitoring programme and a preliminary programme of measures covering those substances. A final programme of measures in accordance with Article 11 of Directive 2000/60/EC shall be established by 22 December 2021 and shall be implemented and made fully operational as soon as possible after that date and not later than 22 December 2024.
For these substances the final date to achieve the good status is 27 + 12 -> year 2039.
-
SE: The summarised results at page 73 need some explanation or comment. According to the text the expected percentage of groundwater area in good chemical status will increase from 71% in 2015 to 94% in 2027. At the same time it is stated at page 48 that ”the total groundwater area with identified upward trend (9.9 % of groundwater area) is nearly double the area with a trend reversal (5.9% of groundwater area). And it is also (correctly) stated in the report that groundwater systems are slow to recover once pressures are reduced (p 18). These seemingly contradicting results may need some further elaboration. Could there be the case that, for instance, Member states will ensure that measures may be in place in 2027 with relevant exemptions where needed, but good status for 94% of groundwater area may take longer?Member states have been uncertain about the possibilities to use different types of exemptions beyond 2027 and that this is reflected in the estimations of recovery to good status, or other reasons?
6.5 Integrated water management
Water is an essential resource for human health, agriculture, energy production, transport and nature, but securing sustainable management of water and of aquatic and water dependent ecosystems and securing that enough water of high quality is available for all purposes, remains a key challenge within Europe and in our time.
The results from the second RBMPs show that European waters remain under multiple pressures from water pollution, over-abstraction and structural change from multiple sectors and human activities. These pressures affect the good functioning of water-related ecosystems, contribute to biodiversity loss, and threaten the long-term delivery of ecosystem services and benefits to society and the economy. To ensure sustainable management of water resources, further policy action will be needed to improve the coherence between economic, societal and environmental goals.
Several European policies are in place in support of the EU Water Framework Directive, which together with the Floods Directive, Groundwater Directive, Environmental Quality Standards Directive, Urban Waste Water Treatment Directive, Groundwater Directive, and Nitrates Directive provides powerful and essential tools for managing water quality in the European Union.
Sustainable and integrated water management plays a substantial role in the UN 2030 Agenda for Sustainable Development, the European Union's (EU) 7th Environment Action Programme (7th EAP)[22], and the achievement of the EU’s Biodiversity Strategy[23]. Based on the review of the first RBMPs, the 'Blueprint to safeguard Europe's water resources'[24] has called for increased implementation of integrated water management in Europe. Three areas offering substantial opportunities to improve implementation and support to the achievement of WFD objectives are highlighted below.
-
though it is mentioned in the foot note, the correct name of the BD 2020 is "Eu Biodiversitystrategy to 2020" we would recomend adding that also in the corresponding text in the ex.Sum
-
BE-WAL (EC): p. 74 §3
2 X Groundwater Directive
-
SK: Page 74, 3rd paragraph: Bathing Water Directive should be mentioned too in this paragraph too.
-
Second paragraph, last sentence: It is not clear which policy actions you are suggesting to be taken (statement is too general). As a minimum please specify the full implementation of the WFD.
Protection of Europe's aquatic ecosystems and their services
Many opportunities exist for improving implementation and maximizing synergies between environmental policies relevant for the protection of the water environment. In particular, EU policies on water and the marine environment, nature and biodiversity are closely linked, and together they form the backbone of environmental protection of Europe's ecosystems and their services.
The nature directives (Birds (2009/147/EC) and Habitats (92/43/EEC))[25], the Biodiversity Strategy 2020, the Marine Framework Strategy Directive and the Water Framework Directive aim at ensuring healthy aquatic ecosystems, while at the same time ensuring a balance between water and nature protection and the sustainable use of natural resources. The implementation and knowledge generation via the directives partly run in parallel, and not enough coordination between the processes exist[26]. There is thus much scope for more integration concerning monitoring, objectives and targets, and planning processes.
The use of management concepts such as the ecosystem services approach and ecosystem based management can offer ways to improve coordination by setting a more common language and framework to evaluate trade-offs between the multiple benefits that healthy water bodies offer[27], [28].
-
good point on the first para.
In the second para you then point out rightly the deficits we have currently between the 3 big directives.
for the future we see a good potential to make some assessments integrating data and information from the nature directives (conservation status, trends of species/habitats, pressures and threats, Natura 2000), the IAS regulation (in the near future) and the status and pressures from the WFD. However, this would require a specific work/project, but we could acknowledge these aspects here in a form of outlook.
Therefore we We would suggest to slightly reformulate and expand:
e.g.: ".... are not enough coordinated though some guidance has been formulated for the practical and coordinated implementation of the WFD aside e.g. the Nature directives (several Natura 2000 guidance papers [cit.] and a FQA paper[cit]). there is however much more scope for integration concerning monitoring, objectives and targets as well as in the planning processes on national as well as on RBMP or protected area level. Regarding the EU-level assessment there is a potential to make some assessments integrating data and information from the nature directives (conservation status, trends of species/habitats, pressures and threats, Natura 2000), the IAS regulation and the status and pressures from the WFD, e.g. with the information from the upcoming reporting cycle of the nature directives and the new IAS regulation."
regarding the 3rd para:
we would propose to reformulate. "...............to evaluate trade-offs between the multiple benefits that healthy water bodies offer" into “….to evaluate multiple benefits that healthy water bodies offer and outline synergies and trade-offs in management and related policies….”
Restoring degraded water ecosystems
Until the last 20 to 30 years, the focus of physical water management in many parts of Europe was on providing flood protection, facilitating navigation, and ensuring the drainage of agricultural land and urban areas.
Nowadays, water management increasingly includes ecological concerns, working with natural processes. This is in line with the objective of the 7th EAA 'to protect, conserve and enhance the Union's natural capital'. It is also consistent with Target 2 of the EU's Biodiversity Strategy that aims to ensure maintenance of ecosystems and their services by establishing green infrastructure and restoring at least 15% of degraded ecosystems by 2020. This target means that degraded aquatic ecosystems must also be restored. Synergies between policies can be important in restoring aquatic ecosystems.
Restoring aquatic ecosystems such as 'making room for the river', river restoration or floodplain rehabilitation, 'coastal zone restoration projects' and integrated coastal zone management has multiple benefits for the water ecosystems. The EU-wide Green Infrastructure Strategy[29] includes rivers and floodplains as important elements. The strategy aims to reconnect existing nature areas and improve the overall quality of ecosystems. It also includes Natural Water Retention Measures (NWRMs)[30] that aim to increase soil and landscape water retention and groundwater recharge.
-
its 7th EAP not EAA.
regarding synergies and our comments I would say in the last sentence: "The above mentioned integration between policies can be important in restoring aquatic ecosystems ".
in the next para it would be nice if you could cite EEA report 14/2017 e.g. saying at the end of the para: "nature based solutions and respective measures can not only help restoration, but can also have clear co-benefits by promoting cost-efficient flood risk reduction via green infrastructure solutions [cit 14/2017] "
-
it might be worthwhile to explore an additional paragraph on wetlands and their restoration also outside the floodplain issue.
I am also missing our recurring argument on small water bodies. sure, we said it before, but it is still an issue, I think. you might want to add that here or in connection with the coordination between WFD and Nature directives. maybe here it would be factual, related to the functionality of small water bodies, less understood a s a deficit of the WFD.
-
SK: Page 75, 3rd paragraph: Probably, there should be mentioned 7th EAP (Environmental Action Programme) instead of „7th EEA“.
Integration of water aspects into sector policies[31]
To meet the objectives of the WFD i.e. all water bodies to have good status, river basin authorities will have to address the pressures affecting water bodies. Managing water in a green economy means using water in a sustainable way in all sectors and ensuring that ecosystems have the quantity and quality of water needed to function. It also means fostering a more integrated and ecosystem based approach involving all relevant economic sectors and society.
Recent policy reviews[32] have shown that there is still much scope to further mainstream environmental policy actions into sectoral policies such as the agriculture, energy, transport and other sectors in order to reduce the driving forces leading to aquatic biodiversity loss. This integration throughout the river basin is enhanced by, for example, public participation and stakeholder involvement.
-
Please add:
In chemical aspects should be strengthened the link between the WFD and the substance legislation for a better information exchange.
-
In this section it would be useful to also point out that integration should lead to preventing deterioration of freshwater ecosystems as that is cheaper than subsequent restoration in case the waters are already deteriorated.
Agricultural production has become increasingly intensive with high inputs of fertilisers and pesticides, leading to high pollutant loads to the water environment. In northern Europe, many lowland agricultural streams were straightened, deepened and widened to facilitate land drainage and to prevent local flooding. Water storage and abstraction for irrigated agriculture have changed the flow regime of many river basins and lowered groundwater levels, particularly in southern Europe. To achieve good status, it will be essential to address agricultural pressures, while maximising the beneficial effects of good land management.
It is recognized that poorly planned and managed forests can exert a pressure on the water environment. Environmental problems can arise if woodland is poorly managed or planted in unsuitable locations. Well planned and managed forest can be of significant benefit to the local and global environment and may play an active role in rehabilitating degraded and contaminated land, act as a sink for or protect against potential sources of diffuse pollutants and, arguably, reduce flood risk.
Some activities related to energy production such as hydropower, use of cooling water and growing energy crops result in pressures on water management.
<This section will be further updated based on results from Commissions WFD implementation reports>
-
in the Para on managed forests we propose to explain why managed forests could exert pressures on water ecosystems….
-
It is unclear why hydropower is underlined as it is only one out of several energy/electricity generating technologies. The last sentence is very strange to read because one very new possible pressure maker is introduced: energy crops. Energy crops might be used to generate electricity and also to produce heat (CHP). Sector coupling will increase significantly in EU' energy future and hereby need of all forms of flexibility. A profound discussion on all energy issues is necessary but takes time. The report/ this part should not be ended like this.
-
The last part of the report is full of generalities and statements which are not really linked to the data on the status. It opens the discussion on interesting subjects for the future of the WFD but which are not deducted from the report itself. Some affirmations are quite discouraging (idem to 6.3) as they could have been written 20 years ago when the WFD was adopted.
-
We suggest that political issues about policy integration, integrated water management etc. should stay open for discussion through the upcoming European consultation of the WFD involving all stakeholders.
-
BE-WAL (EC): p. 76 §2
What is the source of the 1st sentence?
[1] Surface water ecological and chemical status; and groundwater chemical and quantitative status.
[2] http://ec.europa.eu/environment/water/water-framework/impl_reports.htm
[3] http://ec.europa.eu/environment/water/water-framework/impl_reports.htm
[4] https://www.eea.europa.eu//publications/european-bathing-water-quality-2015
[5] https://www.eea.europa.eu/publications/european-bathing-water-quality-in-2016
[6] EEA, 2016, European water policies and human health — Combining reported environmental information, European Environment Agency (https://www.eea.europa.eu/publications/public-health-and-environmental-protection).
[7] CSI024 https://www.eea.europa.eu/data-and-maps/indicators/urban-waste-water-treatment/urban-waste-water-treatment-assessment-4
[8] Not including water bodies affected by atmospheric deposition.
[9] https://tableau.discomap.eea.europa.eu/t/Wateronline/views/WISE_SOW_PressuresImpacts/SWB_Pressures/kristensen@eea.dmz1/SWdiffusesourcepressures?:embed=y&:showAppBanner=false&:showShareOptions=true&:display_count=no&:showVizHome=no
[10] Ibisch, R., Austnes, K., Borchardt, D., Boteler, B., Leujak, W., Lukat, E., Rouillard, J., Schmedtje, U., Lyche Solheim, A., Westphal, K. (2016). European assessment of eutrophication abatement across land-based sources, inland and coastal waters. European topic centre on inland, coastal and marine waters, European Environment Agency.
[11] EC. 2009: CIS guidance N° 23 - Eutrophication Assessment in the Context of European Water Policies https://circabc.europa.eu/sd/a/9060bdb4-8b66-439e-a9b0-a5cfd8db2217/Guidance_document_23_Eutrophication.pdf.
[12] EC 2016: CAP monitoring and evaluation indicators 2014-2020, Cap Context indicators. Water quality https://ec.europa.eu/agriculture/cap-indicators/context_en
[13] Eurostat Gross Nitrogen Balance indicator http://ec.europa.eu/eurostat/statistics-explained/index.php/Agri-environmental_indicator_-_gross_nitrogen_balance
[14] EC, 2013: COM/2013/0683final.
[15] EC 2015; http://eur-lex.europa.eu/legal-content/EN/TXT/PDF/?uri=CELEX:52015DC0120&from=EN
[16] E.g. https://www.ellenmacarthurfoundation.org/assets/downloads/New-Plastics-Economy_Catalysing-Action_13-1-17.pdf
[17] Directive 2009/128/EC of the European Parliament and of the Council of 21 October 2009 establishing a framework for Community action to achieve the sustainable use of pesticides. OJ L 309, 24.11.2009
[18] https://www.eea.europa.eu/data-and-maps/indicators/use-of-freshwater-resources-2/assessment-2
[19] Agriculture, forestry and fishery statistics — 2016 edition http://ec.europa.eu/eurostat/documents/3217494/7777899/KS-FK-16-001-EN-N.pdf/cae3c56f-53e2-404a-9e9e-fb5f57ab49e3
[20] Dige, G., De Paoli, G., Agenais, A.L., Strosser, P., Anzaldua, G., Rouillard, J., Tröltzsch, Hinzmann, M. (2016). Pricing and non-pricing measures for managing water demand in Europe. Report for the European Environment Agency.
[21] Section to be drafted in coordination with DG ENV and partly based on Compliance assessment
[22] EC (2014), The 7th Environment Action Programme (EAP). http://ec.europa.eu/environment/action-programme/
[23] EC, DG Environment (2012), EU Biodiversity Strategy to 2020 — towards implementation. http://ec.europa.eu/environment/nature/biodiversity/strategy/index_en.htm
[24] EC, DG Environment (2012), Blueprint to safeguard Europe's water resources. http://ec.europa.eu/environment/water/blueprint/index_en.htm
[25] http://ec.europa.eu/environment/nature/legislation/index_en.htm
[26] CIS (Common Implementation Strategy) 2015. A starter’s guide: Overview on the main provisions of the Birds and Habitats Directives, the Water Framework Directive and the Marine Strategy Framework Directive: similarities and differences. November 2015. Available on CIRCABC.
[27] Blackstock, KL, Martin-Ortega, J & Spray, CJ 2015, Implementation of the European Water Framework Directive: what does taking an ecosystem services-based approach add? in J Martin-Ortega, RC Ferrier, IJ Gordon & S Khan (eds), Water ecosystem services: a global perspective. International Hydrology Series, Cambridge University Press, Cambridge, pp. 57-64, Launch of UNESCO CUP Publication, Edinburgh, United Kingdom, 27 May.
[28] Rouillard, J., Lago, M., Abhold, K., Roeschel, L., Kafyeke, T., Klimmek, H. and Mattheiß, V., 2016. “Synergies and Differences between Biodiversity, Nature, Water and Marine Environment EU Policies: Aquacross Deliverable 2.1 http://aquacross.eu/outputs
[29] EC, DG Environment (2013), Strategy on green infrastructure. http://ec.europa.eu/environment/nature/ecosystems/index_en.htm
[30] EC, DG Environment (2013), Natural water retention measures. http://ec.europa.eu/environment/water/adaptation/ecosystemstorage.htm
[31] EEA SOER2015 Hydrological systems briefing https://www.eea.europa.eu/soer-2015/europe/hydrological-systems
[32] Rouillard, J., Lago, M., Abhold, K., Roeschel, L., Kafyeke, T., Klimmek, H. and Mattheiß, V., 2016. “Synergies and Differences between Biodiversity, Nature, Water and Marine Environment EU Policies: Deliverable 2.1 Aquacross Deliverable 2.1 http://aquacross.eu/outputs
-
BE-WAL (EC): p. 75 ref 58 (32)
Idem ref 54 (28)
Please take into account our comments from the 'Executive Summary' chapter. They apply for this part as well (as there is alot of repetition).