
Post a comment on the text below
Improvements in monitoring and assessment
The data reported for the second RBMPs shows that the quantity and quality of available evidence on status and pressures has grown significantly due to significant investments into monitoring and assessment. This has resulted in markedly improved RBMPs providing a better understanding of the status (ecological, chemical and quantitative status), the pressures causing failure to achieve good status, and the needed measures.
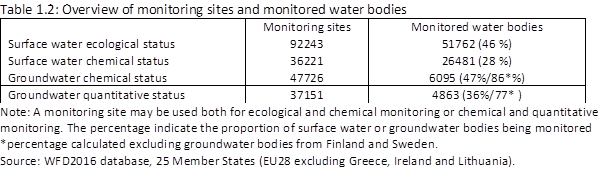
Surface waters and groundwater have been monitored at over 130 000 monitoring sites over the past six years (Table 1.2). The number of surface water monitoring sites, quality elements and pollutants assessed have increased relative to the first management cycle (see following status chapters).
There is a marked reduction in unknowns and improved confidence in assessment in the second RBMPs. For surface water bodies the proportion in unknown ecological status and chemical status fell from 16 % to 4 % and from 39 % to 16 %, respectively, while for groundwater bodies, the proportion in unknown chemical status and quantitative status decreased to only 1 %.
The confidence in the status assessments[10] has also improved. In the first RBMPs Member States reported fewer than one third of surface water bodies' ecological status with high or medium confidence, while in the second RBMPs this has improved to half of the water bodies. The confidence in surface water body chemical status is relatively low compared to the other status assessments, with only 41 % of the water bodies in the second RBMPs having high or medium confidence. The confidence in groundwater chemical and quantitative status assessments is good with two thirds of the water bodies having high or medium confidence.
Higher confidence is also ensured through intercalibration[11] of ecological status with the number of intercalibrated biological assessment methods that has generally increased three-fold since 2008 making results much more comparable than for the first RBMPs (see chapter 2).
|
Further and detailed information on monitoring and assessment is available in WISE: · Overview of monitoring statistics – (Table & maps) · Ecological status - Monitoring sites Tables* & Monitored water bodies Tables* & percentage of classified water bodies using different quality elements. (missing – see Figure 2.1) · Quality elements – monitored, grouping or expert judgement Table* - Graph* · RBSPs (pollutants monitored, threshold values) (missing) · SWB Chemical status - (2nd RBMP) Monitoring sites, by purposeMS*, CategoryPurposeEU*, categoryPurposeMS* (2nd RBMP) Monitored water bodies purposeMS*, CategoryPurposeEU*, categoryPurposeMS* · Groundwater monitoring (missing) · Surface water bodies: unknown ecological status and unknown chemical status · Groundwater unknown GW chemical status and GW quantitative status · Confidence in: ecological status assessment Table and Graph*; SWB chemical status assessment Table and Graph*; GW chemical status assessment Table and Graph* and GW quantitative status assessment Table and Graph* · CIS Guidance Document on monitoring: No. 7: Monitoring; No. 15 Groundwater monitoring; No 19 - Surface water chemical monitoring; and No 25 - Chemical Monitoring of Sediment and Biota Link |
* draft dashboards;
You cannot post comments to this consultation because you are not authenticated. Please log in.
Previous comments
Please define what you consider to be unknown: “Surface water bodies: unknown ecological status and unknown chemical status”. What if not all but only a x% of the chemicals have been assessed in a water body? What if no biological q.e. (and only one/more supporting elements) has been assessed for the ecological status? This in relation to the statement on p. 13. “and requires that all biological elements and supporting quality elements achieve at least good status.”, suggesting that good status can only be assigned when all biological elements have been assessed (which is of course not the same as ‘monitored’). At p. 21, it is concluded: “On a European scale, around 40 % of the surface water bodies are in good or high ecological status,.. ”. Does that mean that in at least around 40 % of the surface water bodies all biological elements and supporting quality elements are assessed?
BE-FLA (VVDL): p. 17 Improvements in monitoring and assessment
BE agrees with the comment made by NL.
BE-FLA (KB-VVDL): p. 17, footnote #14 Confidence according to Guidance
See reporting guidance
Confidence ecological data : Low = no monitoring data; Medium = supporting QE data and/or limited data on one BQE; High = good data for at least one BQE and the most relevant supporting QE.
Confidence chemical data : Low = no monitoring data; Medium = limited or insufficiently robust monitoring data for some or all Priority Substances that are discharged in the RBD; High = good data for all Priority Substances that are discharged in the RBD.
Please, explain ‘confidence’ in the report.
What is a monitoring site in this context? One that is reported as an etablished monitoring site or as a water body where data has been reported from. Please specify.
please see reporting guidance - in terms of the confidence of ecological data the following are indicated : Low; Medium,High and "0" (which means No information).
So the option Unknown has not been provided in the guidance document.
"There is a marked reduction in unknowns and improved confidence in assessment..."
Due to unclear basic knowledge of the ecological status, many problems cannot be addressed with best-fitting measures. It is important not to set obligations for implementing measures in cases without any profound data/knowledge.
"The confidence in the status assessments has also improved."
Whose confidence? Benchmarking?
Regarding the Ecological status - Monitoring sites tables, there are differences between figures from Romania WISE database and EEA Report: No mon sites MS, No monSites cat_MS (only for RW), No mon WBs MS, No mon WBs_MS_Cat (only for RW).
The same comments for SWB Chemical status - (2nd RBMP) Monitoring sites tables: SWB chemMon -2nd RBMP no of monitoring sites, SWB chemMon -2nd RBMP no of WB, SWB chemMon -2nd RBMP category no of monitoring sites (only for RW), SWB chemMon WBs -2nd RBMP no of WB (only for RW).
BE-WAL (EC) p. 17 ref14
Remind in the charts for a better understanding “Low= no monitoring data; Medium = limited or insufficiently robust monitoring data; and High = good monitoring data and good understanding of the system”
CZ: Table 1.2: Make more clear reason for exclusion of SE and FI GWBs i.e. large number of very small GWBs compare to the rest of EU.
Second paragraph, 'over 130 000 monitoring sites...': It would be good for the reader to indicate whether this is a lot or not enough; similarly as % in the table below.