
Table of contents
- General guidance
- General comments
- Acknowledgements
- Executive summary
- 1 Introduction
- 2 Policy context of water resources management in Eastern Partnership countries
- 3 Renewable water resources
- 4 Sectoral pressures on freshwater resources
- 5 Access to safe drinking water
- 6 Water quality
- 7 Outlook
- Reference List
4 Sectoral pressures on freshwater resources
4.1 Water abstraction by source
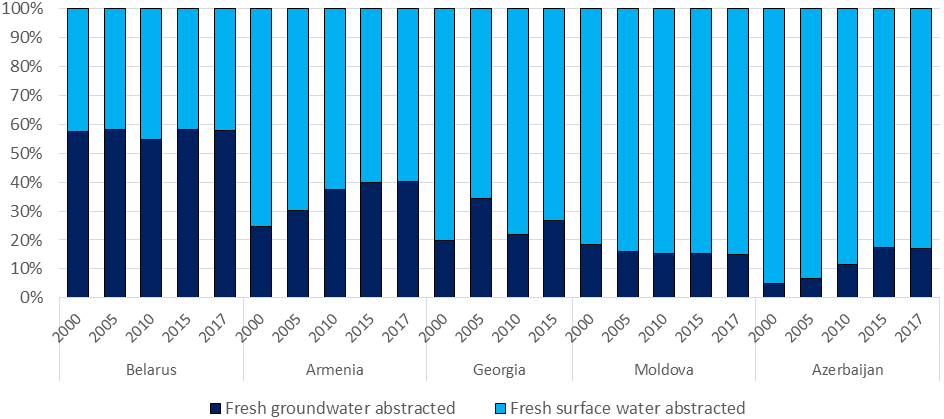
Water is an essential natural resource for human beings and economic development. Overall, surface waters meet the largest portion of water demand in the Eastern Partnership countries, while groundwater resources are the main source of water abstraction in Belarus and Republic of Moldova (Figure 6). Agriculture, public water supply and industry are the major sectors demanding water in the region.
Figure 6: Water abstraction by source (2017)
Data source: Azerbaijan: Az STAT (State Statistical Committee of the Republic of Azerbaijan); Armenia: ArmStatBank (Statistical Committee of the Republic of Armenia); Belarus: Belstat (National Statistical Committee of the Republic of Belarus); Georgia: Water Division of the Department of Environment and Climate Change and the Integrated Management Division of the Department of Environmental Assessment - Ministry of Environmental Protection and Agriculture; Moldova: Statistica Moldovei (Statistical Databank of the National Bureau of Statistics of the Republic of Moldova) and Agency Apele Moldovei.
Note: Data provided to the European Environment Agency under the ENI SEIS II East Project.
Due to an economic recession and the introduction of water metering in the second half of the 2000s the total water abstraction in Belarus has decreased significantly in recent years (UNECE, 2016b). The annual average total freshwater abstraction is around 1 650 million m3 , of which more than half is abstracted from groundwater resources and used mainly for drinking purposes. Long-term intensive groundwater abstraction has already caused large-scale water level reductions, and reduced flows of small rivers around the city of Minsk. As a policy response to the environmental consequences of intensive groundwater abstraction, the Government of the Republic of Belarus developed a strategy on environmental protection. They plan to reduce groundwater abstraction to 700-750 hm3 per year by 2025. The current level of annual groundwater abstraction is currently around 800 million m3 in the country
In Armenia, around 65 % of the total water demand is met by surface water resources, for which Lake Sevan is the main source. High water demand on Lake Sevan places continuous pressure on hydrological and ecological condition of the Lake. Meanwhile, Armenia had a remarkable increase in gross agricultural productivity (61 % increase between 2008-2018), at a cost of using a tremendous amount of phosphate fertilisers (almost 75 times more in 2015 compared to 2008) which caused increasing phosphate concentrations in rivers (More information in Chapter 6). Since then, pumping water from groundwater resources has been seen as a viable option, with 41 % increase of water abstraction for agriculture and drinking purposes. Similarly, poor treatment of urban discharge exacerbates the deterioration of the surface water quality and intensifies the pressures on groundwater resources, particularly in downstream areas of urban settlements. In parallel to increasing trends in water abstraction from groundwater, water irrigation in Armenia has also increased by 21 % between 2011-2018 (Statistical Committee of the Republic of Armenia, 2020a).
Georgia meets 70 % of its water demand from surface waters, particularly from rivers. Groundwater is mainly used for drinking water purposes. River basins to the Black Sea generates 75 % of the total inland surface water (42 500 million m3/year), while the remaining 25 % of the total inland surface water is generated in the Caspian Sea basin (14 400 million m3/year). Between 1981-1991, an average of 35 000 million m3 of water flowed out of Georgian territory into the sea each year (corresponding to 75 % of the total outflow), and 10 000 million m3 (25 %) flowed into neighbouring countries. The current state of water supply and demand in Georgia is unknown because of the lack of sufficient data. As Georgia is a water abundant country, withdrawing water from surface water resources seems more economically viable than pumping groundwater. However, high rates of water loss in the conveyance system (see Chapter 5) exacerbates the environmental impacts of inefficient water use. Abstraction from surface water for agriculture has more than doubled in Georgia since 2003 (UNECE, 2016c). The leaching of nutrients from agricultural areas causes increased concentrations of nitrates, phosphates and ammonia in the waters (See Chapter 6).
Moldova meets 85 % of its annual water demands from surface waters, especially from the Dniester river. The Dniester basin is also a very important source of groundwater abstraction. Around 84 % of total water abstraction from groundwater occurs from the Dniester basin. However, as abstraction by individuals is not monitored in the country, this is unlikely to be the true level of overall abstraction.
Azerbaijan, on average, abstracts 11 000 million m3 of water annually to meet the water demand of various economic activities, of which 83 % is met from surface waters. The Kura and Aras are large rivers flowing into Azerbaijan that play a significant role in the overall water balance of the country. In addition, Azerbaijan has 63 reservoirs, of which only four have a volume larger than 1 000 million m3. The Mingeçevir reservoir on the Kura river is the largest, with a capacity of 15 700 million m3, from which water is used for power generation and irrigation. The Samur river plays an important role in providing drinking water supplies and irrigation in north-eastern Azerbaijan and the Absheron peninsula, via the Samur-Absheron channel (UNECE, 2011b).
Azerbaijan is facing water scarcity conditions throughout the year, not only in quantitative terms, but also in terms of water quality. In order to meet increasing water demands from agriculture and drinking purposes, Azerbaijan began to abstract more groundwater. The country abstracted around four times more water from groundwater resources in 2017, compared to 2000, which creates environmental problems including aquifer depletion and contamination and landslide triggering (Israfilov et al., 2014). Pressures on groundwater will increase if the current trend of water abstraction continues in the country.
4.2 Water use by sectors
All economic sectors need water for their activities; agriculture, industry and most forms of energy production are not viable if water is not available (EEA, 2012b).
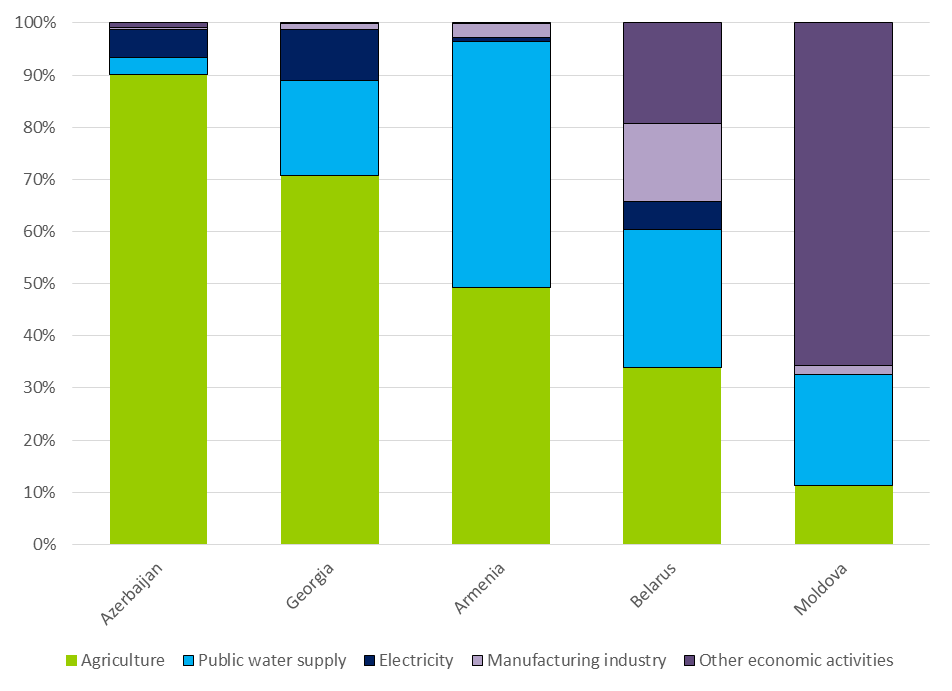
Agriculture and public water supply are the major sectors in the region, placing significant water demand on renewable freshwater resources. In Belarus and Moldova, agriculture, public water supply and other industries account for the largest portion of the water abstraction (Figure 7).
Figure 7: Water use by economic sectors (2017)
Data source: Azerbaijan: Az STAT (State Statistical Committee of the Republic of Azerbaijan); Armenia: ArmStatBank (Statistical Committee of the Republic of Armenia; Belarus: Belstat (National Statistical Committee of the Republic of Belarus); Georgia: Water Division of the Department of Environment and Climate Change and the Integrated Management Division of the Department of Environmental Assessment - Ministry of Environmental Protection and Agriculture; Moldova: Statistica Moldovei (Statistical Databank of the National Bureau of Statistics of the Republic of Moldova) and Agency Apele Moldovei.
Note: Data for Georgia 2016. Data provided to the European Environment Agency under the ENI SEIS II East Project.
In Azerbaijan, agricultural irrigation is the most significant demand on water resources and accounts for 90 % of total water use every year. Water abstraction for agriculture has increased by 76.5 % between 2001-2017. Water conveyance efficiency lowered dramatically during that period. In 2000, there was 8 050 m3/ha of water abstraction used for irrigation, whereas in 2018, this figure had increased to 14 000 m3/ha (The State Statistical Committee of the Republic of Azerbaijan, 2019). In parallel to water scarcity conditions in the country, environmental sanitation problems (The State Statistical Committee of the Republic of Azerbaijan, 2019) – due to return water from agriculture – have been experienced in small towns (Asian Development Bank, 2005). The use of fertilisers in agriculture caused increasing ammonium concentrations in rivers between 2009-2014, with the highest concentrations found in Gazakh-Ganja (see Chapter 6). The Asian Development Bank (2005) estimated there are 66 000 km of canals transporting water from surface water resources to the agricultural fields in the Kura and Aras basins, of which less than 4 % had been lined in 2005.
In Georgia, around 70 % of total water resources are used by agriculture. Irrigation is common in crop production, and accounted for 34 % of total water use in 2016. After the collapse of the Soviet Union in 1991, the abandonment of many agricultural and industrial areas resulted in a substantial decrease in water abstraction between 1990-1995 (UNECE, 2016d). In particular, the collapse of industry after the Soviet era, as well as the transition from state-owned farms to privately owned farms, resulted in a substantial decrease in water abstraction for manufacturing industries and agriculture. Since 2000, total water use in Georgia has more than doubled (1 834 million m3 in 2016) largely due to agriculture. Water abstraction and the demand for water use are projected to increase in Georgia in the years to come, while agriculture is expected to remain as the main sectoral pressure on renewable water resources (UNECE, 2016d).
As in the other Eastern Partnership countries, Armenia is an agriculturally dominant country. Gross agricultural productivity in the country has increased significantly over the last decade (61 %), employing around 8 % of the total rural population. In 2018, agriculture was the largest sector with the highest demand for water abstraction (49 %) followed by public water supply (47 %) (Statistical Committee of the Republic of Armenia, 2020b).
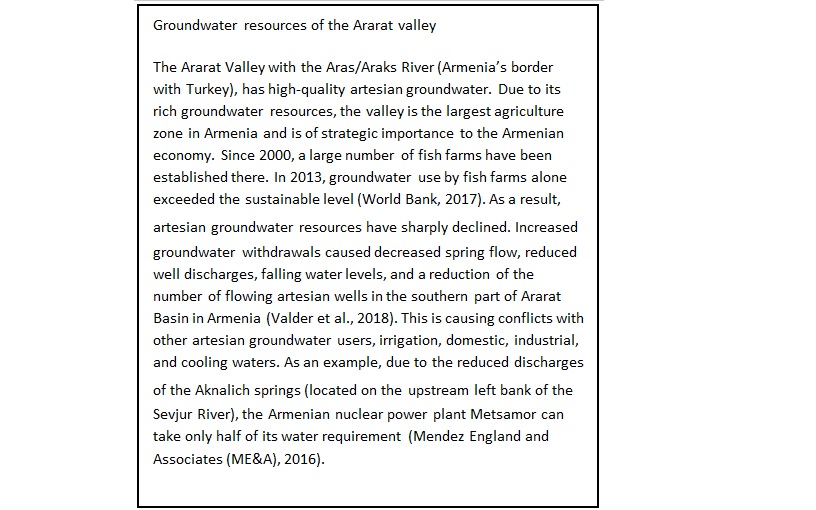
Around 50 % of the total arable land in Armenia is irrigated (UNECE, 2000). In addition, Armenia uses large amount of water for aquaculture (fish farms) which accounts for 13 % of total water abstraction. Fish farms are mainly located in the Ararat Valley, which is under high water stress conditions. In order to meet the valley’s high water demands, water is transferred from other basins, such as Lake Sevan. Since the 1930s, the water level of Lake Sevan has reduced by more than 19 m, and there has been a 26 % increase in water use. Since 1981, water has been transferred to the Lake Sevan from the Arpa River to increase the lake’s water level back again. However, water abstraction from the lake for irrigation and energy generation is still increasing and the water level of the lake Sevan has not recovered to its natural state. Overall, the total population of Armenia declined from 3 226 million in 2000 to 2 986 million in 2017, whereas total freshwater abstraction increased by 32 % over the same period (Statistical Committee of the Republic of Armenia, 2020a).
In Belarus, the sectors which use significant amounts of the country’s water resources are agriculture, forestry and fishing, and public water supply. The annual average water abstraction for these sectors together accounts for 60 % of the total water use in the country. Agriculture, forestry and fishing is traditionally a sector that uses a large amount of water in the country: two-thirds of the volume of water it uses is consumed by the fishing and aquaculture sub-sector. The public water supply is the main sector that provides water for the population. The coverage of the households served by a centralised water supply system has reached 94.7 %.
In Moldova, available data is not sufficient to assess the actual level of pressure from individual economic sectors. In 2017, the heating and hot water supply sector was the main user of water (66 %), followed by the water supply industry (20 %) and agriculture (11 %). These shares have largely stayed steady since 2000. In the coming years, it is expected that water abstraction for agriculture will increase because of policy reforms in the agriculture sector, which is the main income generator in the country’s economy (UNECE, 2014a).
4.3 Water use efficiency
Water use efficiency (WUE) is the ratio between effective water use and actual water abstraction (FAO, 2019). The WUE indicator characterises the efficiency of water use in a region. The efficiency of water use, can be measured either per sector (e.g. water use efficiency in irrigation) or through the efficiency of conveyance systems.
Efficiency in water use can be increased by decreasing water inputs per unit of production through technological improvements, the implementation of the integrated water management measures or improvements in transport of water from the point of abstraction to the point of water supply – the so-called conveyance efficiency.
4.3.1 Water losses during transport (conveyance efficiency)
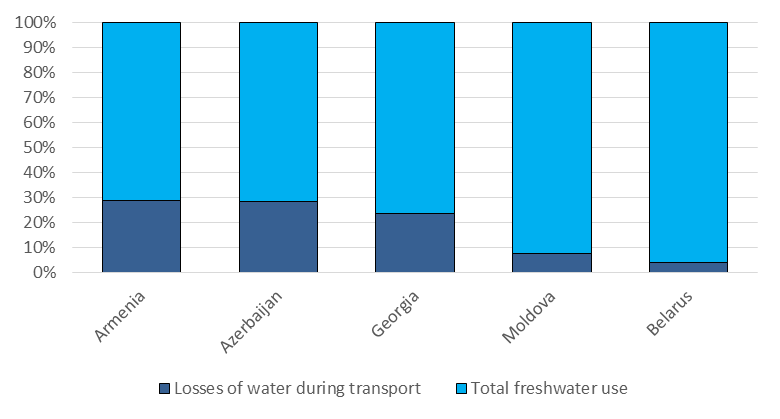
Water losses occur mainly in the transport – or conveyance – of water from its source to agriculture or public water supply systems. The total conveyance efficiency is measured as ratio between total freshwater use and water losses during the transport to all economic sectors, also known as ‘losses of water during transport’.
In agricultural systems, field application efficiency is measured as the proportion of abstracted water that is delivered to the field (EEA, 2012b). However, there is no data available for assessing this additional efficiency indicator.
The total water losses and leakages are relative higher in Armenia and Azerbaijan compared to other countries in the region (Figure 8).
Figure 8: Total water conveyance efficiency (2017)
Data source: Azerbaijan: Az STAT(Statistical Committee of the Republic of Azerbaijan); Armenia: ArmStatBank (Statistical Committee of the Republic of Armenia); Belarus: Belstat (National Statistical Committee of the Republic of Belarus); Georgia: Water Division of the Department of Environment and Climate Change and the Integrated Management Division of the Department of Environmental Assessment, Ministry of Environmental Protection and Agriculture; Moldova: Statistica Moldovei (Statistical Databank of the National Bureau of Statistics of the Republic of Moldova) and Agency Apele Moldovei.
Note: Georgia 2016; Data provided to European Environment Agency under the ENI EAST SEIS II project.
In Armenia, on average 30 % of total freshwater abstraction is lost in the water transport system. During recent years, the percentage of total abstracted water that is lost during transport has increased from 758.9 million m3 in 2000 to 825.4 million m3 in 2017. Taking into account the severe water stress conditions in Armenia (WEI 61.4 % in 2017), the low efficiency of its conveyance system exacerbates water scarcity in the country. The average annual total freshwater use was around 2 550 million m3 in 2000, decreasing substantially to 2 040 million m3 in 2017. Considering the severe water stress conditions across the country, the current level of water abstraction and water use – particularly by the agricultural sector – has already exacerbated environmental problems.
Similarly, in Azerbaijan, almost one third of total water abstraction is lost during conveyance. As agriculture is the largest user of water resources, high rates of water losses in transport puts additional pressures on water resources. No significant improvement has been observed in the efficiency of water transport between 2000-2017 whereas water abstraction is steadily increasing.
In Georgia, around 1 980 million m3 of water was used by different economic sectors in 2016. Around a quarter of this water was lost during transport. Over the last decade, the country’s water conveyance system has been partially improved and renewed. However, no significant progress has been made in the reduction of water losses since 2004. The combination of high water loss and increasing demands for water from agriculture and households will expose more acute water efficiency issues in Georgia in years to come.
Water loss in transport is relatively low in Belarus. Around 4 % of total water abstraction is lost during transport.
On average, Moldova uses around 800 million m3 of water annually. Around 7-8 % of all water abstraction is lost in the transport system because of leakages, water loss from open channels and ageing infrastructure. These losses amount to between 55 and 77 million m3 of water each year. Since 2000, no progress has been made in improving the water transport system.
4.3.2 Efficiency in public water supply system
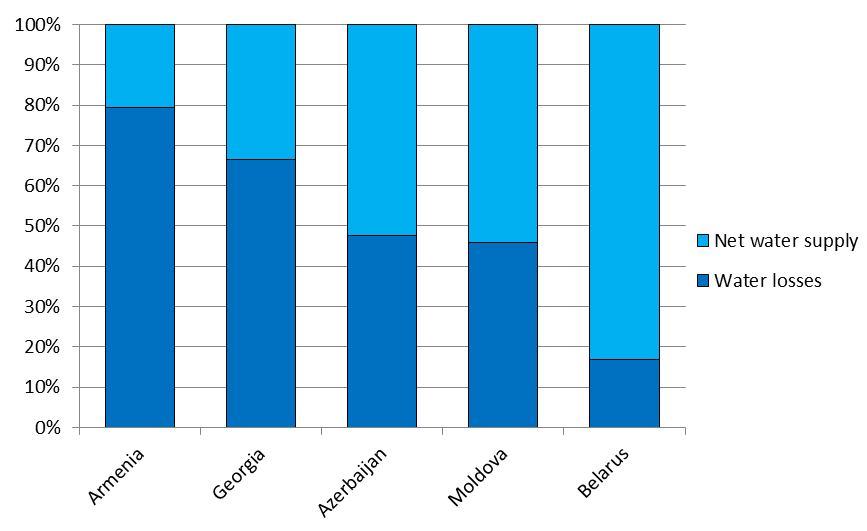
Supplying sufficient and clean water to the public for different purposes, including for drinking, is the major service of the water collection, treatment and supply sector. Public water supply is the second largest sector in the Region, and accounts for a significant volume proportion of overall water use. Apart from the population pressures e.g. increasing water demand due to population growth, the major factors affecting the conveyance efficiency in public water supplies are ageing conveyance systems, and the distance between the source of water and the point of water supply (UNECE, 2000a; 2011, 2016a, 2016d, 2014b). More than 60 % of the water abstracted for the public water supply system in Armenia and Georgia is lost in the conveyance system, where half of the water is lost in Azerbaijan and Moldova (Figure 9).
Figure 9: Water losses in water supply conveyance system (2017)
Data source: Azerbaijan: Az STAT (Statistical Committee of the Republic of Azerbaijan); Armenia: ArmStatBank (Statistical Committee of the Republic of Armenia); Belarus: Belstat (National Statistical Committee of the Republic of Belarus); Georgia: GEOSTAT - National Statistics Office of Georgia; Moldova: Statistica Moldovei (Statistical Databank of the National Bureau of Statistics of the Republic of Moldova) and Agency Apele Moldovei.
Note: Moldova 2016; Georgia 2018; Data provided to European Environment Agency under the ENI EAST SEIS II project.
In Armenia 589 million m3 of water was supplied by the water supply system in 2018, of which 468 million m3 was lost in the water supply network, which corresponds to 79 % of the total water supplied. According to a UNECE environmental performance assessment carried out during the 2000s, around 80 % of the pipes in the network were more than 10 years old and 55 % were more than 20 years old. Their maintenance had been neglected. The number of interruptions in water supply in Armenia is thus increasing (UNECE, 2000b).
As Armenia is experiencing high water stress conditions, reducing water losses by a target of 50 % in public water supply to urban areas and agriculture /aquaculture may significantly reduce the water stress levels in the country. With financial support from the European Investment Bank, the Armenian government is implementing the Yerevan Water Supply Improvement Project to improve the water supply system in Yerevan (EBRD, 2016). However, water losses in the network are still incredibly high and continuously increasing. For instance, around 66 % of the country’s total water supply was lost in 2000, but losses increased to 79 % in 2018. High – and steadily increasing – rates of water losses in the transport system look unsustainable in the long term in Armenia.
In Georgia, around 800 million m3 of water was supplied by the water supply system in 2018, of which 531 million m3 was lost in the water supply network, corresponding to 66 % of the total water supply. The country’s water sector infrastructure has deteriorated because of a lack of adequate repair and maintenance and a shortage of funds to invest in modernising the water facilities in recent years (UNECE, 2016c). High water losses in the conveyance network are putting significant pressure on renewable water resources in Georgia.
In Azerbaijan, 609.1 million m3 of water was supplied by the water supply system, of which 290.5 million m3 was lost in the water supply network, which corresponds to 47.6 % of total water supply in 2017. As a result of the introduction of water metering and improvements in the distribution network (UNECE, 2011b), water use by households in the country decreased substantially (by 42 %) between 2000-2017, even though overall population increased.
To accommodate increasing needs for public water supply in large cities in Azerbaijan, the government is implementing some large projects. For instance, at 250 km in length, the Oğuz - Gabala - Bakü water pipeline is one the largest projects for water transfers between two basins in the world. It can transfer water at a rate of 5 m³/s (Sertyeşi̇Lişik, 2017). In addition, Azerbaijan meets around 15 % of its total water demand from recycled water. The share of water abstraction for drinking purposes has decreased due to improvement of the water supply systems (UNECE, 2011b). Nevertheless, there is still much improvement to be made in water efficiency in Azerbaijan, particularly in the agricultural sector, and in decreasing water losses during transport to the public water supply.
In Belarus, the water supply industry supplied 553 million m3 of water, which corresponds to 40 % of the total annual water abstraction in the country in 2017. On average, around 16 % of the public water supply is lost in the country’s conveyance system. Belarus has been investing in renewing and expanding its water supply network in recent years. The total length of the public water supply network was increased from 31 156 km in 2010 to 38 204 km in 2017. In addition, over the same period, around 1 295 km of the total length of the water network was renewed, corresponding to 3.4 % of the existing supply network. As a result of these investments, water losses began to decline from 2011 onwards.
In Moldova (including the territory on the left bank of the Nistru/Dniester river), the sector using the largest amount of water is the heating and hot water supply sector. In 2017, water use by this sector was 55 600 m3 which corresponds to 72 % of the total water use in the country. The sectors that are the next biggest users of water are the water supply industry (15 %) and agriculture (10 %). The remaining water is used by the construction and service sectors.
There are significant differences in public water supply coverage between urban and rural areas of Moldova. Whereas piped water supply 87 % of buildings in cities, it drops to 25 % of rural settlement buildings. The water supply system is technically outdated and in poor condition. Water pumps are often inefficient and there are many breaks in the pipe system, together causing high water losses (Salvetti and Giovanna, 2015; UNECE, 2014a). These issues mean that the public water supply system in Moldova loses almost half of the water it abstracts each year. In addition, drinking water quality is poor, due to infiltration of waste water into pipes.
The level of investment into the Moldovan water industry sector is insufficient to reach the country’s needs. For example, between 2009-2013, only 0.02 % of nominal national GDP was invested into the water sector. This figure is extremely low compared to the 1.2 % recommended by the OECD for low-income countries (OECD, 2011; Salvetti and Giovanna, 2015). There is also no long-term water supply planning strategy, nor any governmental requirements regarding economic and technical assessment of investment projects.
4.3.3 Water use efficiency and the economy
Water is not only a vital resource for the environment and freshwater ecosystems, it also plays a significant role in national economies. For instance, without water input, it would not be possible to sustain agricultural activities in parts of countries where irrigation is an inevitable practice for tackling water deficits. Similarly, water is also used for electricity generation (both in hydropower and cooling). Water supply is also crucial to aquaculture, which is one of the major economic sectors in Belarus and Armenia.
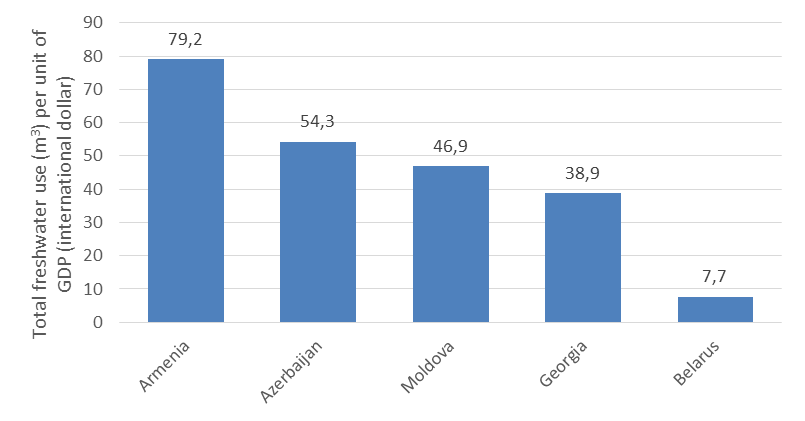
The efficiency of water use in an economy is measured by the comparison of water input (m3 or million m3) with per unit of gross domestic product (GDP). All six countries have succeeded in increasing their gross domestic product (GDP at purchasing power parity at constant price), whilst resulting in decreasing water inputs per unit of GDP since 2000. Water use efficiency, unfortunately, has not increased significantly since 2000.
A country comparison of economic water use efficiency shows that (Figure 10) the best performing country in using less water per unit GDP is Belarus followed by Georgia. Regional economic water use efficiency is the lowest in Armenia at the regional level.
Data source: World Bank for GDP; Water use: Azerbaijan: Az STAT (Statistical Committee of the Republic of Azerbaijan); Armenia: ArmStatBank (Statistical Committee of the Republic of Armenia); Belarus: Belstat (National Statistical Committee of the Republic of Belarus); Georgia: Water Division of the Department of Environment and Climate Change and the Integrated Management Division of the Department of Environmental Assessment-Ministry of Environmental Protection and Agriculture; Moldova: Statistica Moldovei (Statistical Databank of the National Bureau of Statistics of the Republic of Moldova) and Agency Apele Moldovei.
Note: Georgia 2015; Data provided to European Environment Agency under the ENI EAST SEIS II project.
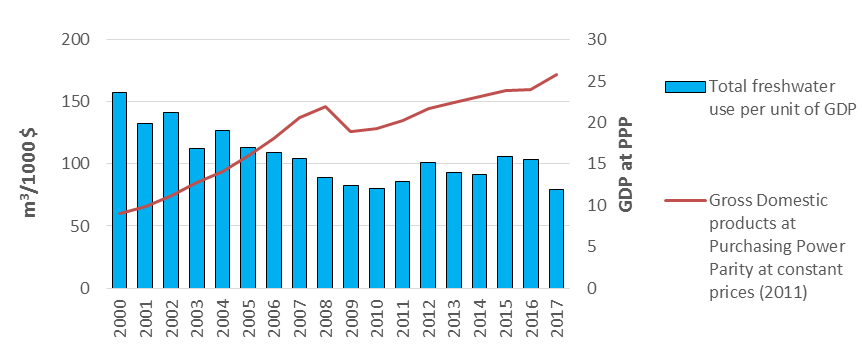
However, between 2000-2017, GDP in Armenia has almost tripled (USD 8.97 billion in 2000 compared with USD 25.75 billion in 2017). In parallel, the total water use by economic sectors in Armenia has increased by 44.5 % during over the same period. The relative decrease in the total freshwater use by the economy slightly improved the efficiency of water use and almost halved the total freshwater use per unit of GDP (Figure 11).
Figure 11: Development of total freshwater use per unit of gross domestic product at purchasing power parity (PPP) in the Republic of Armenia (2000-2017)
Data source: World Bank for GDP; Water use: ArmStatBank (Statistical Committee of the Republic of Armenia;
Note: Data provided to European Environment Agency under the ENI EAST SEIS II project.
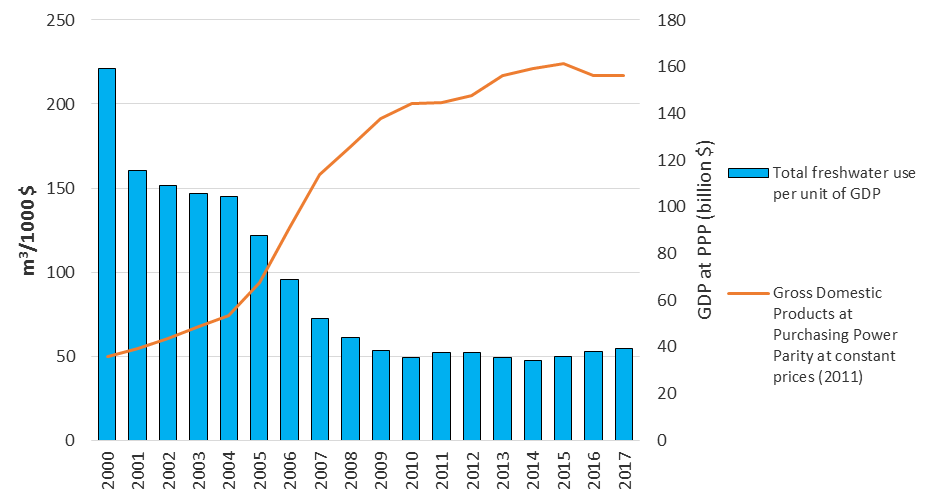
In Azerbaijan, as a result of rapid economic improvements, GDP increased by more than a factor of four (4.4) between 2000-2017. GDP at purchasing power parity (PPP)([1]) increased from USD 35.9 to USD 156.3 billion. . Over the same period, water use in Azerbaijan decreased from 221 m3/USD 1,000 GDP to 54.3 m3/USD 1,000 GDP, indicating a relative decoupling of income generation and water use (Figure 12. Development of total freshwater use per unit of gross domestic product at purchasing power parity in the Republic of Azerbaijan (2000-2017) It should be noted that the total annual freshwater use increased by 7 % over the same period. Despite the relative efficiency gained, water losses in transport and an increasing demand for water in agriculture remain major ongoing challenges for water resources management.
Figure 12. Development of total freshwater use per unit of gross domestic product at purchasing power parity in the Republic of Azerbaijan (2000-2017)
Data source: World Bank for GDP; Water use: Az STAT (Statistical Committee of the Republic of Azerbaijan).
Note: Data provided to European Environment Agency under the ENI EAST SEIS II project.
In Georgia, the GDP been increased by 44 % between 1990-2016. Although there has been an increase in GDP, there has not been a similar increase in water use efficiency. Nevertheless, in 1990, around 145 m3 of water was used in the country’s economy to producing USD 1 000 by the economy, but 38 m3 of water was used in 2015 to produce the same unit of GDP (Figure 13).
Figure 13: Development of total freshwater use per unit of gross domestic product at purchasing power parity in Georgia (1990-2015).
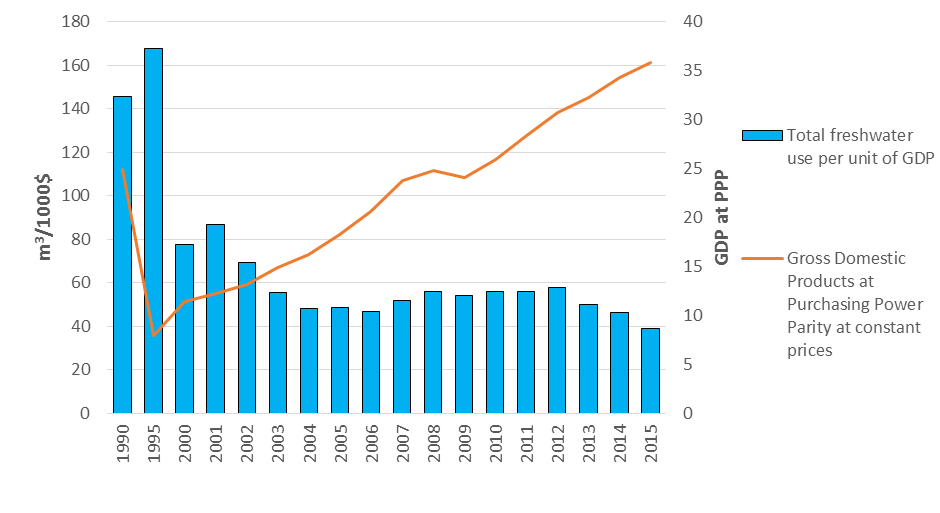
Data source: World Bank for GDP; Water use: Water Division of the Department of Environment and Climate Change and the Integrated Management Division of the Department of Environmental Assessment-Ministry of Environmental Protection and Agriculture.
Note: Data provided to European Environment Agency under the ENI EAST SEIS II project.
Belarus has significantly improved its water use efficiency in 2000s. As a result, water use per unit of gross domestic product (GDP) at purchasing power parity (PPP) has decreased from 33 m3/1 000 USD in 1990 to 8 m3/1 000 USD in 2017. Over the same period, GDP at PPP has roughly doubled, from USD 85 billion in 1990 up to 163 billion in 2017 (Figure 14).
Figure 14: Development of total freshwater use per unit of gross domestic product at purchasing power parity in the Republic of Belarus (1990-2017).
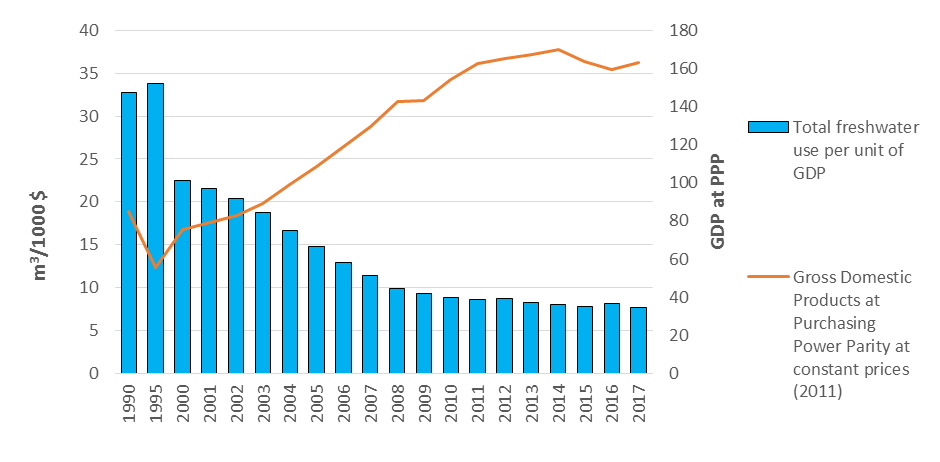
Data source: World Bank for GDP; Water use: Belstat (National Statistical Committee of the Republic of Belarus).
Note: Data provided to European Environment Agency under the ENI EAST SEIS II project.
Similarly, in Moldova, the country’s GDP more than doubled between 2000-2017 (Figure 15), from USD 8.4 billion in 2000 up to 18.4 in 2017 (The World Bank, 2020), while total freshwater use per unit of GDP has decreased by about 60 % (not including information on the left bank of the Nistru/Dniester river). The efficiency of total water use per unit of GDP was reached by decreasing water use while maintaining the upward trend in GDP. In 2000, around 104 m3 of water was used in the country’s economy to produce USD 1 000 by the economy, which decreased to 43 m3 of water used in 2017 to produce the same unit of GDP. However, it should be noted that 43 m3 of water per GDP unit still is very high compared to other countries, and further water use efficiency improvements need to be made in the years to come.
Figure 15: Development of total freshwater use per unit of gross domestic product at purchasing power parity in the Republic of Moldova (2000-2017).
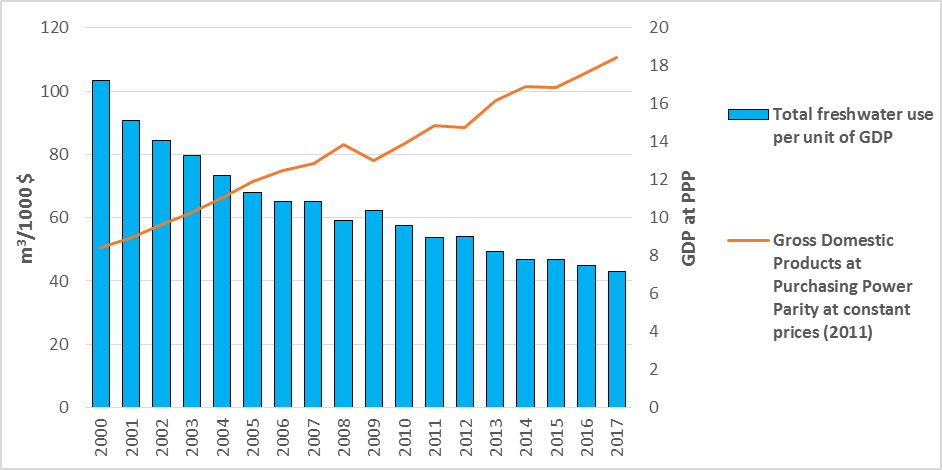
Data source: World Bank for GDP; Water use: Statistica Moldovei (Statistical Databank of the National Bureau of Statistics of the Republic of Moldova) and Agency Apele Moldovei.
Note: Data provided to European Environment Agency under the ENI EAST SEIS II project.
[1] A metric that compares different countries' currencies through a “basket of goods" approach and therefore compare economic productivity and standards of living between countries.