
Post a comment on the text below
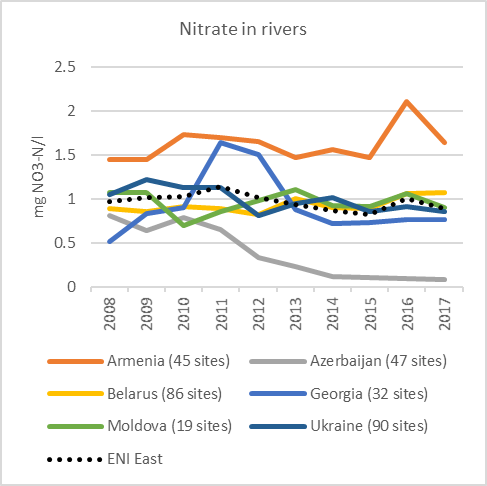
Figure 22: Average annual nitrate and phosphate concentration for river sites in the ENI East countries over the time period 2008-2017.
 |
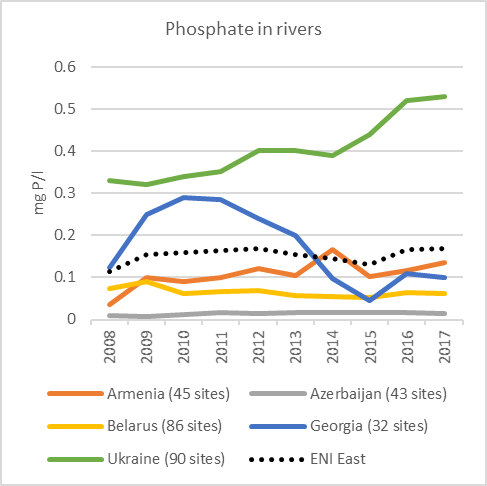 |
Data sources: Armenia: Environmental Monitoring and Information Center SNCO, Ministry of Nature Protection; Azerbaijan: National Environmental Monitoring Department of the Ministry of Ecology and Natural Resources; Belarus: National Environmental Monitoring System by the Ministry of Natural Resources and Environmental Protection; Georgia: National Environmental Agency of the Ministry of Environmental Protection and Agriculture; Environment Quality Monitoring Division of the State Hydrometeorological Service of the Ministry of Agriculture, Regional Development and Environment; Moldova: Ministry of Agriculture, Regional Development and Environment; Ukraine: Ministry of Ecology and Natural Resources.
Note: Only complete time series after inter/extrapolation are included.
You cannot post comments to this consultation because you are not authenticated. Please log in.
Previous comments
Nitrate in rivers: Belarus (176 sites)
Phosphate in rivers: Belarus (176 sites)
Explanation: you used "Belarus (86 sites)", but 86 is the number of rivers with sites.