
Table of contents
- General guidance
- General comments
- Acknowledgements
- Executive summary
- 1 Introduction
- 2 Policy context of water resources management in Eastern Partnership countries
- 3 Renewable water resources
- 4 Sectoral pressures on freshwater resources
- 5 Access to safe drinking water
- 6 Water quality
- 7 Outlook
- Reference List
6 Water quality
Organic waste and nutrient pollution constitute serious threats to water quality, both from an ecological perspective and with respect to human uses such as drinking water, bathing water and recreation. Waste water – both municipal and industrial – as well as diffuse runoff from agriculture are the main sources of organic waste and nutrient pollution. All of these pressures affect water quality across the region.
Despite some remarkable progress made in connecting the population to public water supply systems in all six countries, treatment of waste water still remains insufficient. For instance, in Armenia there is hardly any biological treatment of waste water to break down the organic waste. In Baku, the capital of Azerbaijan, only half of the collected water is treated. In Georgia only a few of the municipal waste water treatment plants built in the 1980s operate. Organic pollution generated in cities is transmitted directly to the rivers. In Moldova most treatment plants operate with primary treatment only, so organic waste is not processed. In addition, poorly treated industrial waste water affects the performance of municipal treatment plants, and much untreated industrial waste water is discharged directly into rivers. In Ukraine the urban treatment plants have insufficient capacity and are in poor technical condition, while there is a general lack of sewage networks in rural areas. However, in the region there are new investments ongoing for improving the treated water discharge to the environment.
Due to suitable topographic and soil conditions, large areas of the region are used for agriculture and this sector employs millions of rural inhabitants. However, high – and increasing – applications of manure and inorganic fertiliser makes agriculture a major driver of nutrient, ammonium and organic matter releases into the water system.
Deterioration in water quality is therefore not a new issue in the region, but will exacerbate in the future with intensified agriculture and increased industrialisation and urbanisation, particularly if these developments are not supported by improved wastewater treatment. Lack of financial resources or insufficient management of water resources, institutionally or technically, will add to the problem.
In order to understand the water quality situation in the region, it is necessary to analyse causes of pollution and evaluate their impacts on water resources. The long-term analyses are necessary to show trends in water quality and connect them to socio-economic trends and environmental situation. Policy makers and environmental managers can use the information to guide the design and implementation of measures.
Organic matter and ammonium in rivers and nutrients in freshwater are used as measure to assess the situation of water quality in the region. The present state of water is defined as the average for the last three years with available data. For the pollutants in question there are no general thresholds for assessing whether the concentrations are acceptable or not from an ecological perspective. Such thresholds vary with water body type, characterised by factors such as geology, climate and or altitude. The present state of water quality gives an indication of the pollution situation and shows whether the pollution is mainly a local issue, affecting a few sites, or a general issue nationally or regionally. The different Eastern Partnership countries often have national targets or maximum permissible concentrations for pollutants, but these are frequently quite high and may be targeted at other purposes than protecting the ecosystem, such as the use of water as drinking water. They are referred to in the next section. As a general reference, the targets for ammonium concentration and biochemical oxygen demand (BOD) in the EU Fish Directive (2006) are also used([1]).
1.1 Organic matter and ammonium in rivers
The discharge of large quantities of organic matter containing microbes and decaying organic waste, either from agriculture or as waste water from households or industrial effluents, may result in reduced chemical and biological quality in river water, reduced biodiversity of aquatic communities, and microbiological contamination that can affect the quality of drinking and bathing water. Organic pollution leads to higher rates of metabolic processes that demand oxygen. This can result in the development of water zones without oxygen (anaerobic conditions), which has profound direct impacts on the ecosystem. The transformation of nitrogen to reduced forms under anaerobic conditions, in turn, leads to increased concentrations of ammonium, which is toxic to aquatic life above certain concentrations, depending on water temperature, salinity and acidity. Organic matter in water is measured as biochemical oxygen demand (BOD), which is the amount of dissolved oxygen which is required for the aerobic decomposition of the organic matter present in the water. BOD is expressed in mg of O2/litre, while ammonium concentration is expressed in mg of NH4-N/litre.
6.1.1 Changes over time
The main source of organic pollution in Armenia is untreated or insufficiently treated waste water, which, due to the lack of treatment plants, is emitted into the rivers. There are only six water treatment plants in Armenia, with only mechanical treatment where organic waste is not processed. From 2008-2017 the BOD and ammonium concentration in rivers increased by 18 % and 72 %, respectively (Hata! Başvuru kaynağı bulunamadı.). An increase was mainly observed for at sites below settlements. Emission in the less populated areas have not changed a lot in this period. The River Hrazdan is one of the longest and most polluted rivers in Armenia. The effect of the influences of untreated wastewater is significant, especially at one highly polluted monitoring site located downstream, which is the nearest and most impacted site after Yerevan city, the capital of Armenia, which is home to around 1 million inhabitants. The pollution level of this site has a major impact on the country average, resulting in both higher absolute levels of pollution and a larger increase over time. This is particularly evident for ammonium.
Figure 19: Average annual BOD (left) and ammonium concentration (right) for river sites in the ENI East countries over the time period 2008-2017
 |
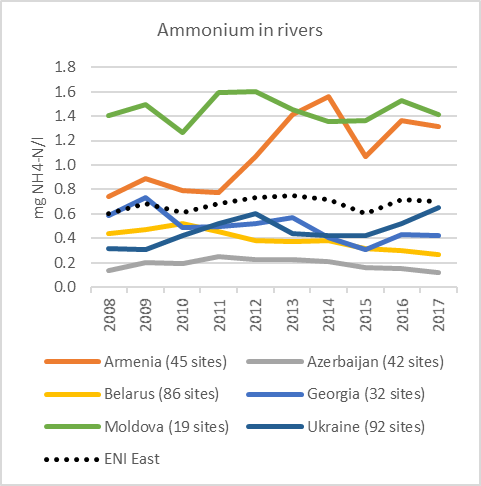 |
Data sources: Armenia: Environmental Monitoring and Information Center SNCO, Ministry of Nature Protection; Azerbaijan: National Environmental Monitoring Department of the Ministry of Ecology and Natural Resources; Belarus: National Environmental Monitoring System by the Ministry of Natural Resources and Environmental Protection; Georgia: National Environmental Agency of the Ministry of Environmental Protection and Agriculture; Environment Quality Monitoring Division of the State Hydrometeorological Service of the Ministry of Agriculture, Regional Development and Environment; Moldova: Ministry of Agriculture, Regional Development and Environment; Ukraine: Ministry of Ecology and Natural Resources.
Note: Only complete time series after inter/extrapolation are included.
Between 2001-2017 there was a slight increase in ammonium concentration and a slight decrease in BOD (by 32 % and 25 %, respectively, if comparing the average of the last three years to that of the first three years) in Azerbaijan. However, BOD has increased from its minimum level in 2012, while ammonium has decreased in recent years. For both pollutants there was a period with higher levels than currently. For BOD this happened mainly before 2008, while it occurred mainly after 2008 for ammonium. The time series patterns seen at the national level are broadly similar at the regional level.
Transboundary transport, industrial and agricultural production, old sewer systems, and a lack of solid waste management in some rural areas led to an increase in organic pollution in Azerbaijan up to 2010. The Shamkir and Mingechevir reservoirs along the Kura river were affected by the discharge of waste water from many settlements in the Kura River Basin. Over the last 7-8 years however, the installation of new modern waste water treatment plants in the country has reduced organic pollution.
In Georgia, BOD decreased somewhat between 2004-2018 (by 11 % when comparing the average of the last three years to that of the first three years). The main decrease was in the Black Sea river basin (21 %). The average for the Kura river basin increased towards 2006 but has decreased since then. Ammonium concentration showed a more pronounced decrease (50 %). The largest decrease was observed for rivers in the Kura river basin (62 %). The results for the years 2011-2013 should be treated with some caution, due to lower numbers of samples per year. This may explain some of the variability observed for ammonium concentration in this period.
The decreases in BOD and ammonium concentrations in Georgia can be attributed to measures such as the improvement of urban and industrial wastewater treatment. Further improvement is expected for the Black Sea river basin where the large cities have not previously had wastewater treatment plants. Water treatment plants are currently under construction in Zugdidi and Poti and the construction of a treatment plant in Kutaisi is planned.
The average BOD has decreased since 1992 at the country level in Belarus, particularly in the period 1997-1998. For the whole time period 1986-2017 the BOD decreased by 19 % (comparing the average of the last three years to that of the first three years). The largest decrease was observed in the Western Bug river basin, followed by the Dniepr and Pripyat river basins, while there has hardly been any change overall in Western Dvina, the river basin with the lowest BOD levels.
-
The average BOD has decreased since 1992 at the country level in Belarus, particularly in the period 1997-1998. For the whole time period 1986-2017 the BOD decreased by 19 % (comparing the average of the last three years to that of the first three years). The largest decrease was observed in the Neman and Dniepr river basins.
Concentration levels of ammonium have been more variable in Belarus, but there has been a steady decrease since 1998. This is also seen in the different river basins, however, all except Western Dvina experienced a sharp increase in 1998. This is in contrast to the marked decrease in BOD in the same period and may partly indicate different sources of pollution. However, the decreasing levels in both parameters –ammonium in particular –over the last two decades, indicates an overall reduction in pressure from organic pollution.
-
Concentration levels of ammonium have been more variable in Belarus, but there has been a steady decrease since 1998. This is also seen in the different river basins, however, all except Western Dvina experienced a sharp increase in 1992-1998. This is in contrast to the marked decrease in BOD in the same period and may partly indicate different sources of pollution. However, the decreasing levels in both parameters –ammonium in particular –over the last two decades, indicates an overall reduction in pressure from organic pollution.
In Moldova, the average BOD and ammonium concentration in rivers show similar patterns over the time period 1992-2017, with declining levels until 1997-1998 then fluctuating higher levels, and finally returning to similar levels to the start of the time period. Ammonium concentrations were highest between 2001-2004, while BOD was highest around 2003-2008. However, the increases in pollution can be attributed to sites in the Dniester river basin. For the sites in the Prut river basin and the two sites on the Danube and its tributary (Cogîlnic) ammonium concentrations generally decreased over time and BOD levels were stable or slightly decreasing.
River water downstream of cities and towns in Moldova was significantly more polluted than that upstream. Upstream of cities, ammonium concentrations have decreased steadily since 1992, although less in recent years, while the concentrations downstream have increased. This trend can be attributed to non-treated effluent from the cities. The up-downstream difference is less for BOD. Here the downstream level has decreased in recent years, approaching that of the upstream level.
Over the period 2000-2017 the average BOD in Ukrainian rivers was lowest in 2010, after which it has increased. However, the current level is similar to that of 2003-2004. The ammonium concentrations have fluctuated significantly, but overall, the concentrations increased between 2000-2017.
6.1.2 Current state
In Armenia, 31 % and 44 % of the river sites belong to the two highest concentration classes for BOD and ammonium levels, respectively, based on data for 2015-2017 (Figure 21). The highest average BOD concentrations were found in the Hrazdan river basin, followed by Akhuryan (Hata! Başvuru kaynağı bulunamadı.. Hrazdan is the most populated river basin in Armenia, while the second most populated city (Gyumri) is located in the Akhuryan river basin. The waste waters of both cities discharge directly into the rivers, due to a lack of waste water treatment plants. The best water quality conditions were found in the Sevan river basin. The rivers here are mainly subject to diffuse sources of water pollution, which do not have a big significant impact. However, even here the two sites had average ammonium concentration above the recommended levels for cyprinid fish in the EU Fish Directive (2006/44/EC). To reduce pollution of surface waters (especially in the Sevan river basin) there is new legislation that requires local treatment of wastewater from recreation areas before it is discharged to rivers or lakes.
All but one Armenian river basin, Ararat, had river sites where the current ammonium concentration exceeded the recommended concentration for cyprinid fish. In total, 49 % of sites exceeded recommended ammonium concentrations. Most of the elevated concentrations were found downstream of settlements, but some were found above settlements, possibly because the headwaters are not protected by legislation. The Armenian authorities are filling the gap in the legislation to protect headwater areas, starting with the Akhuryan river basin. The recommended BOD level for salmonid fish was exceeded at 31 % of monitoring locations in Armani. Two sites also exceeded the BOD threshold for cyprinid fish. The good/moderate thresholds in the national legislation are generally higher than the recommended levels in the EU Fish Directive.
Figure 20: Average river BOD and ammonium concentration for 2015-2017 by River Basin Management Unit.
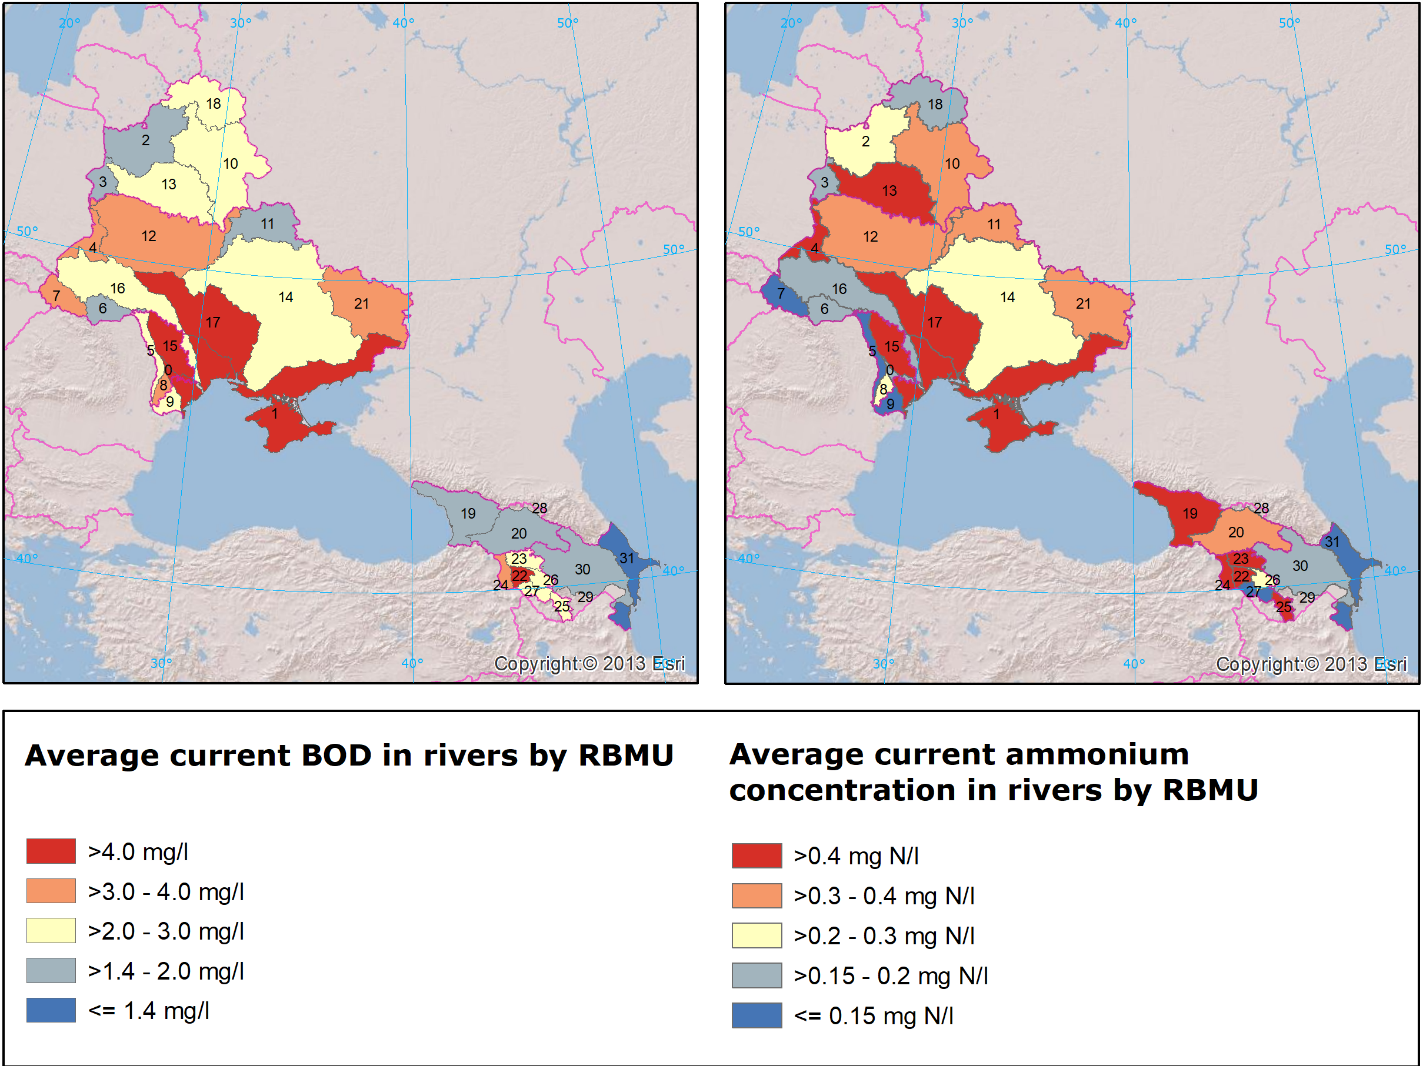
Data sources: Armenia: Environmental Monitoring and Information Center SNCO, Ministry of Nature Protection; Azerbaijan: National Environmental Monitoring Department of the Ministry of Ecology and Natural Resources; Belarus: National Environmental Monitoring System by the Ministry of Natural Resources and Environmental Protection; Georgia: National Environmental Agency of the Ministry of Environmental Protection and Agriculture; Environment Quality Monitoring Division of the State Hydrometeorological Service of the Ministry of Agriculture, Regional Development and Environment; Moldova: Ministry of Agriculture, Regional Development and Environment; Ukraine: Ministry of Ecology and Natural Resources.
Note: RBMUs: 0 - Black Sea (MD), 1 - Black Sea (UA), 2 - Neman (BY), 3 - Western Bug (BY), 4 - Vistula (UA), 5 - Prut (MD), 6 - Prut (UA), 7 - Tisa (UA), 8 - Danube (MD), 9 - Danube (UA), 10 - Dnieper (BY), 11 - Desna (UA), 12 - Dnieper - upstream Kiev (UA), 13 - Pripyat (BY), 14 - Dnieper - downstream Kiev (UA), 15 - Dniester (MD), 16 - Dniester (UA), 17 - Southern Bug (UA), 18 - Western Dvina and Gulf of Finland (BY), 19 - Black Sea (GE), 20 - Kura (GE), 21 - Donets (UA), 22 - Hrazdan (AM), 23 - Northern (AM), 24 - Akhuryan (AM), 25 - Southern (AM), 26 - Sevan (AM), 27 - Ararat (AM), 28 - Terek (GE), 29 - Aras (AZ), 30 - Kura (AZ), 31 - Caspian Sea (AZ). No data are available for uncoloured RBMUs.
In Azerbaijan, none of the river sites were assigned to the three upper BOD classes. Moreover, no sites exceeded the national maximum allowable concentration for ammonium concentration (0.4 mg NH4-N/l), which corresponds to the highest ammonium class. Still, 20 % of the sites had current ammonium concentration corresponding to the second highest ammonium class. The recommended ammonium concentration level for salmonid fish was always exceeded, and the cyprinid threshold was exceeded at 35 % of sites. River sites in the Kura river basin had somewhat higher ammonium concentrations and BOD than river sites outflowing to the Caspian Sea.
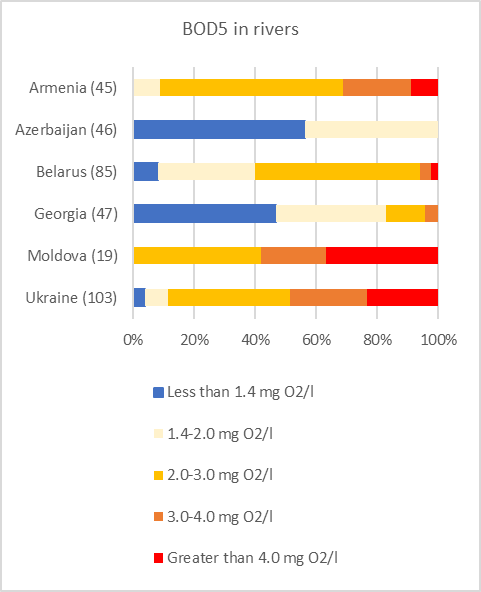
Figure 21: Distribution of river monitoring sites to BOD (top) and ammonium concentration (bottom) classes in the ENI East countries, based on the average of annual mean concentrations for 2015-2017
 |
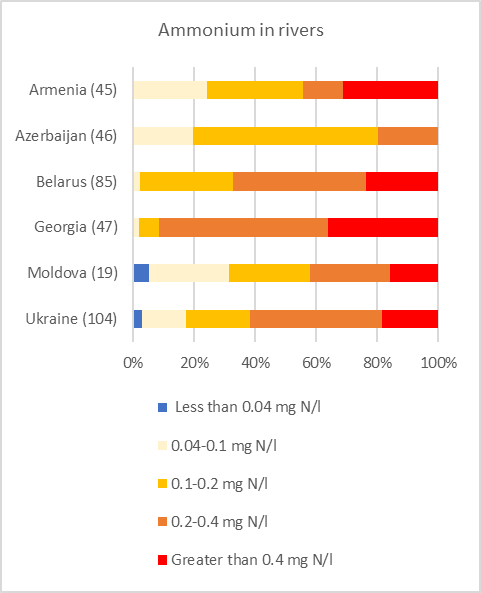 |
Data sources: Armenia: Environmental Monitoring and Information Center SNCO, Ministry of Nature Protection; Azerbaijan: National Environmental Monitoring Department of the Ministry of Ecology and Natural Resources; Belarus: National Environmental Monitoring System by the Ministry of Natural Resources and Environmental Protection; Georgia: National Environmental Agency of the Ministry of Environmental Protection and Agriculture; Environment Quality Monitoring Division of the State Hydrometeorological Service of the Ministry of Agriculture, Regional Development and Environment; Moldova: Ministry of Agriculture, Regional Development and Environment; Ukraine: Ministry of Ecology and Natural Resources.
Note: The number of monitoring sites per country is given in parenthesis.
In Georgia, the current BOD was below the national maximum permissible concentration of 6 mg O2/l for all sites. Moreover, only two sites in the Kura river basin had BOD above the stricter criteria set in the EU Fish Directive for salmonid fish (3 mg O2/l). However, 91 % of the sites belonged to the upper two ammonium concentration classes, and 36 % of the sites had average concentration above the national maximum permissible concentration (0.39 mg NH4-N/l). Only two river sites in Georgia had current ammonium concentrations below the EU Fish Directive recommended level for cyprinid fish, and none were below the threshold for salmonid fish. While average BOD was slightly higher in the Kura than the Black Sea river basin, the opposite was true for average ammonium concentration. The high ammonium concentrations in the Black Sea river basin probably reflect the poor level of waste water treatment in this region.
Only 6 % of river sites in Belarus had current BOD above the lowest national maximum permissible concentration (3 mg O2/l). The average BOD level was relatively similar among the different river basins. The situation was worse for ammonium concentration, with 67 % of the sites in the upper two concentration classes. The highest average BOD concentration was found in the Pripyat and Dnieper basins. In Belarus, 25 % of the sites had ammonium concentration above the national maximum permissible concentration (0.39 mg NH4-N/l), but this level is quite high compared to EU Fish Directive recommended levels. 82 % of the sites were above the recommended BOD level for cyprinid fish.
-
Only 6 % of river sites in Belarus had current BOD above the lowest national maximum permissible concentration (3 mg O2/l or 6 mg O2/l). The average BOD level was relatively similar among the different river basins. The highest average BOD concentration was found in the Western Bug and Dnieper basins. In Belarus, 25 % of the sites had ammonium concentration above the national maximum permissible concentration (0.39 mg NH4-N/l), but at present, average annual ammonium concentration complies with national quality standard.
In Moldova, 58 % and 42 % of the river sites belonged to the two highest classes for BOD and ammonium concentration, respectively. The highest average levels were found for sites in the Dniester RBMUs. Average levels of ammonium concentration were far higher here than in the other RBMUs, and 67 % of the sites in Moldova were above the EU Fish Directive recommendation for cyprinid fish. Across all river basins 47 % of the river sites were above the recommended level.
In Ukraine, 49 % of the river sites had BOD concentrations above 3 mg O2/l. The average levels were by far the highest for sites in the Black Sea river basin, but an additional five river basins had average levels above 3 mg O2/l. 69 % of the sites had current ammonium concentrations above the EU Fish Directive recommendation for cyprinid fish. The highest average concentrations were found in the Southern Bug, Black Sea and Vistula basins.
6.2 Nutrients in freshwater
Significant inputs of nitrogen and phosphorus to freshwater bodies from urban areas, industry and agricultural areas can lead to eutrophication, characterised by excessive algal growth, which may result in oxygen depletion. Eutrophication can cause ecological impacts such as the loss of plant and animal species (reduction in ecological status) and have negative impacts on the use of water for human consumption and other purposes. In this next section, the concentration of phosphate and total phosphorus is expressed in mg of P/litre, while the concentration of nitrate is expressed in mg of NO3-N/litre in rivers and mg of NO3-N/litre in groundwater.
6.2.1 Changes over time
The main sources of nutrients in Armenia are agriculture, waste water and storm water. There are only six water treatment plants in Armenia, with mechanical and no organic matter treatment. Nitrate pollution is mainly associated with agricultural run-off.
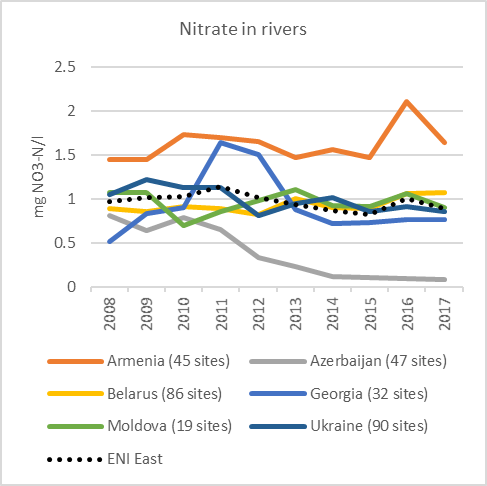
In Armenia, river nitrate concentrations increased by an average of 18 % between 2008-2017 (Figure 22). However, the increase was associated with sites downstream of settlements. Above settlements there was a slight decrease in nitrate concentrations. In contrast, there were similar levels of increased phosphate concentrations. The increase was about the same upstream and downstream of settlements for river phosphate concentration. Overall, the nitrate concentrations increased by 33 % between 2009-2017. This increase is much larger compared to 2008, but concentrations were particularly low that year. Increasing nitrate concentrations are the result of increased emissions from wastewater and agriculture. The River Hrazdan is one of the longest and most polluted rivers in Armenia and has very high phosphate concentrations, particularly at the nearest site downstream of Yerevan City. Removing this site from the overall average reduces the national phosphate concentration markedly. No such effect is seen for nitrate, indicating that waste water is the major contributor at this site.
In the Lake Sevan, average nitrate and phosphorus concentrations increased markedly between 2008-2012. This might be a consequence of an increase in the lake level, an attempt to restore the natural state of the lake (see Chapter 4.2); when water covered buildings, roads and forests on the lake shore led to increased nutrient pollution. Average total phosphorus concentrations in the lake also increased between 2013-2017. Diffuse runoff from agricultural land and untreated domestic waste water continues to be significant sources of phosphorus pollution. These pollution sources do not have a big impact on the rivers in the region, but they affect Lake Sevan due to direct discharges into the lake. Moreover, phosphorus stored in bed sediment can keep lake concentrations high and prevent improvement of the water quality through management measures.
In Azerbaijan, river data are available from 2001. A strong decrease in average river nitrate concentration occurred from 2005, and particularly from 2011 onwards, reaching very low average levels from 2014 onwards. The time series pattern was fairly similar between the different regions. For river phosphate concentration, the time series showed different patterns between regions. The concentrations in Gazakh-Ganja, and particularly in Shirvan, increased markedly between 2009-2011. A slower, but steady increase also occurred in the Guba-Khachmaz region. These patterns are reflected in the overall time series for the whole country, where the average phosphate concentration doubled between 2001-2011.
Figure 22: Average annual nitrate and phosphate concentration for river sites in the ENI East countries over the time period 2008-2017.
 |
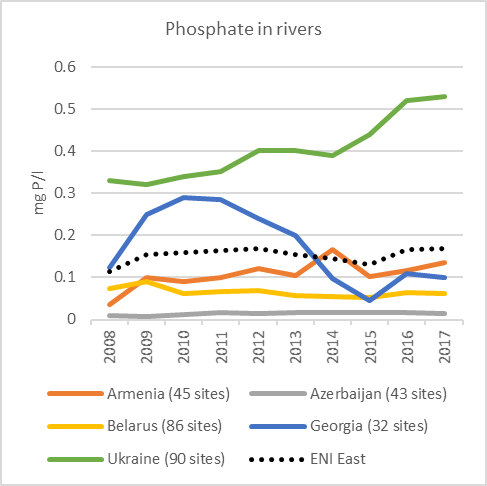 |
Data sources: Armenia: Environmental Monitoring and Information Center SNCO, Ministry of Nature Protection; Azerbaijan: National Environmental Monitoring Department of the Ministry of Ecology and Natural Resources; Belarus: National Environmental Monitoring System by the Ministry of Natural Resources and Environmental Protection; Georgia: National Environmental Agency of the Ministry of Environmental Protection and Agriculture; Environment Quality Monitoring Division of the State Hydrometeorological Service of the Ministry of Agriculture, Regional Development and Environment; Moldova: Ministry of Agriculture, Regional Development and Environment; Ukraine: Ministry of Ecology and Natural Resources.
Note: Only complete time series after inter/extrapolation are included.
-
Nitrate in rivers: Belarus (176 sites)
Phosphate in rivers: Belarus (176 sites)
Explanation: you used "Belarus (86 sites)", but 86 is the number of rivers with sites.
Data from eight lakes and reservoirs in Azerbaijan shows an abrupt increase and subsequent decrease for both phosphate and nitrate concentrations, starting in 2009 and 2007, respectively. Despite the decrease, the current levels are far higher than at the beginning of the time series in 2001. The overall decrease in nitrate concentrations in rivers was not observed for lakes and reservoirs.
In Georgia, there was a marked increase in both phosphate and nitrate concentration between 2004-2017. These increases were associated with sites in the Kura RBMU, where on average, phosphate concentrations were more than three times higher at the end of the time series, whilst nitrate concentrations doubled. Data from 2011-2013 should be treated with some caution, due to lower numbers of samples taken each year. This can explain the higher concentrations observed in these years. The concentrations for sites in the Black Sea RBMU have been fairly stable, with a slight decrease observed for nitrate.
Lake data were available for Lake Paliastomi, located close to the coast in the west of Georgia. Here phosphate concentrations decreased sharply from 2005 and have been relatively stable since 2008. The nitrate concentrations have been highly variable, with the lowest values observed between 2012 and 2014.
The time series data from Belarus starts in 1986. Since then, there has been an increase in average nitrate concentrations. This is observed both for the country as a whole and in the different regions. In the last decade there has only been a slow increase in nitrate concentrations. The maximum concentrations for river phosphate occurred between 1988-1990. Concentrations were also high between 2003-2004. Over the past decade, there has been an increase in phosphate concentrations in the Western Dvina and Neman RBMUs, and a decrease in the Western Bug and Dnieper RBMUs, but the overall trend is a slight decrease.
Average lake total phosphorus concentration in Belarus was highest between 1988-1995 and 2003-2007. The highest concentrations were observed in the Pripyat RBMU. Over the past decade, the average total phosphorus concentration decreased in all RBMUs.
In Moldova, there was a general decrease in nitrate concentrations in rivers, barring a peak in 1998. The general decrease can be related to a decrease in agricultural activities. Data were available for three lakes/reservoirs in Moldova. Total phosphorus concentration showed a steady decrease in the two reservoirs (Dubăsari Centrala Hidroelectrică and Costești Centrala Hidroelectrică) between 1992-2017. However, for Lake Ghidighici in the Chișinău area there was a marked increase between 2005-2012, with a subsequent decrease back to original levels. The increase might be related to a larger input of untreated urban waste water and higher fertilisation rates in agricultural activities.
The river nitrate concentration in Ukraine in 2000 was at about the same level as is at present, but there was a marked decrease after 2000 and then an increase, peaking in 2009. River phosphate concentrations were lower around 2009 but have increased since then and are currently more than 0.1 mg P/l higher than in 2000. The increase in the concentration of phosphate may indicate a lack of waste water treatment and an increase in the use of phosphate-based detergents. There is some variation in concentration patterns between the different rivers. In the Prut and Dniester rivers, both nitrate and phosphate concentrations have been decreasing.
6.2.2 Current state
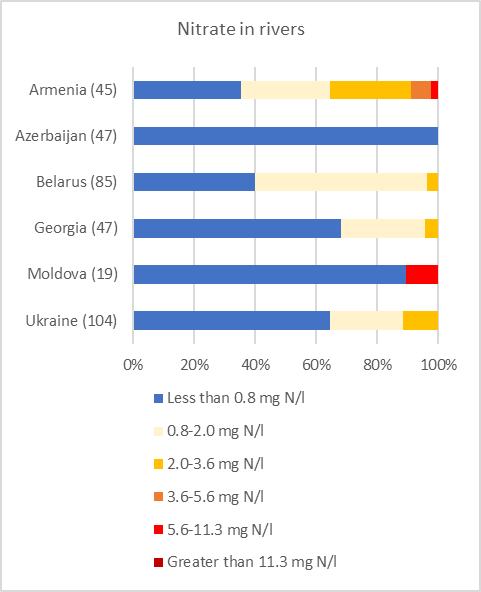
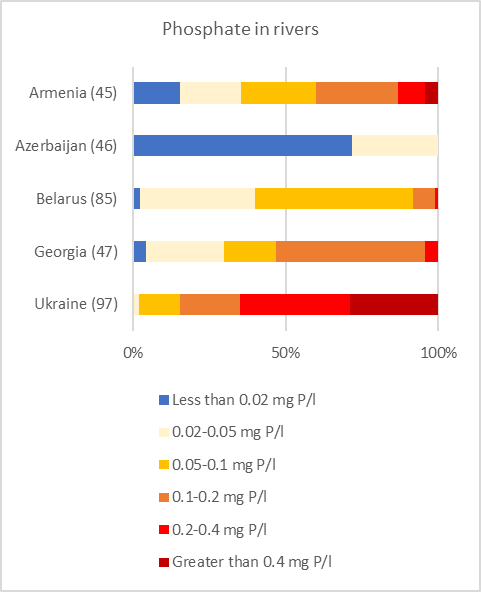
In Armenia, the current river nitrate concentration was in the range between 3.6-5.6 mg N/l at three sites and above 6 mg N/l at one site (Figure 24). These sites were found in the Hrazdan and Northern RBMUs which, along with the Akhuryan river basin, had the highest average nitrate concentrations (Figure 23: Average river nitrate and phosphate concentration for 2015-2017 by River Basin Management Unit.. About 36 % of the sites belonged to the lowest nitrate concentration class. For river phosphate, 40 % of the sites belonged to the upper three concentration classes. The average concentration was far higher in the Hrazdan and Akhuryan river basins. As seen for organic pollution, these river basins stand out with particularly high nutrient concentrations. These are the two most populated river basins with the two largest cities in the country, Yerevan and Gyumri. The waste waters of both cities discharge directly into the rivers due to lack of waste water treatment. Across all river basins, nutrient concentrations were generally higher downstream than upstream of settlements, due to emissions of waste water.
The four lake sites of Lake Sevan all had low nitrate concentrations. Additionally, the current total phosphorus concentration was relatively low (below 0.05 mg P/l), but if the increasing trend continues it may reach levels that can cause eutrophication.
Current phosphate and nitrate concentrations were generally low at river sites in Azerbaijan, and way below the national maximum allowable concentrations (1.1 mg P/l and 10 mg NO3-N/l, respectively). The nitrate concentration was always below 0.2 mg NO3-N/l. At 28 % of the sites (all in the Kura RBMU) phosphate concentrations were in the range 0.02-0.05 mg P/l. These sites should receive particular attention in terms of management measures to reduce nutrient pollution.
Low nitrate concentrations were also found in lakes and reservoirs, although concentrations were slightly higher than in rivers. Lake Shabran had nitrate concentrations above 0.8 mg NO3-N/l, and only Ceyranbatan reservoir was below 0.2 mg NO3-N/l. For phosphate, the difference between the sites was bigger, and three sites had current concentration above 0.1 mg P/l, which can be sufficient to cause eutrophication.
Figure 23: Average river nitrate and phosphate concentration for 2015-2017 by River Basin Management Unit.

Data sources: Armenia: Environmental Monitoring and Information Center SNCO, Ministry of Nature Protection; Azerbaijan: National Environmental Monitoring Department of the Ministry of Ecology and Natural Resources; Belarus: National Environmental Monitoring System by the Ministry of Natural Resources and Environmental Protection; Georgia: National Environmental Agency of the Ministry of Environmental Protection and Agriculture; Environment Quality Monitoring Division of the State Hydrometeorological Service of the Ministry of Agriculture, Regional Development and Environment; Moldova: Ministry of Agriculture, Regional Development and Environment; Ukraine: Ministry of Ecology and Natural Resources.
Note: RBMUs: 0 - Black Sea (MD), 1 - Black Sea (UA), 2 - Neman (BY), 3 - Western Bug (BY), 4 - Vistula (UA), 5 - Prut (MD), 6 - Prut (UA), 7 - Tisa (UA), 8 - Danube (MD), 9 - Danube (UA), 10 - Dnieper (BY), 11 - Desna (UA), 12 - Dnieper - upstream Kiev (UA), 13 - Pripyat (BY), 14 - Dnieper - downstream Kiev (UA), 15 - Dniester (MD), 16 - Dniester (UA), 17 - Southern Bug (UA), 18 - Western Dvina and Gulf of Finland (BY), 19 - Black Sea (GE), 20 - Kura (GE), 21 - Donets (UA), 22 - Hrazdan (AM), 23 - Northern (AM), 24 - Akhuryan (AM), 25 - Southern (AM), 26 - Sevan (AM), 27 - Ararat (AM), 28 - Terek (GE), 29 - Aras (AZ), 30 - Kura (AZ), 31 - Caspian Sea (AZ). No data are available for uncoloured RBMUs.
Figure 24: Distribution of river monitoring sites to nitrate (top) and phosphate (bottom) concentration classes in the ENI East countries, based on the average of annual mean concentrations for 2015-2017
 |
 |
Data sources: Armenia: Environmental Monitoring and Information Center SNCO, Ministry of Nature Protection; Azerbaijan: National Environmental Monitoring Department of the Ministry of Ecology and Natural Resources; Belarus: National Environmental Monitoring System by the Ministry of Natural Resources and Environmental Protection; Georgia: National Environmental Agency of the Ministry of Environmental Protection and Agriculture; Environment Quality Monitoring Division of the State Hydrometeorological Service of the Ministry of Agriculture, Regional Development and Environment; Moldova: Ministry of Agriculture, Regional Development and Environment; Ukraine: Ministry of Ecology and Natural Resources.
Note: The number of monitoring sites per country is given in parenthesis.
Most of the Georgian river sites were in the lowest nitrate concentration class (68 %), and there were no sites in the three highest classes. For phosphate, nearly half of the sites (49 %) had current concentrations between 0.1-0.2 mg P/l, and there were also two sites in the second highest class. The average phosphate concentration was highest in the Kura river basin, where 64 % of the sites were above 0.1 mg P/l. This is considered sufficiently high to cause eutrophication. Nitrate concentrations were high in the Kura river basin, but overall nitrate concentrations were relatively low. The current phosphate and nitrate concentrations never exceeded the national maximum permissible concentrations (10.2 mg NO3-N/l for cyprinid waters, 9.0 mg NO3-N/l for salmonid waters, and 1.1 mg P/l). These thresholds are, however, very high compared to EU standards, and do not necessarily reflect poor ecological conditions of the water bodies.
The current concentrations of nitrate and phosphate in Lake Paliastomi are low. According to available data for 2016-2017, the concentrations were generally low, and far below the national threshold (50 mg NO3/l, in line with the EU Drinking Water Directive 98/83/EC). All but one monitoring site had an average concentration below 10 mg NO3/l.
In Belarus, all the river sites were in the low nutrient concentration classes. The highest average concentrations were found in the Dnieper and Neman river basins. Also for phosphate, the vast majority of river sites were in the three lowest classes. The sites with concentrations above 0.1 mg P/l were found in the Dnieper, Pripyat, Neman and Western Bug river basins. The highest average phosphate concentration was in the Western Bug. Overall, the current phosphate concentration exceeded the national maximum permissible concentration (0.066 mg P/l) at 38 % of the sites. Current total phosphorus concentrations above 0.1 mg P/l were only observed for seven lakes. High phosphorus concentrations can in some cases be related to direct discharges of waste water into lakes.
In Moldova, all but two river sites were in the lowest nitrate concentration class. The two sites with higher concentration (5.9 and 6.7 mg NO3-N/l) were both in the Danube RBMU. Moldova did not provide phosphate data for rivers, but the total phosphorus data show that the situation is worse than for nitrate. More than half (58 %) of sites had total phosphorus concentrations above 0.1 mg P/l, and out of these three were above 0.4 mg P/l.
The three lakes/reservoirs in Moldova all belong to the lowest nitrate concentration class. Lake Ghidighici had the highest current total phosphorus concentration (0.19 mg P/l). The two reservoirs were both below 0.1 mg P/l.
In Ukraine the majority (64 %) of river sites were in the lowest concentration class for nitrate, and there were no sites in the three highest concentration classes. The highest average concentration was found in the Danube, Donets and Vistula river basin in Ukraine. River phosphate concentrations were generally high, with 85 % of the sites in the three highest classes, including 28 sites with concentrations higher than 0.4 mg P/l. The Donets river basin had the highest average concentration, with all sites in the highest concentration class. However, all river basins except the Prut and the Tisa had average concentration above 0.1 mg P/l.
BOD in rivers: Belarus (176 sites)
Ammonium in rivers: Belarus (176 sites)