
Post a comment on the text below
Agricultural land use in potential river floodplain
To incorporate the hydromorphological alteration caused by agriculture, the area of agricultural land located in the potentially flood-prone areas was calculated as an average of the years 2011 to 2013 (EEA, 2020; Figure 6). It was derived from two spatial layers, (1) the JRC flood hazard map for Europe 100- year return period, compiled with the flood model ‘LisFlood’ (Bates & De Roo, 2000; Alfieri et al., 2014) and (2) the Copernicus Potential Riparian Zone layer compiled with data from the Copernicus Land Monitoring Service (EEA, 2015; CLMS, 2019). This proxy-indicator allows for an estimate of various farming-related pressures on the freshwater ecosystems and can be interpreted as the probability of morphological alterations to surface waters due to agricultural activities, e.g. drainage of floodplain area caused by agricultural production.
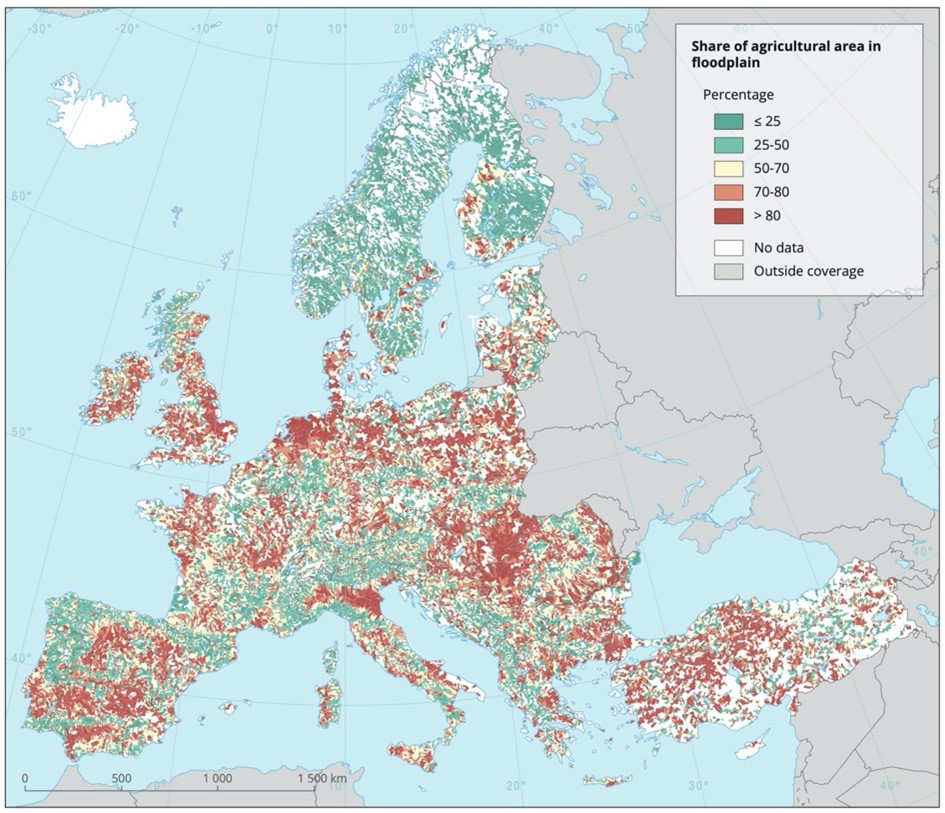
Figure 6: Geographical distribution of the share of agricultural land in floodplain areas, calculated by FEC
You cannot post comments to this consultation because you are not authenticated. Please log in.