
Table of contents
Annex 1: Linking composite pressures to agricultural drivers
The composite pressure index allows for analysing the interrelations of driving forces, pressures, states, impact and responses according to the DPSIR analytical framework. In this annex, we exemplarily demonstrate the assessment potential by analysing the relationship between agricultural production and the intensity of composite pressures from agriculture at the pan-European scale.
Data basis: Agricultural production
The agricultural crop yields (tons per hectare; reference years: 2016, 2017), livestock population density (heads of individual livestock types per hectare and ‘Livestock Units’ [LSU] as an indicator aggregating from various livestock types and ages; reference year: 2016) were mapped based on Eurostat (EUROSTAT, 2019a; 2019b; 2019c; 2019d). These agricultural production data were largely available at NUTS2-level and supplemented by data at NUTS1- and NUTS0-level, where necessary. Ten crop types (Table A.1) and the following four livestock types were delineated: Cattle, dairy cattle, pigs, poultry.
Table A.1: Crop types, crop codes and share of production area in 2015
|
Group |
Crop type |
Crop code |
Production area (%) |
|
‘Ubiquitous’ crops |
Cereals for the production of grain (including seed) |
C0000 |
52.4 |
|
Plants harvested green from arable land |
G0000 |
18.8 |
|
|
Industrial crops |
I0000 |
11.5 |
|
|
Root crops |
R0000 |
2.9 |
|
|
Dry pulses and protein crops for the production of grain |
P0000 |
2.0 |
|
|
Fresh vegetables (including melons) and strawberries |
V0000, S0000 |
2.0 |
|
|
Permanent crops for human consumption |
Olives |
O1000 |
4.6 |
|
Grapes |
W1000 |
2.9 |
|
|
Fruits, berries and nuts |
F0000 |
2.3 |
|
|
Citrus fruits |
T0000 |
0.5 |
Linking agricultural production to BEARs
For each of the ten crop-related BEARs (see Table 2 in the main text above), the yields of all crop types produced in a FEC (tons per hectare) were summed up and the median value of total crop yields per BEAR was calculated as a simple proxy for agricultural productivity. To characterize the main crop patterns cultivated in each BEAR, the dominant crop type shares contributing to the total crop yield were also determined. For each of the five livestock-related BEARs, the median values of LSU and the four livestock BEARs were calculated.
Relating agricultural production and pressure
To analyse the connection between agricultural production and pressure, the median values of total crop yields per BEAR and the median values of LSU, respectively, were correlated with the pressure index using Spearman Rank Correlation.
Agricultural crop production
Substantial differences in the total crop yields across BEARs can be observed (see Table 2 above), with overall highest yields for ‘Western intensive cropland‘ and lowest yields for ‘Extensive grassland and fallow farmland‘. Regarding individual crop types, all BEARs feature considerable shares of root crops, with these crops being dominant in all Western, Northern and Highland BEARs and ‘Eastern intensive cropland’. ‘Eastern extensive cropland’ shows largest shares of cereal yields, while the Mediterranean BEARs are dominated by yields of either citrus fruits or industrial crops.
Agricultural animal production
Comparing across all five livestock-related BEARs, the two Western regions show pronounced cattle densities, also reflected by the aggregated indicator ‘Livestock Units’ (Table A.2). ‘Western intensive livestock farming’ features overall highest cattle densities, including dairy cattle. The production of pigs and poultry is almost evenly distributed across the five BEARs.
Table A.2: Overview of the livestock production of the five BEARs including livestock farming (median values of Livestock Units [LSU] and heads per hectare)
|
BEAR |
LSU1 |
Pigs |
Cattle |
Dairy cattle |
Poultry |
|
Western intensive livestock farming |
1.21 |
0.43 |
1.53 |
0.15 |
2.55 |
|
Western extensive livestock farming |
0.80 |
0.18 |
0.73 |
0.06 |
2.23 |
|
Eastern livestock farming |
0.32 |
0.47 |
0.19 |
0.05 |
3.24 |
|
Northern and Highlands livestock farming |
0.48 |
0.30 |
0.38 |
0.06 |
2.39 |
|
Mediterranean livestock farming |
0.35 |
0.35 |
0.17 |
0.01 |
2.78 |
1The reference unit used for the calculation of livestock units (=1 LSU) is the grazing equivalent of one adult dairy cow producing 3,000 kg of milk annually.
Relating agricultural production and pressure
For the crop-related BEARs, the total crop yield and the composite multi-pressure index were significantly correlated (Spearman R = 0.76, p=0.011; Figure A.1). Root crops dominate the harvest yields of all BEARs except for the Mediterranean large-scale permanent and extensive cropland. In these two, industrial crops contribute the largest share to the total crop yield. Significant amounts of industrial crops are also harvested in the Mediterranean intensive cropland, while citrus fruits contribute a considerable share in the Mediterranean large-scale permanent cropland. Plants harvested green are harvested in almost all BEARs. It has to be noted that this weight-based characterization of crop patterns favours crops with a high specific weight (such as root crops) compared to crops with a low specific weight (such as cereals).
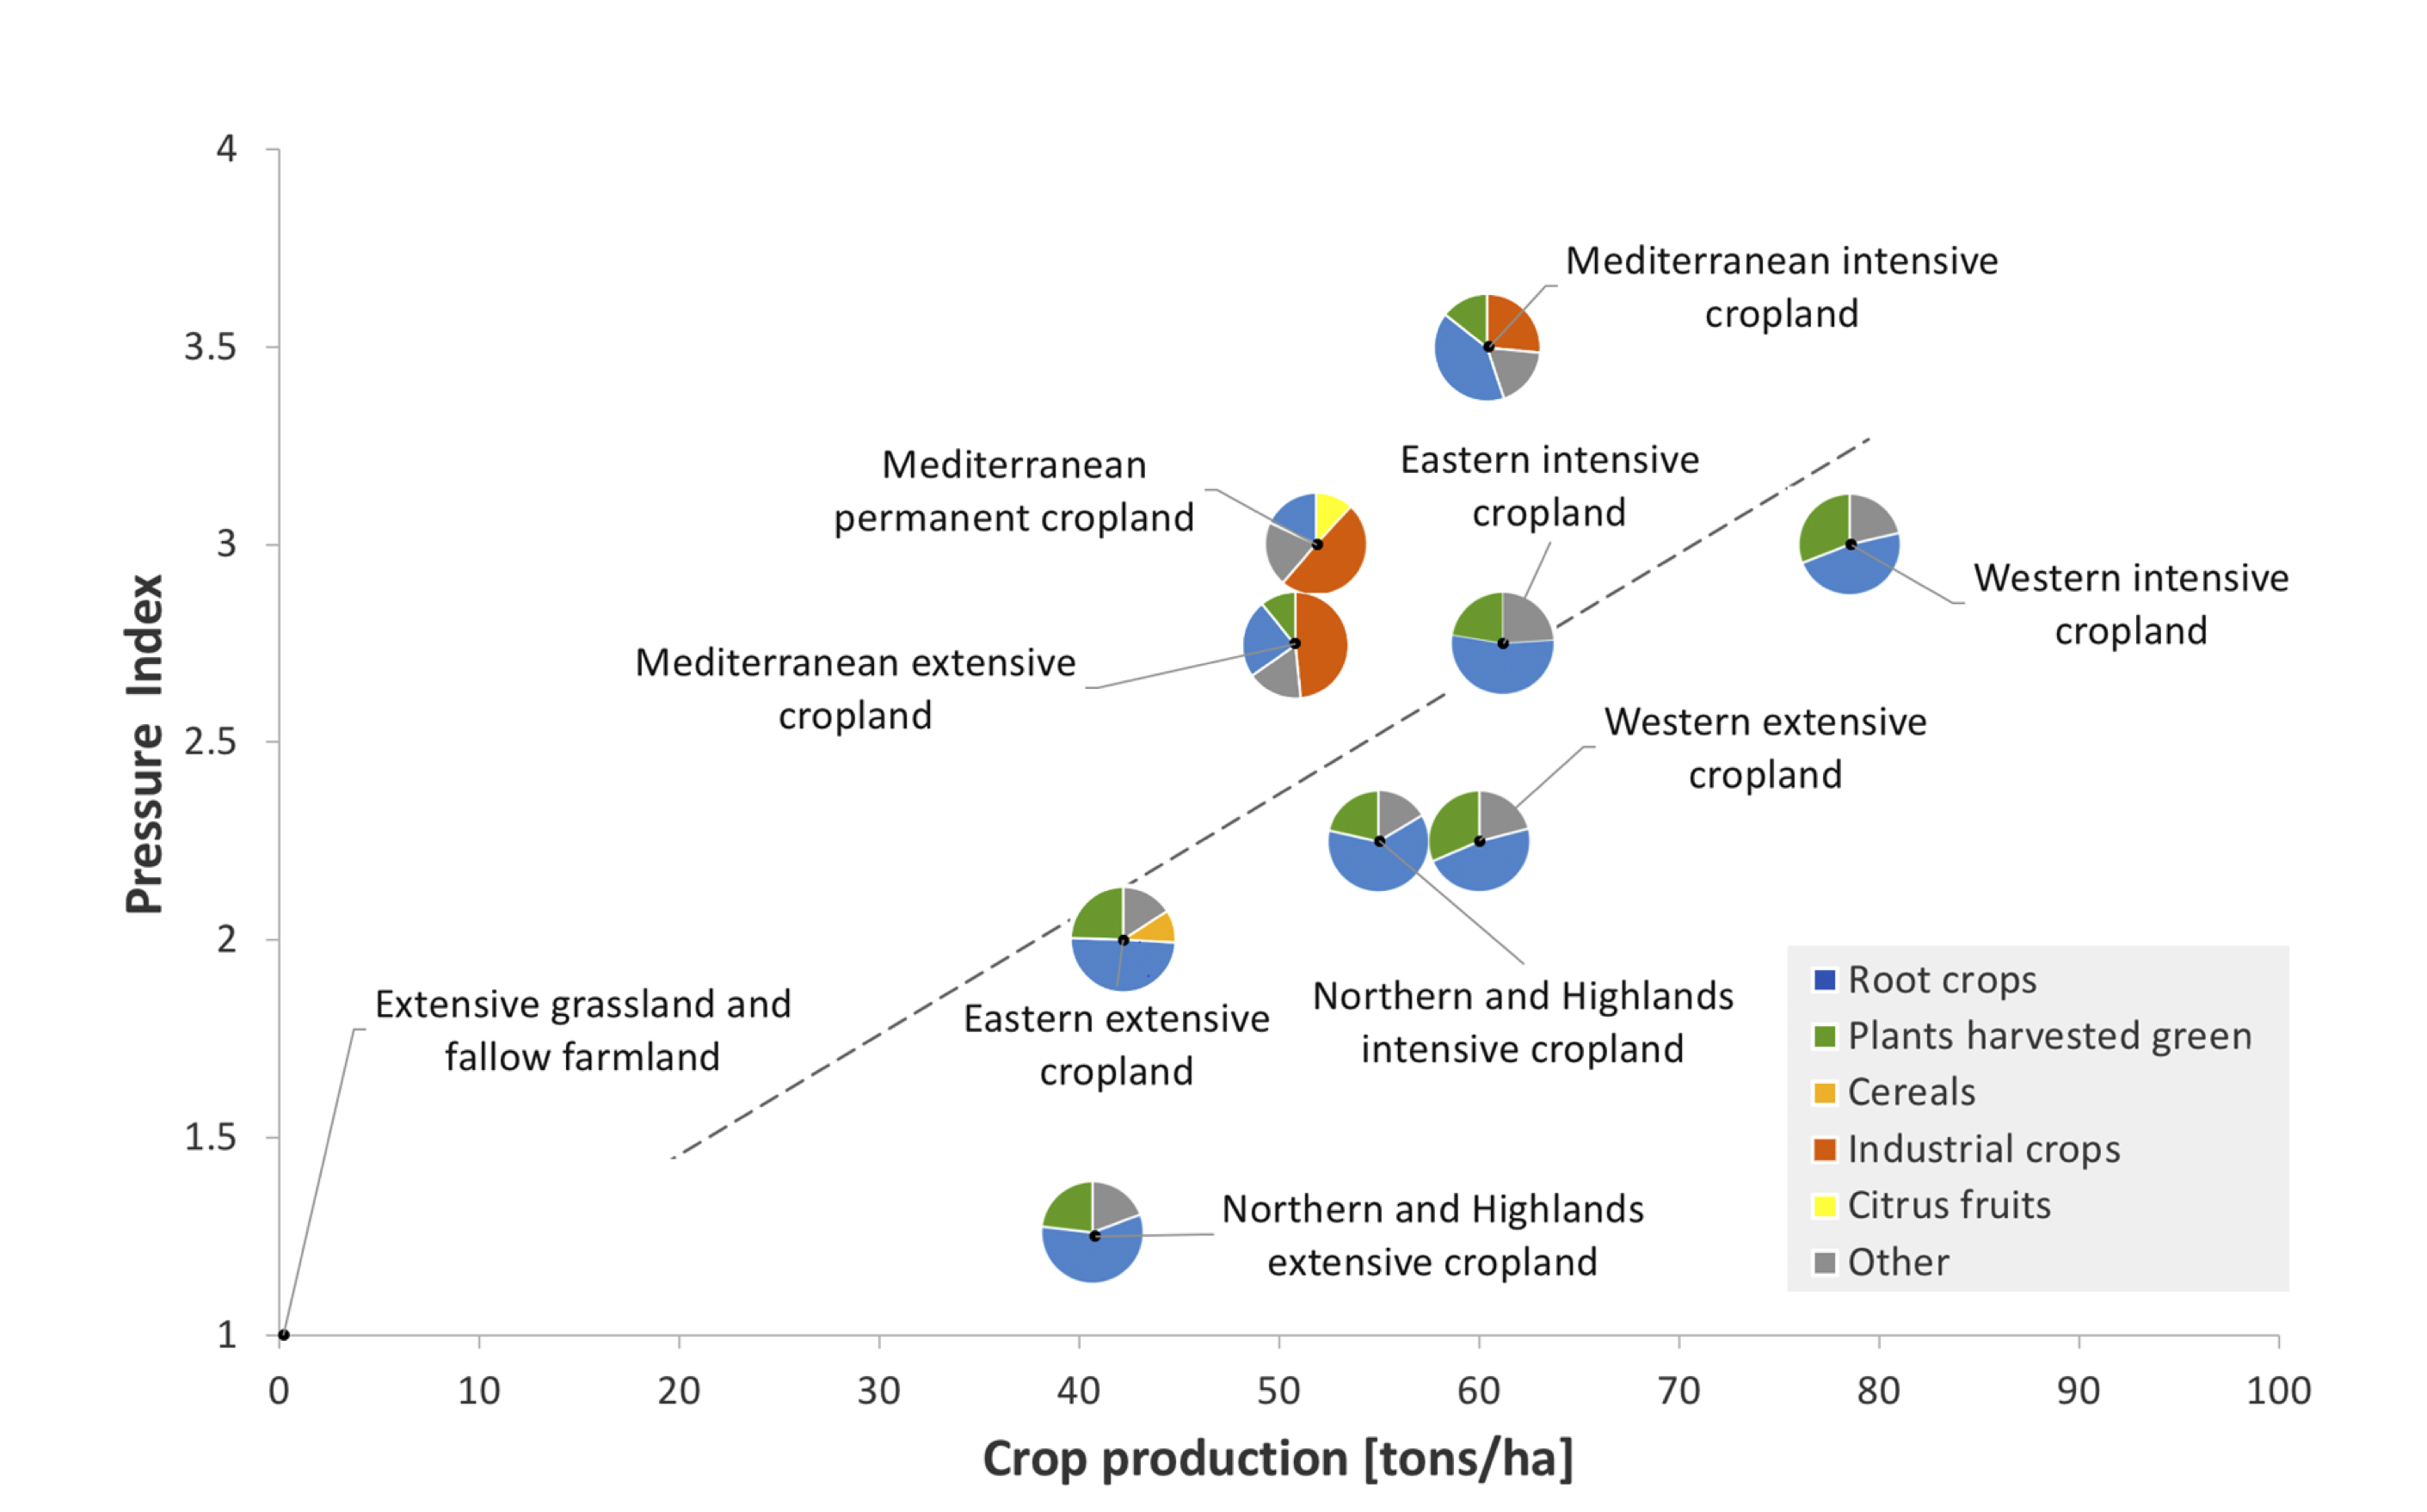
Figure A.1: Correlation of the total crop production (tons per hectare) and the composite multi-pressure index for each crop-related Broad European Agricultural Region (BEAR). The share of crop types produced in each BEAR is shown by the pie-charts.
For the livestock-related BEARs, animal density (expressed as LSU) and pressure index showed no significant correlation, but ‘Western intensive livestock’ featured higher pressure levels than all other BEARs (Figure A.2).
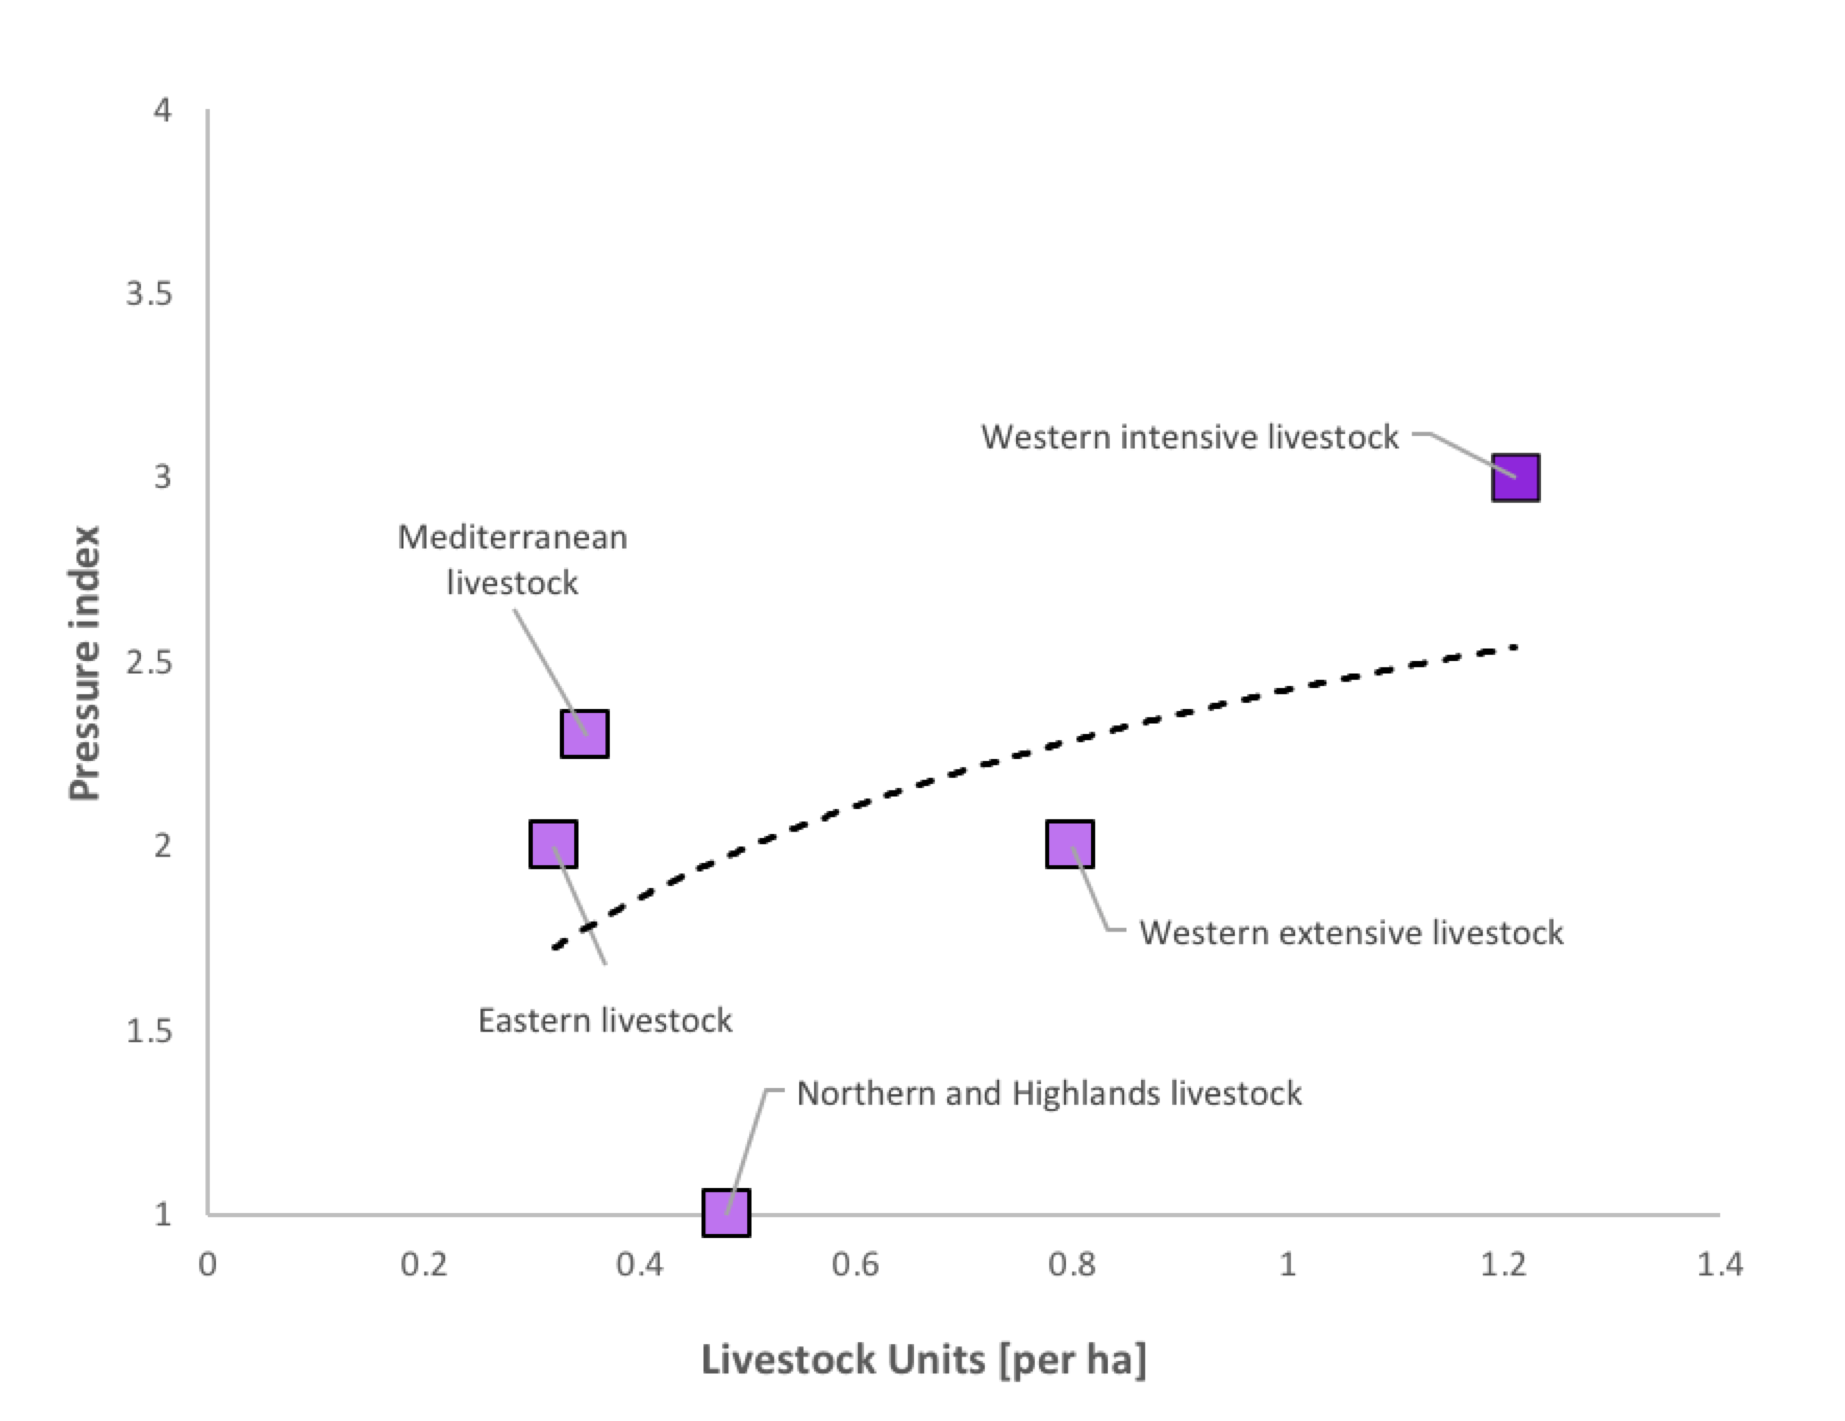
Figure A.2: Correlation of Livestock Units (per hectare) and the composite multi-pressure index for each livestock-related Broad European Agricultural Region (BEAR)