
Navigation
Notifications
Post a comment on the text below
Map 1.1 The Combined Drought Indicator (CDI) for the last dekad of July 2018 (left) and the second dekad of September 2018 (right)
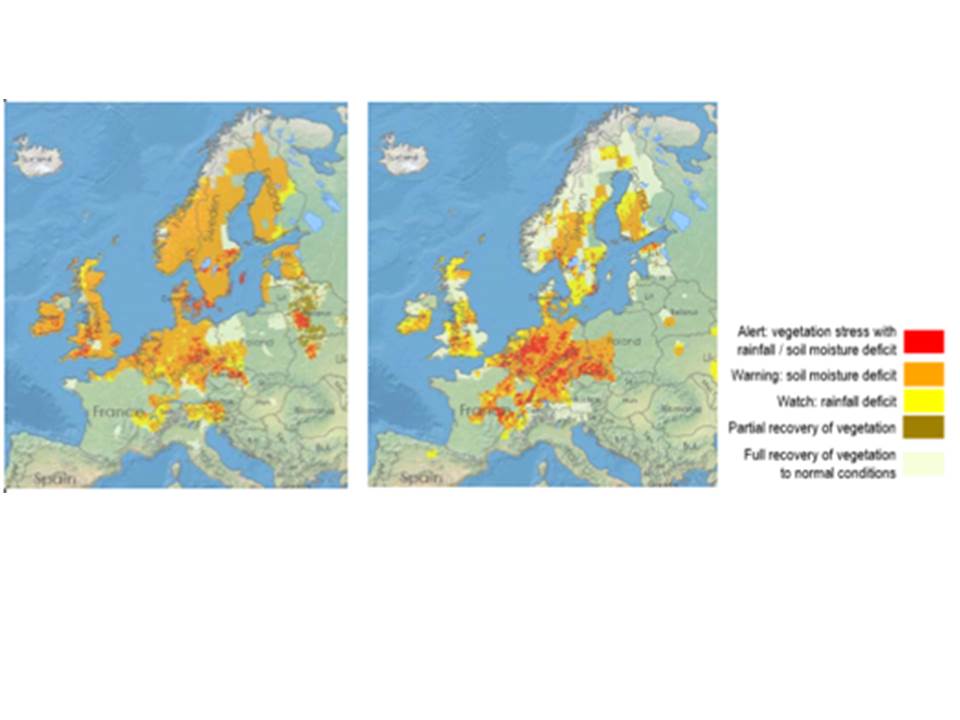
Source: (JRC, 2020a)
You cannot post comments to this consultation because you are not authenticated. Please log in.
Previous comments
The resolution of this figure is poor.
One can ask if it is appropriate to use a figure showning risk illustrating a text of factuel content?
We will take care of using the high resolution of the map in the published version.