
Navigation
Notifications
Post a comment on the text below
Figure 3.1 Development of water availability per capita (m3/capita – 2000-2017)
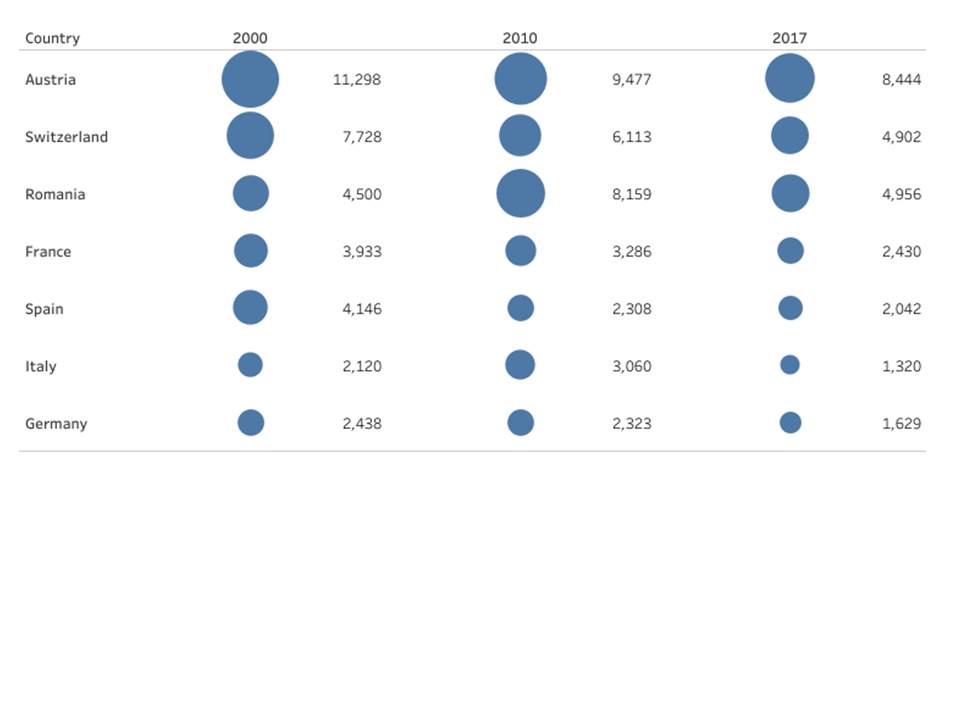
Source: (EEA, 2020j, 2019l; Eurostat, 2020f)
You cannot post comments to this consultation because you are not authenticated. Please log in.
Previous comments
Relation to population growth should be incorporated in the figure. It is mentioned in the text below, but if taking the figure without the expanatory text, the explanation is lost.
This has been clarified in the new version of the Report (Chapter 5).