
Navigation
Notifications
Post a comment on the text below
Map 3.2 Historic trends in annual and summer precipitation across Europe between 1960-2015
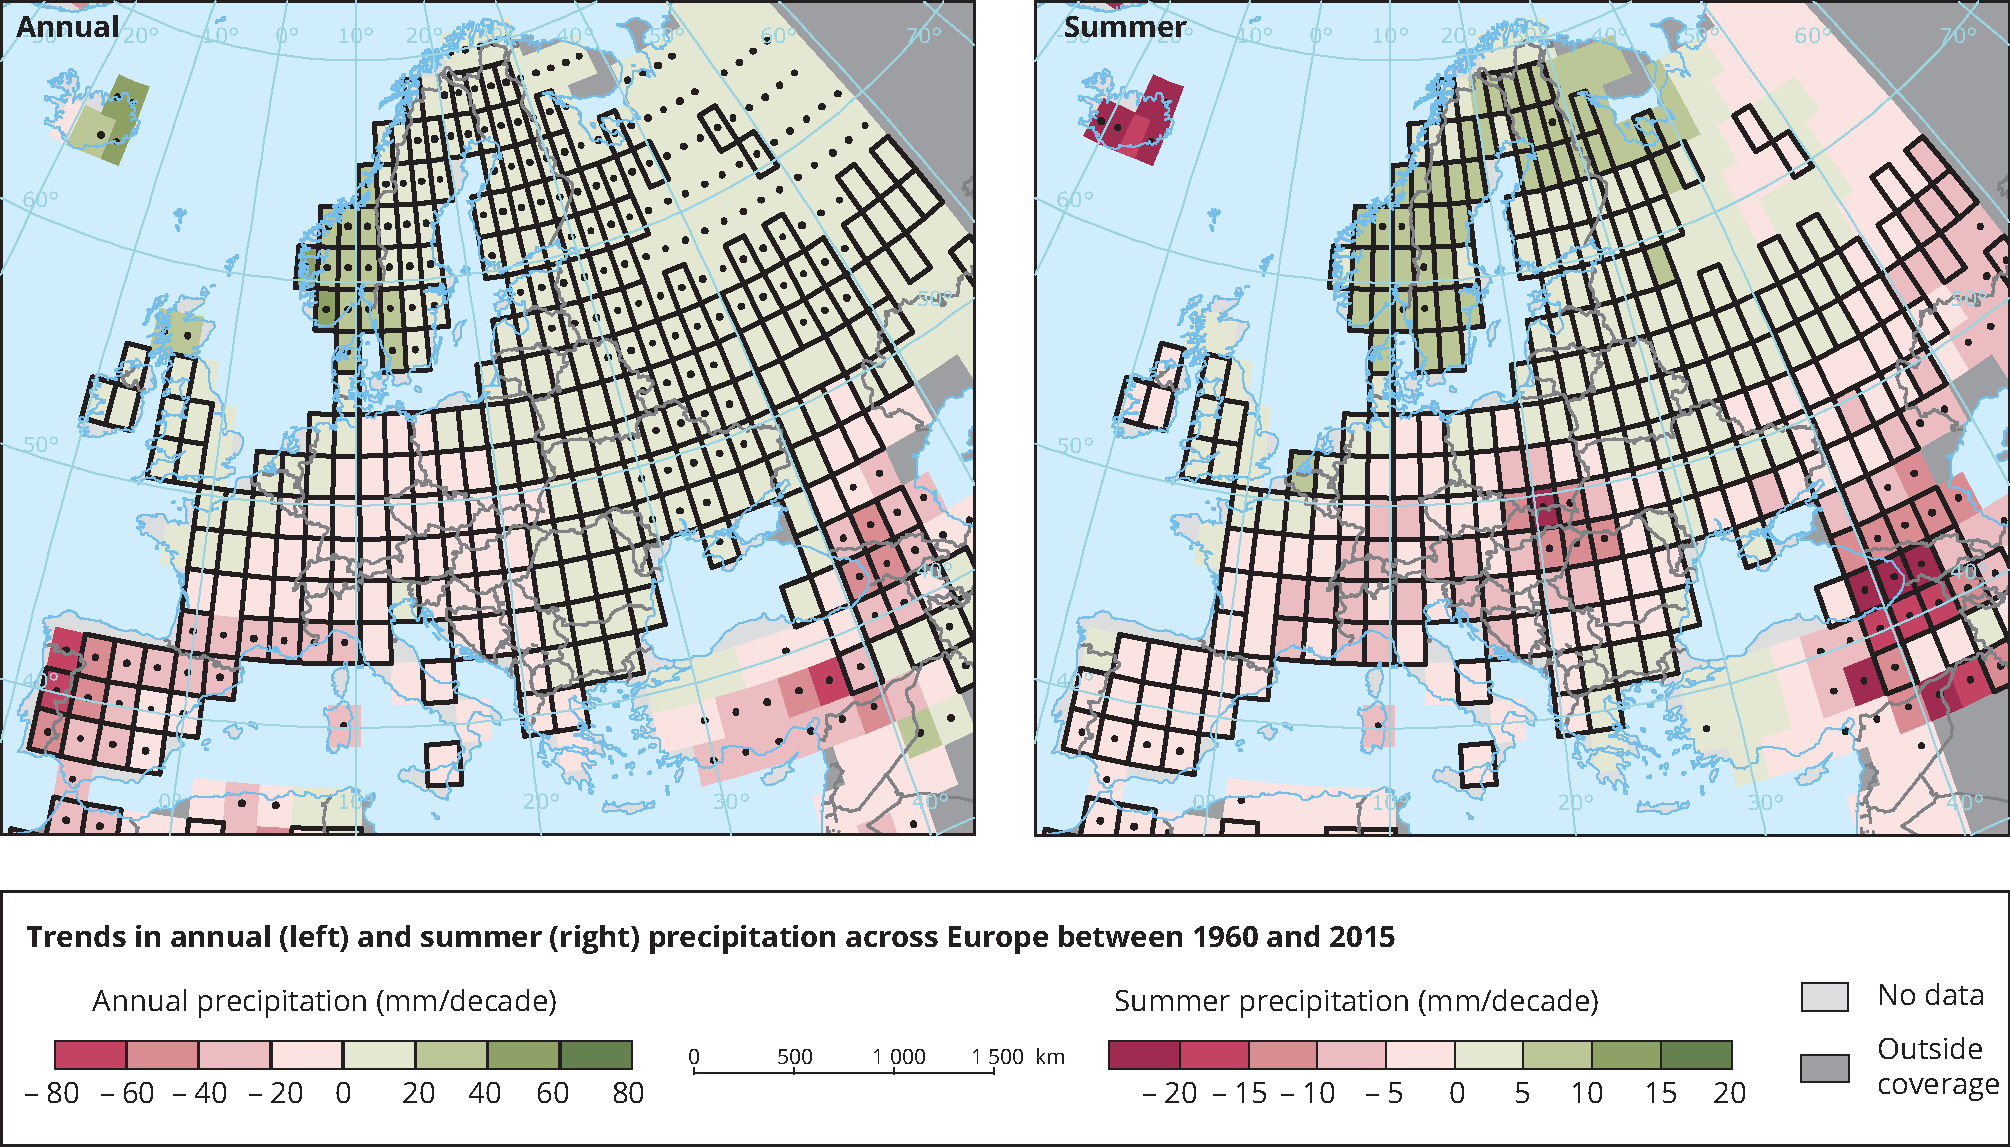
Source: Source: (EEA, 2017e)
Note: Boxes outlined in black indicate areas with at least three stations, so they are more likely to be representative; Areas with significant long-term trends are indicated by black dots.
You cannot post comments to this consultation because you are not authenticated. Please log in.