
Navigation
Notifications
Post a comment on the text below
Figure 4.2 Water abstraction by source of water in Europe (2017)
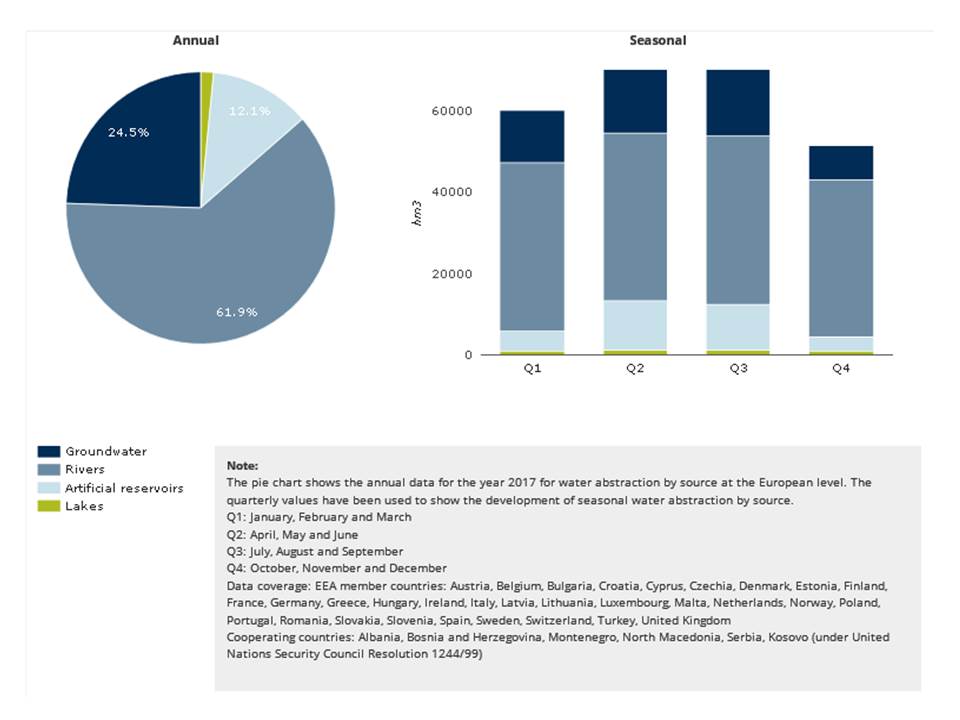
Source: (EEA, 2018b)
You cannot post comments to this consultation because you are not authenticated. Please log in.
Figure 4.2 Water abstraction by source of water in Europe (2017)
Source: (EEA, 2018b)
You cannot post comments to this consultation because you are not authenticated. Please log in.
Previous comments
Addditional to Figure 4.2 we would like a figure - e.g a map showing for each country how large a portion groundwater is of the total water abstraction. The historical trend in these numbers would also be nice to see.
Thanks for this suggestion. We will consider this in developing the dashboard on water resources in the second half of the year.