
Navigation
Notifications
Post a comment on the text below
Figure 4.11 Comparison of regional trends between water consumption and economic growth for the energy sector.
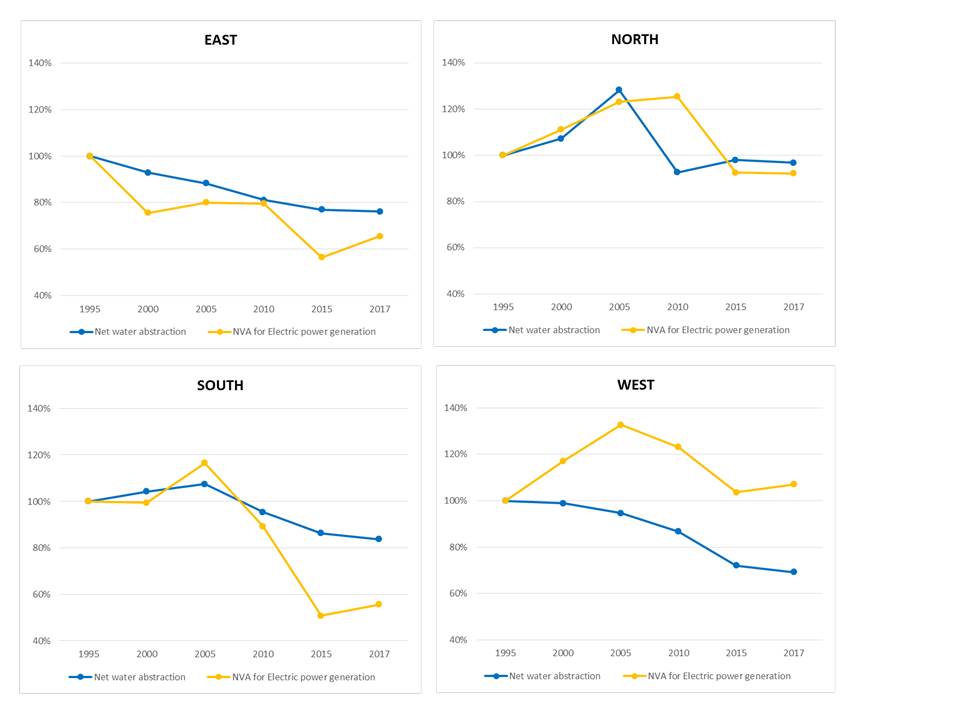
Data sources: (EEA, 2020j, 2019l; Eurostat, 2020f, 2020a)
Note: Blue line – Water consumption volume in million m3 (indexed 1995=100); Yellow line – Net Value Added in million Euros excluding renewables (indexed 1995=100)
You cannot post comments to this consultation because you are not authenticated. Please log in.