Table of contents
1. Indicator assessment
EU level
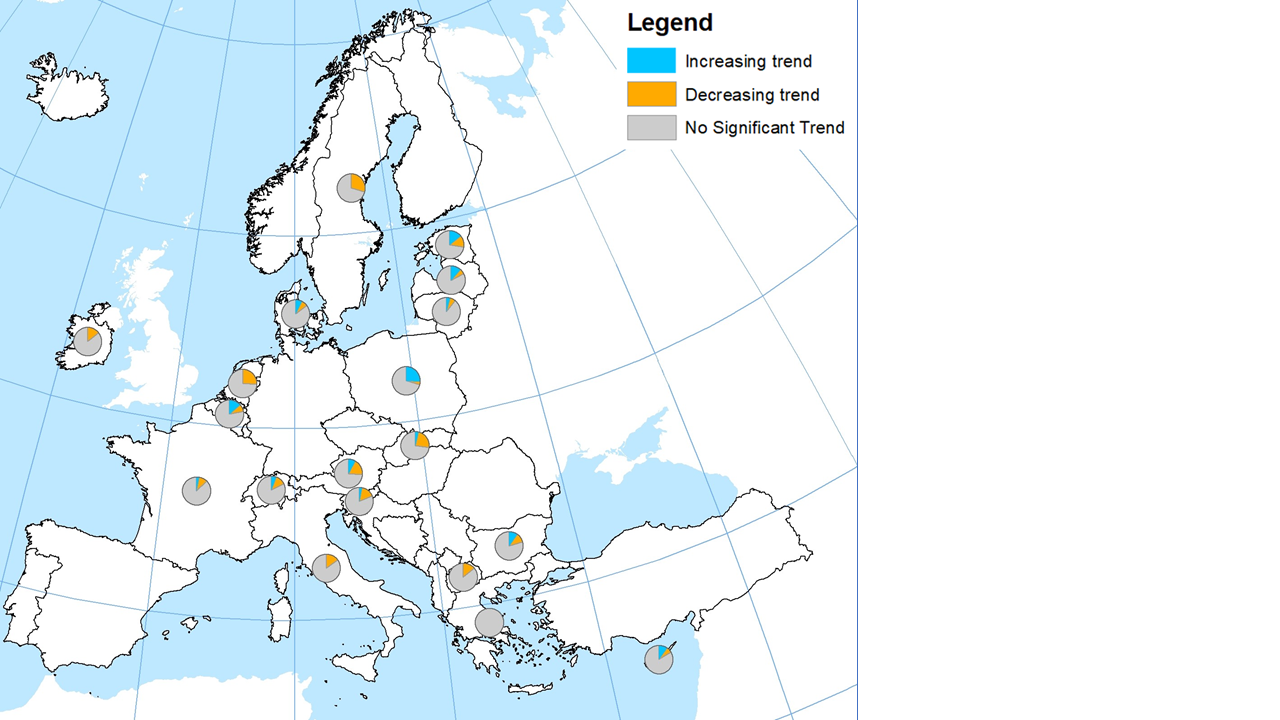
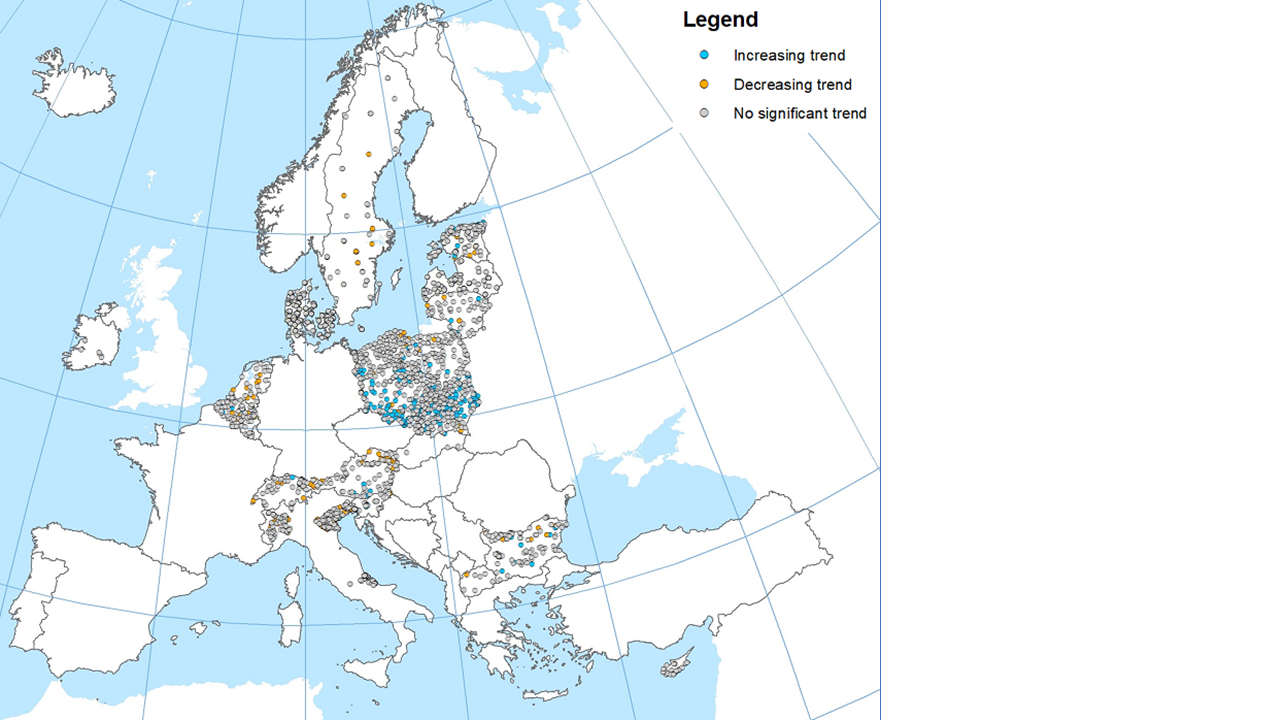
The indicator assesses the annual groundwater level change across Europe, for the period 2000-2019 based on WISE SoE data. The underlying data needs to be improved by Eionet member countries to enable more robust assessment on the change in groundwater level in Europe. A significant trend with annual groundwater level has not been detected for 81% of the monitoring stations mostly due to the short length of available time series. For the remaining 19% of stations, nearly half showed a decreasing trend mostly in southern and western Europe and increasing trend mainly in Eastern Europe. Northern Europe show an equal share of increasing and decreasing trends (Figure 1a).

Note: Numbers in brackets indicate the number of monitoring stations available for trend analysis. Decreasing groundwater level trends (orange) range between -0.01 metres and more than -2 metres per year. Increasing groundwater levels trends (blue) range between +0.01 metres per year and more than +2 metres per year. UN M49 standard is used for grouping the countries where data is available for the indicator assessment: Eastern Europe - Bulgaria, Poland, Slovakia; Northern Europe: Denmark, Estonia, Ireland, Lithuania, Latvia, Sweden; Southern Europe: Cyprus, Greece, Italy, North Macedonia, Slovenia; Western Europe: Austria, Belgium, France, Netherlands, Switzerland.
The Groundwater Level Trend indicator assesses the annual groundwater level change across Europe, covering the period 2000-2019 based on WISE SoE Water quantity data reported by EEA member countries.
For 81% of the monitoring stations, the annual groundwater level doesn’t present a significant trend. This may give the false impression that no groundwater level trends occur in certain regions or countries. The short length of the available timeseries may have affected this result.
For 9% of the monitoring stations a trend downwards was observed, while 10% of the monitoring stations showed a trend upwards. Although, occasionally, increases and decreases may exceed 2 metres per year, the groundwater level increases or decreases most commonly range up to 0.2 metres per year.
At stations in Southern and Western Europe with a significant trend, the groundwater level is mostly decreasing (Figure 1). For Southern Europe, this is probably caused by 1) reduced groundwater recharge, increasing drought frequency and severity (Spinoni et al., 2017) and/or 2) seasonal over abstraction from groundwater resources (EEA, 2019). For Western Europe decreasing groundwater levels are probably caused by 1) relatively high use of groundwater resources and/or 2) reduced groundwater recharge due to intensive drainage of agricultural and expansion of urban areas (Hendriks et al., 2015). The decreasing groundwater levels lead to higher risks of degradation of biodiversity dependent on groundwater resources, such as wetlands, less productivity of crop yield, salt water intrusion, soil subsidence, and greenhouse gas emissions e.g. in peat areas. On the longer term, drinking water supply and water supply for industries (mainly food and beverage sector) may become limited.
In Eastern Europe, around 23 percent of stations show increasing trend with the groundwater. This might be related to the decrease of pressure on groundwater resources due to population decrease in past decades (EEA, 2019 – CSI 018). Furthermore, observed increases in precipitation may play a role (EEA, 2017 – CLIM 002). The increasing groundwater level may lead to an increase in flood risks, damaging public infrastructure and basements of buildings. In addition, it may cause plant oxygen stress resulting in reduced crop yields because of causing plant oxygen stress. On the other hand, if initial groundwater levels were low, an upward trend can also have positive consequences, such as the replenishment of aquifers.
In Northern Europe, the monitoring stations show more local variations in groundwater level trends, rather than a general trend at the regional level; where some monitoring stations show decreasing trend whereas some others increasing trend.
It should be noted that spatial coverage and the assessment of this indicator, particularly for Southern Europe, is very limited due to lack of reported data.
Country level
In all 19 countries assessed, the groundwater level did not show any significant trend at most stations (70-100%).
Ireland, Sweden, The Netherlands, and North Macedonia only have stations with no significant or decreasing trend (see Figure 1b and Figure 2a).
Poland and Latvia only have stations with no significant or increasing trend (see Figure 1b, 2a and 2b ).
In Austria, France, Italy, Slovenia, Slovakia, and Switzerland, most of the stations show a decreasing trend of the groundwater level, although there are also some stations with an increasing trend (see Figure 1b and Figure 2a).
Belgium, Bulgaria, Cyprus, Denmark, Estonia and Lithuania show about the same number of stations with an increasing and a decreasing trend (see Figure 1b and Figure 2a).
Greece only has one station with enough information to calculate the Groundwater Level Trend, and this station shows no significant trend (see Figure 1b and Figure 2a).
It has to be underlined that, the current data available in the WISE SoE Water quantity needs to be improved for more robust assessment of groundwater level changes. Therefore, EEA encourages the Eionet member countries to improve data reporting on the groundwater level to the WISE SoE water quantity for expanding spatial and temporal coverage of the indicator.
Figure 1b. Groundwater level changes in European countries over the period 2000-2019

Note: Numbers in brackets indicate the number of monitoring stations available for trend analysis. Decreasing groundwater level trends (orange) range between - 0.01 metres and more than - 2 metres per year; Increasing groundwater levels trends (blue) range between +0.01 metres and more than +2 metres per year.
Figure 2a. Groundwater level changes in European countries over the period 2000-2019
Note: Numbers in brackets in the text of this note indicate the number of monitoring stations where data are available for trend analysis. Geographical coverage (UN M49 standard): Eastern Europe – Bulgaria (116), Poland (792), Slovakia (26); Northern Europe: Denmark (524), Estonia (212), Ireland (7), Lithuania (47), Latvia (268), Sweden (64); Southern Europe: Cyprus (31), Greece (1), Italy (301), North Macedonia (7), Slovenia (32); Western Europe: Austria (114), Belgium (90), Switzerland (34), France (1214), Netherlands (27). Decreasing groundwater level trends (orange) range between - 0.01 metres per year and more than - 2 metres per year; Increasing groundwater levels trends (blue) range between +0.01 metres per year and more than +2 metres per year.
Figure 2b. Groundwater level changes at monitoring locations in European countries over the period 2000-2019
Note: Decreasing groundwater level trends (orange) range between -0.01 metres per year and more than -2 metres per year; Increasing groundwater levels trends (blue) range between +0.01 metres per year and more than +2 metres per year.
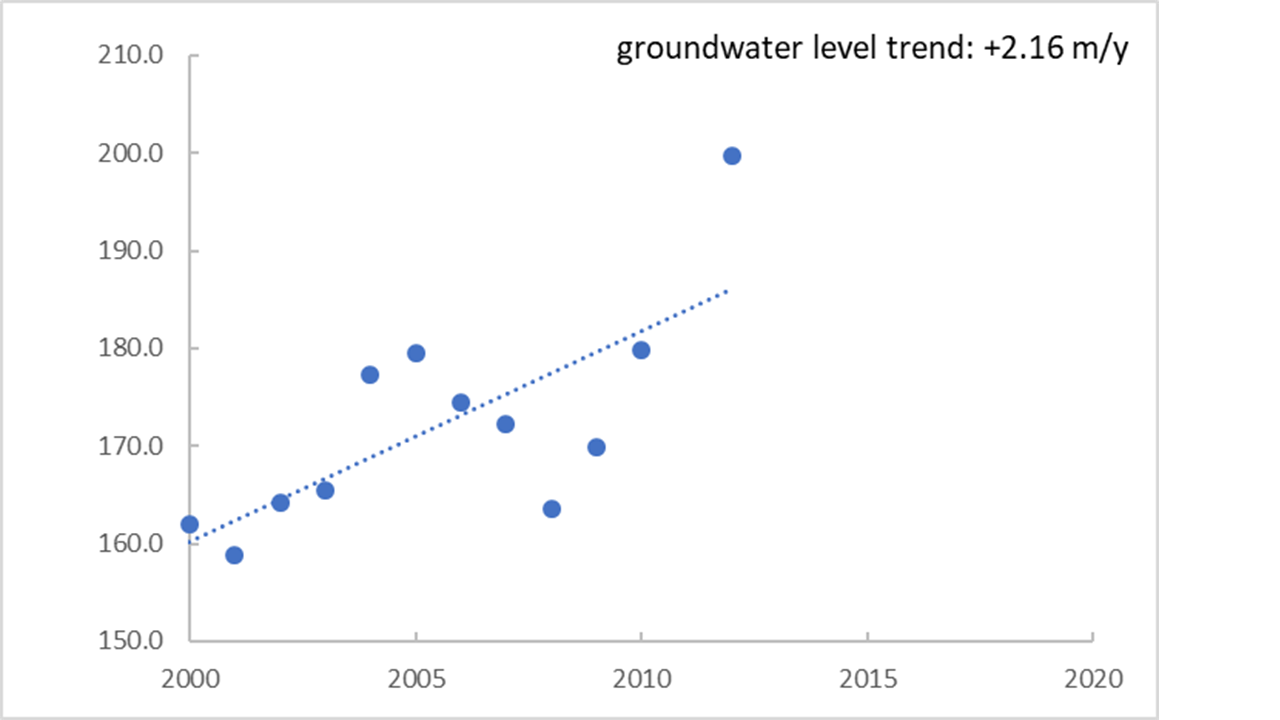
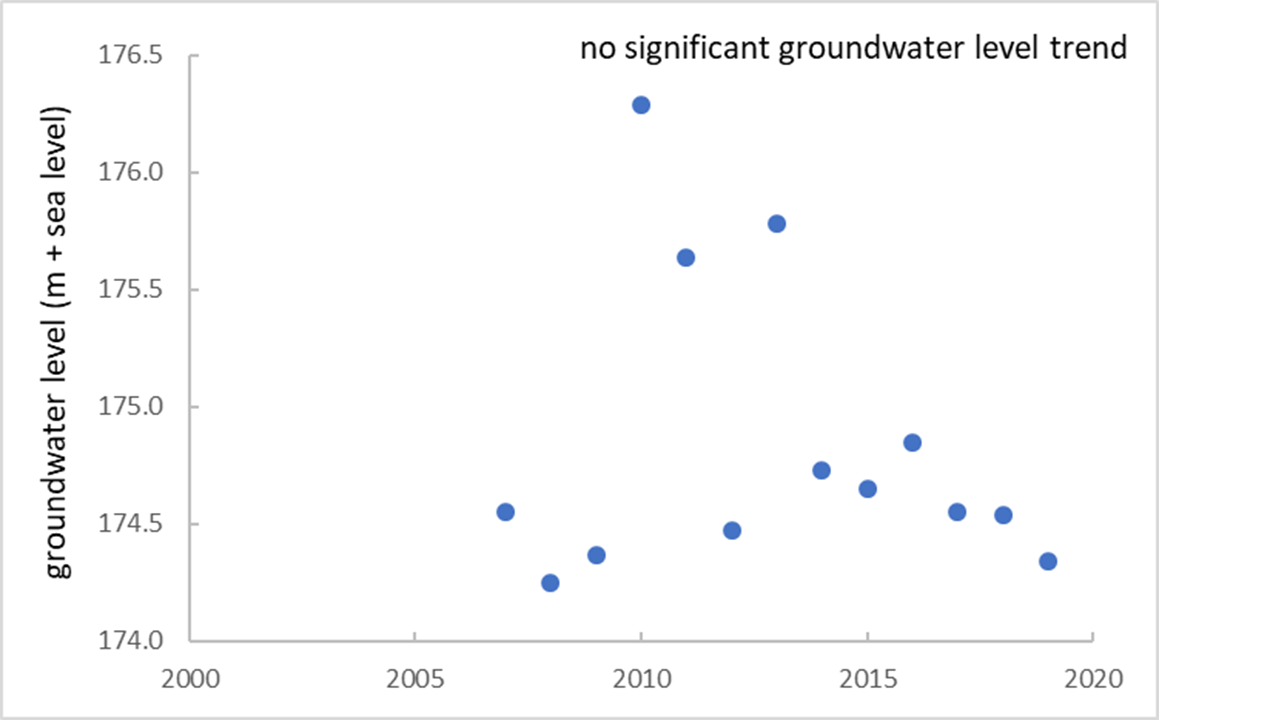
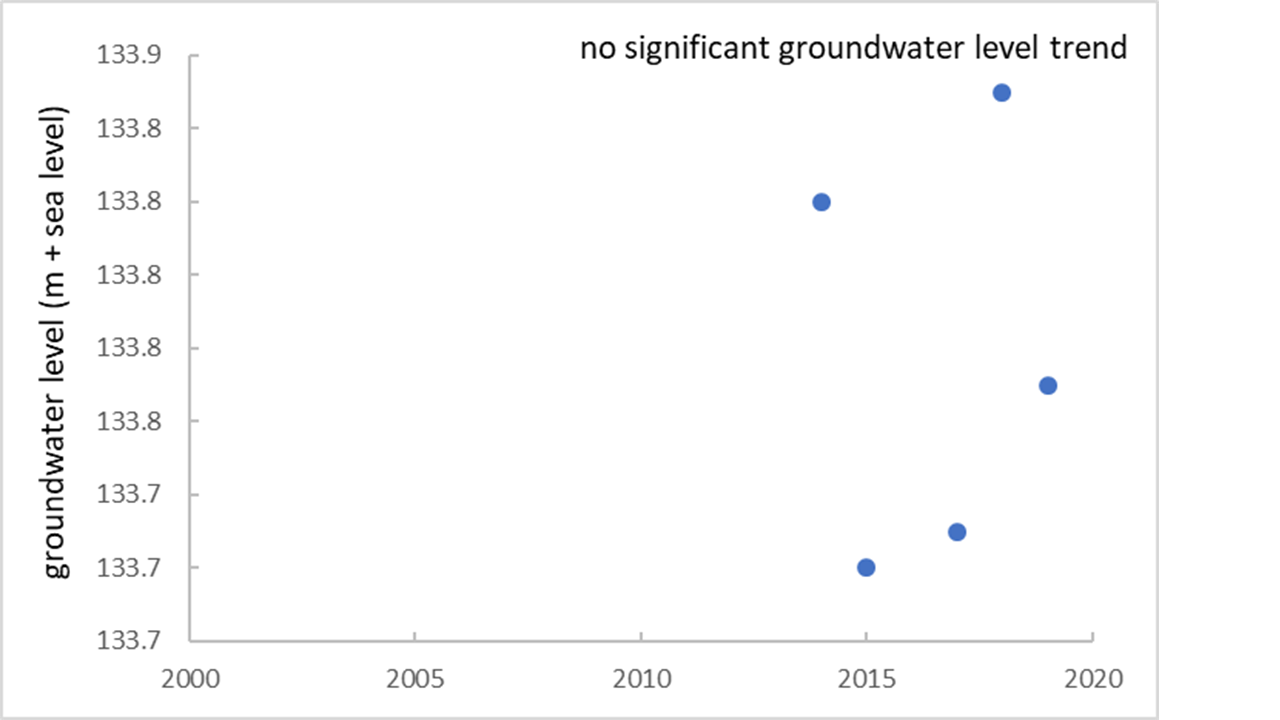
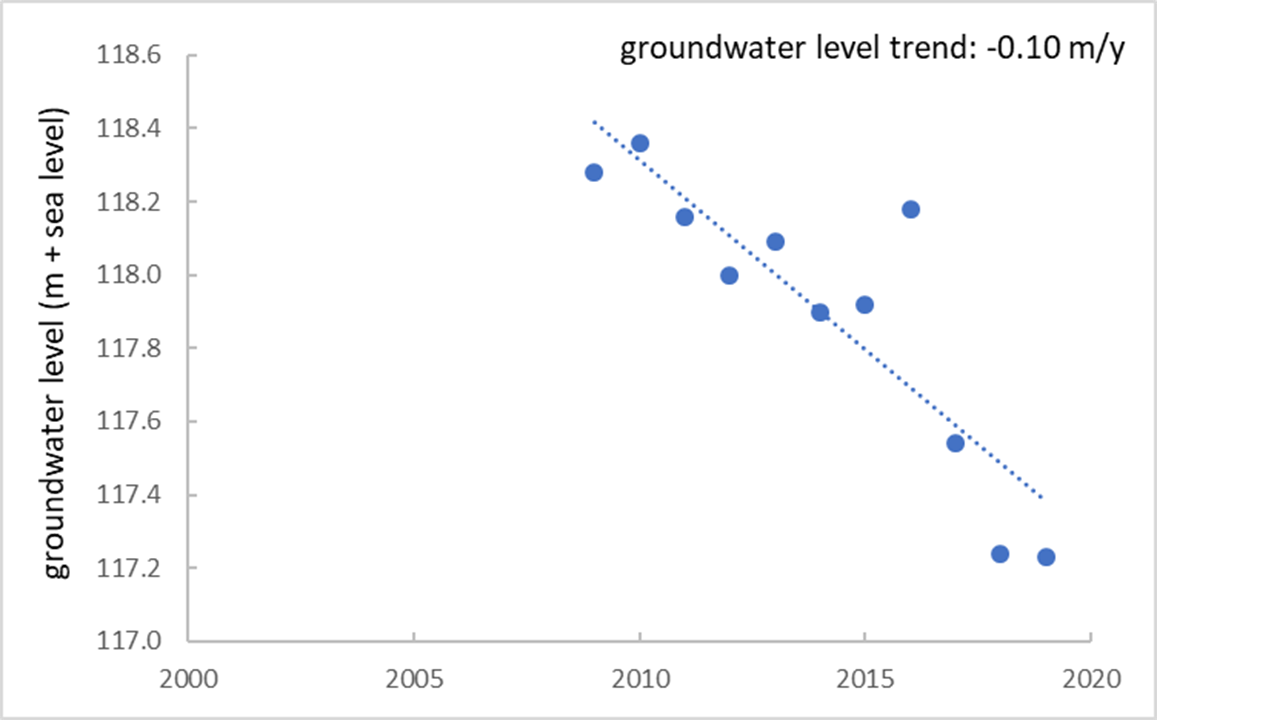
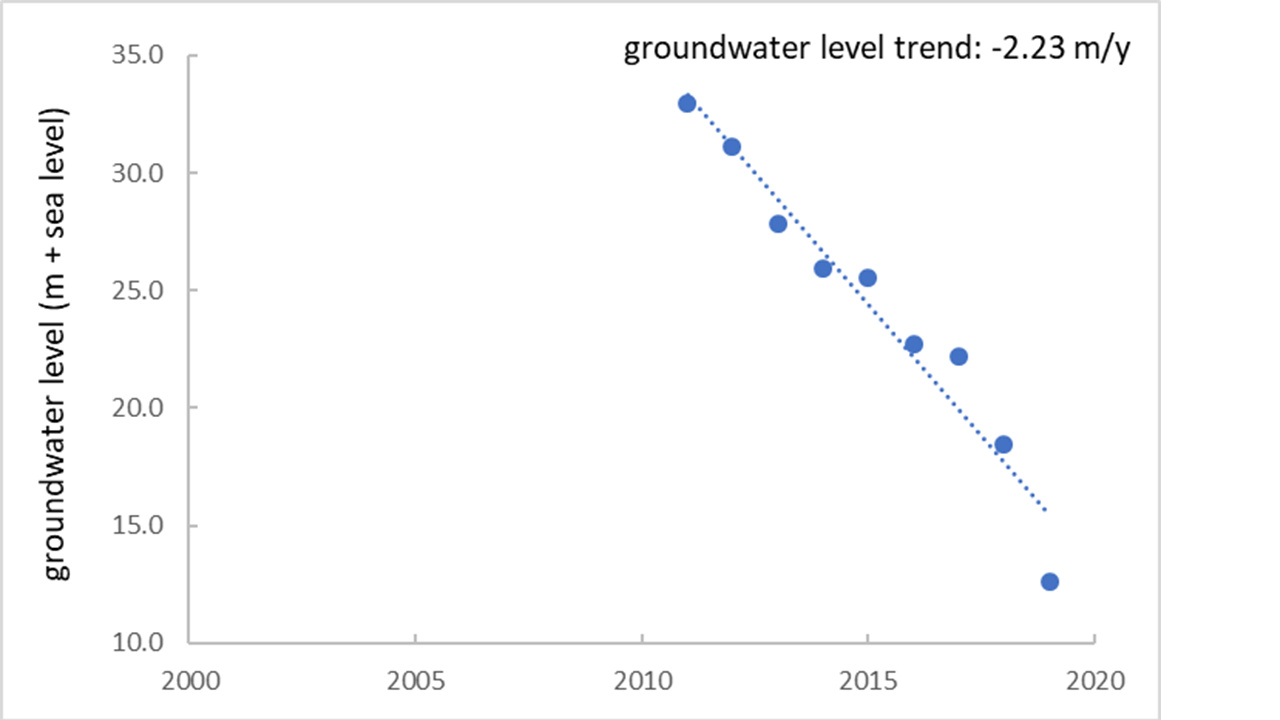
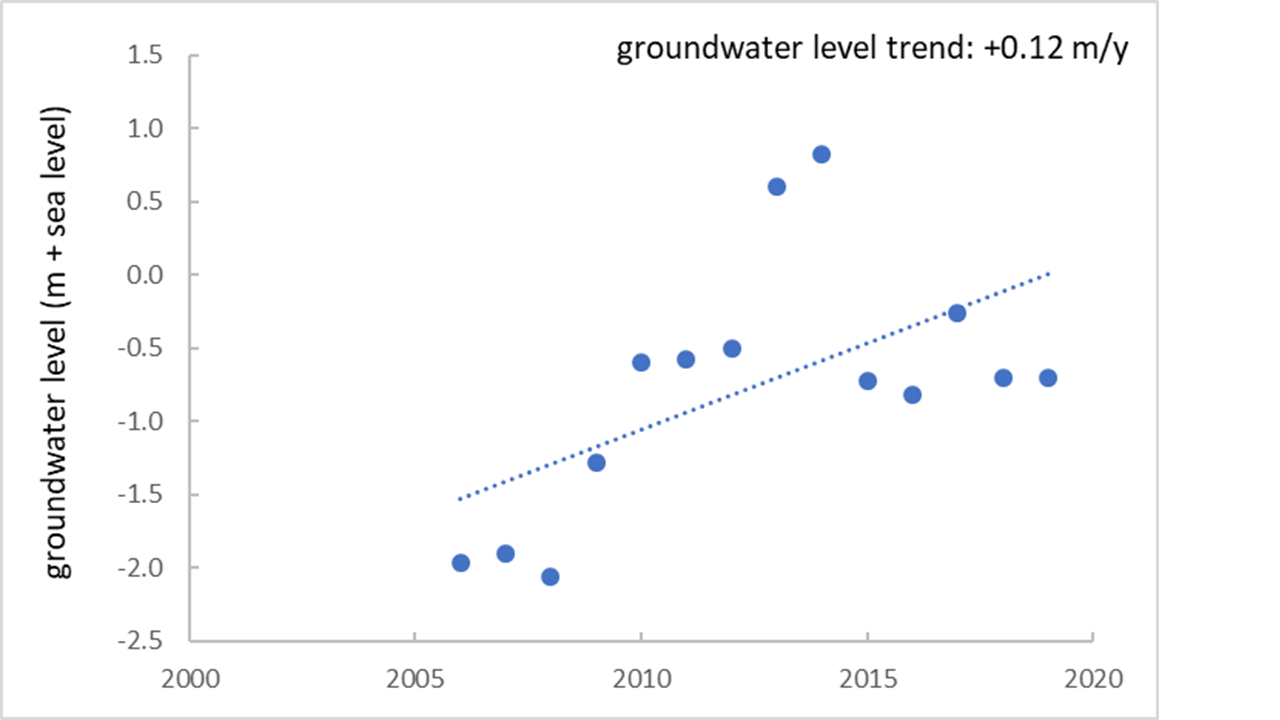
Figure 2c. Pop-up window at the station level on the indicator page (some examples)
Pop-up window for station SE654498-145561 showing a decreasing trend of -0.10 metres per year (points + trend line)
Pop-up window for station EESJA5507000 showing a decreasing trend of -2.23 metres per year (points + trend line)
Pop-up window for station LV001RIGD4_606 showing an increasing trend of +0.12 metres per year (points + trend line)
Pop-up window for station CY1980-090 showing an increasing trend of +2.16 metres per year (points + trend line)