
Table of contents
2. Supporting Information
2.1 Indicator definition
The Groundwater Level Trend (GLT) indicator measures the average change of the annual groundwater level over the monitoring period. The result is expressed in metres per year (m/y). Positive values (higher than zero) indicate an increase of the groundwater level, whereas negative values (lower than zero) indicate a decrease of the groundwater level. GLT is based on the methods of multi-year groundwater level trend analysis (e.g. Nguyen et al., 2021; Le Duy et al., 2021) and the Groundwater Table Declining Trend indicator (Hofste et al., 2019; Galvis Rodríguez et al., 2017).
2.2 Unit of measure
metre per year [m/y]
range of values used for the classification:
Increasing groundwater level trend: between +0.01 m/y and more than +2 m/y
Decreasing groundwater level trend: between - 0.01 m/y and more than - 2 m/year
-
-
Following your suggestion, we revised the section of supporting information, the classes are described as:
- Increasing groundwater level trend: GLT > 0 m/y and p-value < 0.05
- No significant trend observed: p-value > 0.05
- Decreasing groundwater level trend: GLT < 0 m/y and p-value < 0.05
Comment from AT:
A range needs a lower figure and an upper figure (maximum) but not an indication like “more than…”.
/y or /year?
-
2.3 Policy/environmental relevance
The Water Framework Directive emphasises the importance of sustainable water use based on long-term protection of water resources and the need for sufficient supply of good quality surface water and groundwater (Directive 2000/60/EC; Article 1). The EU Biodiversity Strategy 2030 aims at preserving and protecting the natural capital in the EU, including groundwater associated surface waters and dependent terrestrial ecosystems (EC, 2019). The EU groundwater policy requires that groundwater bodies achieve and maintain good chemical and quantitative status (Directive 2006/118/EC). The reporting from the second River Basin Management Plans showed that 27% of the groundwater bodies in EU27 failed to achieve either good quantitative or chemical status, with 4% failing to achieve both good quantitative and chemical status (Psomas et al, 2021).
-
Comment from AT
2nd sentence: also the WFD requires the non deterioration of GW associated aquatic and dependent terrestrial ecosystems.
3rd sentence: The achievement of good GW chemical and quantitative status is required by the WFD Article 4 and not by the GWD.
Last sentence: What is the reason for not referring to the 5th Implementation report? -
Thank you for your comment. The paragraphs was improved based on these suggestions to ”The Water Framework Directive emphasises the importance of sustainable water use based on long-term protection of water resources and the need for sufficient supply of good quality surface water and groundwater (Directive 2000/60/EC; Article 1). This directive requires that groundwater bodies achieve and maintain good chemical and quantitative status (Directive 2000/60/EC; Article 4). The EU Biodiversity Strategy 2030 aims at preserving and protecting the natural capital in the EU, including groundwater associated surface waters and dependent terrestrial ecosystems (COM, 2019).”
2.3 EEA topics
- Nature - European freshwater
- Air and climate - Impacts, vulnerability and risks / Policies and actions
- Economic sectors - Greening Europe’s agriculture
DPSIR - Driving force – Pressure – State – Impact – Response + possible second choice
State
Typology - Descriptive indicators (type A), Performance indicators (type B), Efficiency indicators (type C), Policy effectiveness indicators (type D), Total welfare indicators (type E) [1]
- Descriptive indicators (type A)
[1] EEA indicators — European Environment Agency (europa.eu)
2.4 Methodology
The analysis of the groundwater level trends is described as a supporting element for the water balance test, conducted as part of the process for determining the groundwater quantitative status (CIS, 2009; EPA, 2010).
Since WISE SoE - Water Quantity (WISE-3) provides the possibility to report in more than one temporal resolutions (daily, monthly, seasonal and annual), an aggregation approach has been followed to optimise the use of reported groundwater level data. The aggregation started with daily data and aggregated all the available daily groundwater level values to monthly, seasonal and finally annual values. A minimum set of criteria were met in all intermediate steps, in order to ensure adequate representativity of all seasons on the annual aggregate value.
-
Comment from AT
End of 1st sentence: Reference should be (EC, 2009) and not (CIS, 2009)
2nd sentence: What kind of aggregation has been made?
What means seasonal aggregation? What seasons?
And for the country level you are counting the stations with trends? This is not described.No assessment at GWB level?
-
Thank you for your comment.
Reference in first sentenced was changed to (EC, 2009)
The description was the aggregation approach was improved:
- “Calculation of the Groundwater Level Trend index requires groundwater level data at annual temporal resolution. WISE SoE - Water Quantity (WISE-3) provides the possibility to report groundwater levels in more than one temporal resolutions (daily, monthly, seasonal and annual). To optimise the use of reported groundwater level data, temporal aggregation of station data has been conducted from daily, monthly and seasonal resolution to annual resolution. A minimum set of criteria were met in all intermediate steps, in order to ensure adequate representativity of all seasons on the annual aggregate value.”
- “Spatial aggregation was done at the following scales: European level, regional level (grouping based on UN M49), and country level. For spatial aggregation at European and country level, the number of monitoring station within the three classes were summed. At the regional level countries were grouped in the bar-chart figures, but no summation of monitoring stations per region was applied.”
The data availability and quality was not sufficient for an assessment at GWB level.
Comment from AT
End of 1st sentence: Reference should be (EC, 2009) and not (CIS, 2009)
2nd sentence: What kind of aggregation has been made?
What means seasonal aggregation? What seasons?
And for the country level you are counting the stations with trends? This is not described.No assessment at GWB level?
-
-
POLAND
What was a minimum set of criteria? Length of datasets? Representative periods? It should be explicit.
-
Thank you for your response. The methodology section was improved and was made more explicit in terms of criteria, length of datasets and representative periods.
POLAND
What was a minimum set of criteria? Length of datasets? Representative periods? It should be explicit.
-
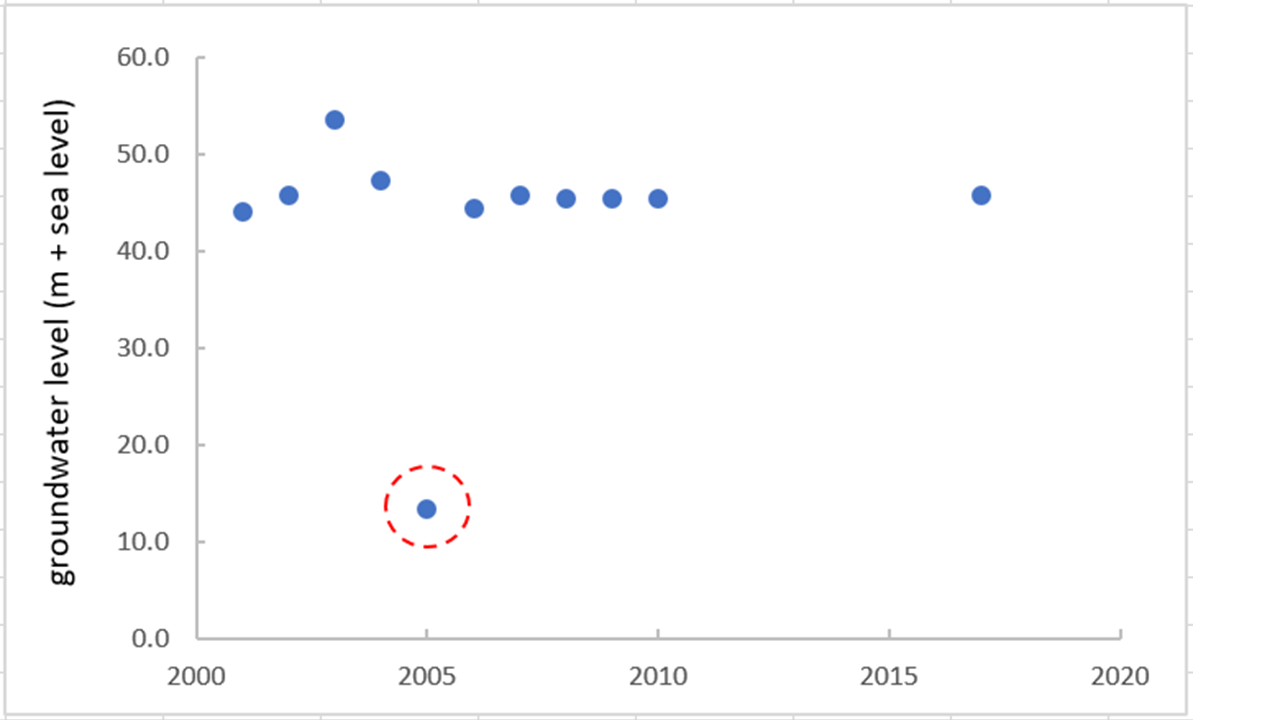
The interquartile range (IQR) method was applied to detect erratic outliers. Values were only removed in case of an apparent error: e.g. the difference in groundwater level between two consecutive annual values is more than an order of magnitude and the change in groundwater level involves a singular erratic outlier. The figure 3 below provides an example of an outlier that was removed.
Figure 3: Groundwater level measurement values from monitoring station DK201-3795-2, including an erratic error (within red circle) that was removed
The minimum length of measurement series used for the calculation of the GLT is 5 years within a 10-year time window, based on the recommendation of the WFD CIS document of quantitative status assessment (CIS, 2009). Years are not necessarily consecutive. No gap filling was applied.
-
Comment from AT
Please delete this para. The recommendations for trend assessments in CIS guidance 18 solely refer to chemical data and NOT to quantity data. It was never discussed in the drafting group whether the recommended time window and the minimum length of years for chemical data also fit for GW level data because quantity trend assessment is not formally required by the WFD. Therefore it is not a good idea to refer to this guidance giving recommendations for GW quantity trend time series calculations. 5 years for quantity trends is probably too short.
Reference should be (EC, 2009) and not (CIS, 2009)-
Thank you for your response. The reference to the CIS guidance is removed and the paragraph is changed as follows: “The minimum length of measurement series used for the calculation of the GLT is 5 annual records within a 20-year time window (2000 until 2019). Years are not necessarily consecutive. No gap filling was applied.”
We agree that 5 years might be too short for thorough evaluation of long-term groundwater level trends. However, the available dataset was very limited. The methodology was developed with the intention to make best use of the capacity of the available groundwater level dataset. Therefore, we encourage the countries to report groundwater level data to the WISE-3 database for improving the spatial representativeness, precision of the computation the indicator and the assessment on the GWL change in Europe.
Comment from AT
Please delete this para. The recommendations for trend assessments in CIS guidance 18 solely refer to chemical data and NOT to quantity data. It was never discussed in the drafting group whether the recommended time window and the minimum length of years for chemical data also fit for GW level data because quantity trend assessment is not formally required by the WFD. Therefore it is not a good idea to refer to this guidance giving recommendations for GW quantity trend time series calculations. 5 years for quantity trends is probably too short.
Reference should be (EC, 2009) and not (CIS, 2009)
-
-
POLAND
Inaccuracies in the description of the methodology - e.g. in the consulted material at the beginning of the methodology it is as follows: „The minimum length of measurement series used for the calculation of the GLT is 5 years within a 10-year time window, based on the recommendation of the WFD CIS document of quantitative status assessment (CIS, 2009). Years are not necessarily consecutive”, and then in part 2.7 Time coverage: „Period of analysis is 2000-2019; length of monitoring data series varies with minimum length of 5 years”. These two sentences do not have the same meaning.
-
Thank you for your response. Inaccuracies in the description of the methodology are resolved. The approach concerning the minimum data requirements is as follows: The minimum length of measurement series used for the calculation of the GLT is 5 annual records within a 20-year time window (2000 until 2019). Years are not necessarily consecutive. No gap filling was applied.
POLAND
Inaccuracies in the description of the methodology - e.g. in the consulted material at the beginning of the methodology it is as follows: „The minimum length of measurement series used for the calculation of the GLT is 5 years within a 10-year time window, based on the recommendation of the WFD CIS document of quantitative status assessment (CIS, 2009). Years are not necessarily consecutive”, and then in part 2.7 Time coverage: „Period of analysis is 2000-2019; length of monitoring data series varies with minimum length of 5 years”. These two sentences do not have the same meaning.
-
After the temporal aggregation and quality checks, the dataset consisted of 3907 monitoring stations covering 19 countries (Austria, Belgium, Bulgaria, Cyprus, Denmark, Estonia, France, Ireland, Italy, Latvia, Lithuania, Netherlands, North Macedonia, Poland, Slovakia, Slovenia, Sweden, Switzerland).
-
Comment from AT
3907 stations out of how many in total??
This info should also be mentioned in the main text of chapter 1-
Thank you for your response. This section is extended and improved to provide the requested information: “The initial dataset consisted of 12810 monitoring stations covering 23 countries. After the temporal aggregation and quality checks, the dataset consisted of 3115 monitoring stations covering 18 countries. Because only one measurement station remained for Greece after temporal aggregation and quality checks, this country was removed from the final dataset. The final dataset of the GLT indicator consisted of 3114 and covers 17 countries (Austria, Belgium, Bulgaria, Cyprus, Denmark, Estonia, France, Ireland, Italy, Latvia, Lithuania, Netherlands, North Macedonia, Slovakia, Slovenia, Sweden, Switzerland). Table 1 provides an overview per country of the period with reported data and the number of stations and that could be included in the GLT indicator.”
In chapter 1 (the indicator assessment), the following information is provided: “…The indicator dataset covered 17 from the 38 European countries and consisted of 3114 monitoring stations (24% of reported stations).”
Comment from AT
3907 stations out of how many in total??
This info should also be mentioned in the main text of chapter 1
-
The Groundwater Level Trend (GLT) is computed by fitting averaged annual groundwater level records with linear regression. The slope of this regression line (in metres per year; m/y) indicates the magnitude and direction (downward or upward) of the GLT. The significance of the trend is estimated with the Pearson’s p-value. If p > 0.05, then the calculated GLT is not significant. GLT is based on the methods of multi-year groundwater level trend analysis (e.g. Nguyen et al., 2021; Le Duy et al., 2021) and the Groundwater Table Declining Trend indicator (Hofste et al., 2019; Galvis Rodríguez et al., 2017).
The GLT is presented in three classes that indicate the statistical significance (p-value < 0.05) and direction of the groundwater level trends.
|
GLT index classes |
GLT ranges (m/y); p-value |
Color scheme |
|
Increasing groundwater level trend |
GLT > +0.01 m/y and p-value < 0.05 |
blue |
|
No significant trend observed (NT) |
p-value > 0.05 |
grey |
|
Decreasing groundwater level trend |
GLT < -0.01 m/y and p-value < 0.05 |
orange |
-
POLAND
Why the applied methodology does not acknowledge R2 ? In accordance to „Aqueduct 3.0: Updated Decision. Relevant Global Water Risk Indicators”, to which the authors of the "draft" refer to, R2 value should also be evaluated.
-
Thank you for your comment. The R2 is not evaluated because it does not provide information about the significance of the groundwater level trends assessed in the developed approach. It could provide information about the level of temporal variability of the groundwater level trends. However, interpreting and aggregating such information for a range of individual groundwater level monitoring stations would lead to ambiguous conclusions. In the Aqueduct 3.0 approach, the Declining Groundwater Table Declining Trend (GTDT) is based on gridded global model results that are aggregated to the scale of large groundwater bodies before trend calculation is applied. In this apporach, the R2 values show a strong correlation with the p-values (low p-values with high R2, and vise versa).
POLAND
Why the applied methodology does not acknowledge R2 ? In accordance to „Aqueduct 3.0: Updated Decision. Relevant Global Water Risk Indicators”, to which the authors of the "draft" refer to, R2 value should also be evaluated.
-
Bar-charts are used to visualize the distribution of the groundwater level trend at the EU level and regional level. In this bar-chart, the percentages of monitoring stations that fall within the three GLT classes are shown (orange-grey-blue colour scheme), as well as the number of monitoring locations for Europe and for each region.
At country level, the groundwater level trends are visualized at 3 aggregation levels:
• Level 1: map of Europe with for each country a pie-chart that show the percentages of monitoring stations that fall within the three GLT classes as well as the number of monitoring locations for that country.
• Level 1, alternative: bar-chart with that shows for each country the percentages of monitoring stations that fall within the three GLT classes as well as the number of monitoring locations for that country.
• Level 2: map of Europe with individual monitoring locations indicating the GLT using a yellow-grey-blue colour scheme.
• Level 3: graphs for each monitoring locations, showing the individual groundwater level data points (m + sea level) over time and, in case of a significant trend, the groundwater level trend line and slope (m/y).
(The second and third level are made available via a link to the data and maps section of the website.)
Note: For monitoring stations with the confidentiality remark, locations, groundwater level data, and groundwater level trends will not be shown in maps. However, these monitoring locations are used at aggregated level assessments and visualisations.
-
Comment from AT
1st sentence: be careful when using “EU”. EU (European Union) and Europe are not the same.
3rd sentence: bar-chart with…(what?)...that
0.01 m/y is probably the measurement uncertainty. What about defining a “critical trend” in relation to a time span? In my eye 0.01 m/y is not of interest. Furthermore, the significance of a trend also depends on the hydrogeological properties of a GWB.In 2.10 you compare the GLT with the Standardized Groundwater trend indicator. Please also describe in this chapter which other methods you have considered and would have been appropriate for trend assessments and explain why you have chosen the GLT.
-
Thank you for your comment.
The term “EU” is replaced by “Europe”.
The section with the describtion of the figures was adjusted to the new figures 1a and 1b. Also, the bar-chart is described in more detail:
“The groundwater level trends are visualized at 3 aggregation levels:
Level 1: A pie-chart and a bar-chart with the three main GLT classes are made to visualize the distribution of the groundwater level trends for the European countries where data is available for the indicator assessment. In these charts, the percentages of monitoring stations that fall within the three GLT classes are shown (orange-grey-blue colour scheme), as well as the number of monitoring locations for each region country. UN M49 standard is used for grouping the countries in four regions.
Level 2: map of Europe with individual monitoring locations indicating the three main GLT classes using a yellow-grey-blue colour scheme.
Level 3: graphs for each monitoring locations, showing the individual groundwater level data points (m + sea level) over time and, in case of a significant trend, the groundwater level trend line and slope (m/y).”
For the development of the EEA groundwater level trend indicator, an overview of existing groundwater quantity indicators and literature reporting on multi-year groundwater level trend analysis was made, including a description of their main characteristics, data requirements and examples of application. None of these existing groundwater approaches was fully suited, either because the scope of the indicator was not focussing on multi-year groundwater level trend analysis (eg. Groundwater Footprint Index, Standardized Groundwater Index) and/or because the data requirements of the indicator was sufficient in the WISE SoE. The latter was the case for all existing indicators and examples from literature. As a result, no conclusive guidelines were available from literature either to develop the EEA groundwater level trend indicator based on scientific approach. The methodology described and applied for this indicator sheet was developed with the intention to make best use of the capacity of the available groundwater level dataset to provide a European overview.
This information, including an overview of the consulted literature, is added to the methodology section in “supporting information”.
Comment from AT
1st sentence: be careful when using “EU”. EU (European Union) and Europe are not the same.
3rd sentence: bar-chart with…(what?)...that
0.01 m/y is probably the measurement uncertainty. What about defining a “critical trend” in relation to a time span? In my eye 0.01 m/y is not of interest. Furthermore, the significance of a trend also depends on the hydrogeological properties of a GWB.In 2.10 you compare the GLT with the Standardized Groundwater trend indicator. Please also describe in this chapter which other methods you have considered and would have been appropriate for trend assessments and explain why you have chosen the GLT.
-
2.5 Data sources
The main underlying data for developing the EEA groundwater level trend indicator come from the WISE - Water Quantity (WISE-3) database. In addition, coordinates of monitoring locations are available from the WISE - Spatial Data (WISE-5). Countries that are members of the European Environment Information and Observation Network (Eionet) voluntarily report groundwater level data to the WISE-3 and WISE-5 dataflow. The time series cover 2000-2019 in the current database were used for this indicator.
The dataset for the Netherlands (NL) was based on a selection of the validation dataset of the National Hydrological model instrument (NHI). The selection was made by spatial coverage and coverage of the different geohydrological settings typical for the Netherlands. Data are available via the online data portal of the NHI (data.nhi.nu).
-
Comments from AT
2nd sentence: No GW level data are reported through WISE-5.
3rd sentence: Check sentence.-
Thank you for your comment. This improved was improved as follows: “The main underlying data for developing the EEA groundwater level trend indicator come from the WISE - Water Quantity (WISE-3) database. In addition, coordinates of monitoring locations are available from the WISE - Spatial Data (WISE-5). Countries that are members of the European Environment Information and Observation Network (Eionet) voluntarily report groundwater level data to the WISE-3 dataflow. The time series cover 2000-2019 in the current database were used for this indicator.”
Comments from AT
2nd sentence: No GW level data are reported through WISE-5.
3rd sentence: Check sentence.
-
-
POLAND
It is unclear why data for the Netherlands are coming from the different source. Are the NL data not available via WISE SoE and why?
-
Thank you for your comment. To provide more clarity, this sentence was improved as follows: “For the Netherlands no data were available in the WISE-3 database. However, groundwater level monitoring data could be retrieved from the online data portal of the National Hydrological Model of the Netherlands (<a href="http://www.data.nhi.nu%29.”" rel="nofollow">www.data.nhi.nu).”</a>
POLAND
It is unclear why data for the Netherlands are coming from the different source. Are the NL data not available via WISE SoE and why?
-
2.6 Geographic coverage
EEA member countries and cooperating countries: Austria, Belgium, Bulgaria, Cyprus, Denmark, Estonia, France, Ireland, Italy, Latvia, Lithuania, Netherlands, North Macedonia, Poland, Slovakia, Slovenia, Sweden, Switzerland.
-
POLAND
The sentence may wrongly suggest that it is the full set of EEA member and cooperating countries. Perhaps you can add “(18 out of 38)” at the end of the sentence.
Why other countries are missing?
-
Thank you for your comment. This information is now added to the Geographical coverage.
POLAND
The sentence may wrongly suggest that it is the full set of EEA member and cooperating countries. Perhaps you can add “(18 out of 38)” at the end of the sentence.
Why other countries are missing?
-
2.7 Time coverage
Period of analysis is 2000-2019; length of monitoring data series varies with minimum length of 5 years.
-
Comment from AT
As this is the chapter of the general methodology for the indicator applied in future, it would be good to explain the conditions/principles more in general. E.g the time window covers e.g. the past 20 years.... Is it generally 20 years? Will it me be a moving period of analysis at each point of dissemination? 2002-2021 in 2 years? Or will it expand to more years? 2000-2021?
What about the minimum length of time series? Is it 5 years (too short)? The last 5 years? Is it comparable when you take Site1 (e.g. CY1980-090 ) with values from 2000-2012 and compare it with site2 (e.g. EESJA5507000) with data from 2010-2019? Very unclear, probably very incomparable.
What if the time series of a site of 2000-2019 does not show a trend but the segment of 2015-2019 does show a trend? Which one do you take? Is it up to individual decision to decide which segment is taken?
What about data gaps? How many are acceptable? Is it a concrete number of gaps or a percentage of the time series (e.g. 10%)
-
Thank you for your comment. Inaccuracies in the description of the methodology are resolved. The approach concerning the minimum data requirements is as follows: The minimum length of measurement series used for the calculation of the GLT is 5 annual records within a 20-year time window (2000 until 2019). Years are not necessarily consecutive. No gap filling was applied.
We agree that 5 years might be too short for thorough evaluation of long-term groundwater level trends. However, the available dataset was very limited. The methodology was developed with the intention to make best use of the capacity of the available groundwater level dataset. In the indicator assessment sheet, a request is made to the countries to submit groundwater level data to the WISE-3 database that for longer periods and with better coverage.
If and when more datasets become available that cover long time periods, the methodology of the GLT indicator can be improved. The suggestions that you provide can be taken up in such an improvement of the methodology.
Comment from AT
As this is the chapter of the general methodology for the indicator applied in future, it would be good to explain the conditions/principles more in general. E.g the time window covers e.g. the past 20 years.... Is it generally 20 years? Will it me be a moving period of analysis at each point of dissemination? 2002-2021 in 2 years? Or will it expand to more years? 2000-2021?
What about the minimum length of time series? Is it 5 years (too short)? The last 5 years? Is it comparable when you take Site1 (e.g. CY1980-090 ) with values from 2000-2012 and compare it with site2 (e.g. EESJA5507000) with data from 2010-2019? Very unclear, probably very incomparable.
What if the time series of a site of 2000-2019 does not show a trend but the segment of 2015-2019 does show a trend? Which one do you take? Is it up to individual decision to decide which segment is taken?
What about data gaps? How many are acceptable? Is it a concrete number of gaps or a percentage of the time series (e.g. 10%)
-
-
POLAND
Inaccuracies in the description of the methodology - e.g. in the consulted material at the beginning of the methodology it is as follows: „The minimum length of measurement series used for the calculation of the GLT is 5 years within a 10-year time window, based on the recommendation of the WFD CIS document of quantitative status assessment (CIS, 2009). Years are not necessarily consecutive”, and then in part 2.7 Time coverage: „Period of analysis is 2000-2019; length of monitoring data series varies with minimum length of 5 years”. These two sentences do not have the same meaning.
-
Thank you for your comment. Inaccuracies in the description of the methodology are resolved. The approach concerning the minimum data requirements is as follows: The minimum length of measurement series used for the calculation of the GLT is 5 annual records within a 20-year time window (2000 until 2019). Years are not necessarily consecutive. No gap filling was applied.
POLAND
Inaccuracies in the description of the methodology - e.g. in the consulted material at the beginning of the methodology it is as follows: „The minimum length of measurement series used for the calculation of the GLT is 5 years within a 10-year time window, based on the recommendation of the WFD CIS document of quantitative status assessment (CIS, 2009). Years are not necessarily consecutive”, and then in part 2.7 Time coverage: „Period of analysis is 2000-2019; length of monitoring data series varies with minimum length of 5 years”. These two sentences do not have the same meaning.
-
2.9 References
EC, 2009. Guidance on groundwater status and trend assessment, Common Implementation Strategy for the Water Framework Directive (200/60/EC), Technical Report - 2009 – 026. (https://circabc.europa.eu/sd/a/ff303ad4-8783-43d3-989a-55b65ca03afc/Guidance_document_N%C2%B018.pdf) accessed 22 September 2021.
EC, 2019. Communication from the Commission to the European Parliament, the European Council, the European Economic and Social Committee of the Regions;; The European Green Deal; COM/2019/640 final (https://eur-lex.europa.eu/legal-content/EN/TXT/?uri=celex%3A52019DC0640) accessed 22 September 2021.
EC, 2000, Directive 2000/60/EC of the European Parliament and of the Council of 23 October 2000 establishing a framework for Community action in the field of water policy (http://data.europa.eu/eli/dir/2000/60/oj( accessed 22 September 2021.
EC, 2006, Directive 2006/118/EC of the European Parliament and of the Council of 12 December 2006 on the protection of groundwater against pollution and deterioration(http://data.europa.eu/eli/dir/2006/118/oj) accessed 22 September 2021.
EEA, 2017, CLIM 002 indicator; Indicator Assessment - Mean precipitation - European Environment Agency (https://www.eea.europa.eu/data-and-maps/indicators/european-precipitation-2/assessment) accessed 22 September 2021.
EEA, 2019, CSI 018 indicator; Indicator Assessment - Use of freshwater resources in Europe - European Environment Agency (https://www.eea.europa.eu/data-and-maps/indicators/use-of-freshwater-resources-3/assessment-4) accessed 22 September 2021.
EPA, 2010, Methodology for establishing groundwater threshold values and the assessment of chemical and quantitative status of groundwater, including an assessment of pollution trends and trend reversal, Environmental Protection Agency, Hydrometric and Groundwater Section, Office of Environmental Assessment, Wexford, Ireland (https://www.epa.ie/publications/monitoring--assessment/freshwater--marine/Methodology-for-Groundwater-Chemical-&-Quantitative-Status-Methology,-TVs-and-Trends.pdf) accessed 22 September 2021.
Galvis Rodríguez, S., E.H. Sutanudjaja, and M. Faneca Sànchez. 2017. “Memo: Update on the Groundwater Risk Indicators.” Memo. Delft, the Netherlands: Deltares.
Hendriks, D.M.D., Mens, M., Kramer, N., Borren, W., Diermanse, F., 2015. Changing e-flows resulting from land use change and altered groundwater conditions in the Regge catchment, the Netherlands, Extended Abstract, REFORM International Conference on River and Stream Restoration “Novel Approaches to Assess and Rehabilitate Modified Rivers”
Hofste, R., S. Kuzma, S. Walker, E.H. Sutanudjaja, et. al. 2019. “Aqueduct 3.0: Updated Decision. Relevant Global Water Risk Indicators.” Technical Note. Washington, DC: World Resources Institute, (https://www.wri.org/publication/aqueduct-30) accessed 22 September 2021.
Le Duy, N., T. V. Khanh Nguyen, D.V. Nguyen, A.T. Tran, H. T. Nguyen, I. Heidbüchel, B. Merz, H. Apel, 2021, Groundwater dynamics in the Vietnamese Mekong Delta: Trends, memory effects, and response times, Journal of Hydrology: Regional Studies, Volume 33, 2021, 100746, ISSN 2214-5818, (https://doi.org/10.1016/j.ejrh.2020.100746) accessed 22 September 2021.
Psomas, A., Bariamis, G., Rouillard, J., Stein, U., Roy, S., 2021, Comparative study on quantitative and chemical status of groundwater bodies. Study of the impacts of pressures on groundwater in Europe, Service Contract No 3415/B2020/EEA.58185. pp. 32 (Unpublished).
Spinoni, J., Naumann, G., Vogt, J.V., 2017, Pan-European seasonal trends and recent changes of drought frequency and severity, Global and Planetary Change, 148, pp. 113-130 (https://doi.org/10.1016/j.gloplacha.2016.11.013) accessed 22 September 2021.
WWF, 2018, Report: The Role of SDG15 in underpinning the achievement of the 2030 agenda global policy and advocacy, June 2018.
2.10 Related products
Contact - info@eea.europa.eu
UN SDGs - 17 goals from https://w3.unece.org/SDG/Home
SDG 6 Ensure availability and sustainable management of water and sanitation for all.
Target 6.4 By 2030, substantially increase water-use efficiency across all sectors and ensure sustainable withdrawals and supply of freshwater to address water scarcity and substantially reduce the number of people suffering from water scarcity.
Indicator 6.4.2 Level of water stress: freshwater withdrawal as a proportion of available freshwater resources, (%)
SDG 15 Protect, restore and promote sustainable use of terrestrial ecosystems, sustainably manage forests, combat desertification, and halt the reverse land degradation and halt biodiversity loss.
Target 15.1 By 2020, ensure the conservation, restoration and sustainable use of terrestrial and inland freshwater ecosystems and their services, in particular forests, wetlands, mountains and drylands, in line with obligations under international agreements
Indicator 15.1.2: Proportion of important sites for terrestrial and freshwater biodiversity that are covered by protected areas, by ecosystem type
Target 15.3 By 2030, combat desertification, restore degraded land and soil, including land affected by desertification, drought and floods, and strive to achieve a land degradation-neutral world.
Indicator 15.3.1 Proportion of land that is degraded over total land area, (%)
SDG15 is linked with SDG6 as an ecosystem service, water availability and quality are derived from well-functioning ecosystems, in particular forest ecosystems, as are water storage and flow regulation, filtering and flood and drought protection, among others (WWF, 2018). Conserving and sustainably managing ecosystems is integral to effective land-use management and a sustainable and healthy food production and this in turn helps to reliably store and deliver water. Key functions inherent to forests relating to groundwater availability and cooling include:
- Decreasing groundwater levels, due to climate change or poor groundwater management, is one of the factors that may lead to desertification;
- Wetlands and other groundwater dependent ecosystems require availability and sustainable management of groundwater;
- Trees enhance soil infiltration and, under suitable conditions, improve groundwater recharge;
- Precipitation filtered through forested catchments delivers purified ground- and surface water.
2.10 Uncertainties
Insignificant trends in the assessment are mostly due to the relatively short time series in the dataset. The minimum length of measurement series to be used for the calculation of the GLT indicator set at 5 years within a ten-year time window. This 5-year minimum is based on the minimum range of timeseries requested by the WFD CIS document on trends analysis of groundwater pollutants (EC, 2009). However, basing the indicator calculation on less than 10 years of the evaluation period creates uncertainties in the indicator results and may give the false impression that no groundwater level trends occur. It is recommended to improve the dataset and increase the length of the time series at the monitoring locations as much as possible.
In addition, the relatively simple approach of the Groundwater Level Trend indicator compared to other indicators may bring some uncertainties:
- GLT indicator is more sensitive to seasonal variability than the Standardized Groundwater trend indicator. However, because of the aggregation at the annual scale, the effects of seasonal variability in the indicator calculation are minimized.
- Like other groundwater quantity indicators, the GLT indicator focusses on one aspect of the groundwater. The GLT indicator does not explain the cause of the increase or decrease of the groundwater levels. Groundwater levels and the derived GLT indicator can be strongly influenced by location. Groundwater level is mainly influenced by local and site-specific recharge processes and by regional to site-specific saturated flow processes that are not simply spatially correlated with the long-term climate change impacts where data coverage is not sufficient. Consequently, any interpretation or analysis of the resulting GLT needs to reflect an appreciation of the hydrogeological context of the observation monitoring sites. A set of indicators might be needed for undertaking integrated groundwater assessments and explaining the reasons for changing in groundwater levels.
-
Comment from AT
1st Para: Please do not use the CIS guidance 18 as a reference giving recommendations on the minimum criteria for GW quantity trend assessments. The 10/5 years are solely relevant for GW quality data!!! Better propose and apply your own criteria about the time series.
1st bullet: it would be good if you explain the difference between the GLT and the Standardized Groundwater trend indicator in the chapter 2.4 methodology and to explain why you have chosen the GLT approach.
2nd bullet: please specify at the end of the first sentence which one aspect is focused at.
It would be also worth mentioning that it is not clear whether the selected sites are representative in terms of areal distribution or whatsoever.
Furthermore, in Alpine or mountainous areas groundwater levels are not relevant (and often not measurable) but spring discharges.Furthermore, if GWBs are confined and under pressure, the measurement uncertainty of pressure heads is more than 0.01m.
-
Thank you for your comment. The reference to the CIS guidance is removed.
In the methodology section of the “supporting information”, more information is provided about the review of groundwater indicators that was made before developing this GLT indicator.
Information about the spatial representativity is added to this section about “accuracy and uncertainties”: “No additional information or metadata is available for the groundwater monitoring stations reported in the WISE SoE. Data that provide the specifics of the measurement location (e.g. filter depth), the geohydrological setting (mountainous, coastal, river plain), the type of aquifer (confined, semi-confined, unconfined), the aquifer properties (e.g. transmissivity of sedimentary, karstic, hard-rock aquifers), as well as information related to climate and land use are required to interpret the behaviour of the groundwater level changes and trends. Moreover, without such information the representativeness of the available monitoring stations in terms of spatial distribution cannot be determined.”
With respect to the comment about the confined GWB: this is true. We have improved the classes of the GLT indicator. Please refer to responses to the comments above.
Comment from AT
1st Para: Please do not use the CIS guidance 18 as a reference giving recommendations on the minimum criteria for GW quantity trend assessments. The 10/5 years are solely relevant for GW quality data!!! Better propose and apply your own criteria about the time series.
1st bullet: it would be good if you explain the difference between the GLT and the Standardized Groundwater trend indicator in the chapter 2.4 methodology and to explain why you have chosen the GLT approach.
2nd bullet: please specify at the end of the first sentence which one aspect is focused at.
It would be also worth mentioning that it is not clear whether the selected sites are representative in terms of areal distribution or whatsoever.
Furthermore, in Alpine or mountainous areas groundwater levels are not relevant (and often not measurable) but spring discharges.Furthermore, if GWBs are confined and under pressure, the measurement uncertainty of pressure heads is more than 0.01m.
-
-
POLAND
See comments referring to the methodology approach incl. incomparability of the data.
-
Thank you for your comment. Please refer to response above.
POLAND
See comments referring to the methodology approach incl. incomparability of the data.
-
Data uncertainties
As most of the data are reported in annual temporal resolution, this significantly limits the possibility to capture the monthly or seasonal variations of the groundwater levels based on the regional hydrological and hydrogeological dynamics (e.g. groundwater recharge, baseflow to rivers, infiltration of snow melt, etc.).
The timeseries on groundwater level available in the WISE SoE water quantity have numerous breaks of one, two or even more years. Hence, the current underlying dataset does not always have sufficient length to assess a long-term phenomenon, such the groundwater level variation. Only 15% of the finally integrated stations in the analysis have more than 10 years of available annual (or reported or aggregated) groundwater level trends. This limits for the moment the expansion of temporal and spatial coverage of the indicator upscaling of the results at national, European and regional levels.
-
POLAND
See comments referring to the methodology approach incl. incomparability of the data.
-
Thank you for your comment. Please refer to response above.
POLAND
See comments referring to the methodology approach incl. incomparability of the data.
-
Comment from AT:
A range needs a lower figure and an upper figure (maximum) but not an indication like “more than…”.
/y or /year?