
Post a comment on the text below
Map 4.1b Water Exploitation Index WEI and abstraction for European River Basin Districts (ltaa)
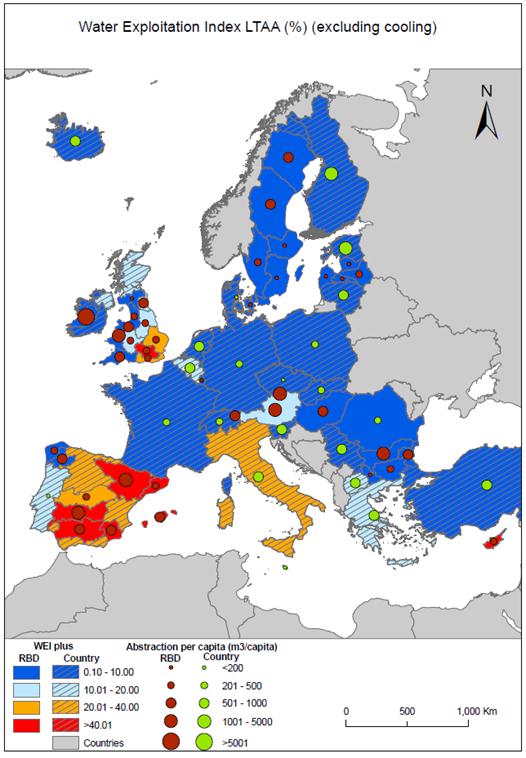
Sources: compiled by the ETC/ICM
Notes: Data come from multiple sources, Combination of WISE-SoE#3 and WFD: AT2000-Rhine, AT5000-Elbe, BG1000-Danube Region, BG2000-Black Sea Basin, BG3000-East Aegean, BG4000-West Aegean, SK30000-Vistula, SK40000-Danube / Combination of WISE-SoE#3 and websources: IEGBNISH-Shannon / Websources: ES014-Galician Coast, ES016-Cantabrian, ES020-Duero, ES030-Tagus, ES040-Guardiana, ES050-Guadalquivir, ES07-Segura, ES080-Jucar,ES091-Ebro, ES100-Internal Basins of Catalonia, ES110- Balearic Islands, ES120-Gran Canaria. web link: http://servicios2.marm.es/sia/visualizacion/lda/recursos/superficiales_escorrentia.jsp (*Total water resources in the natural system (hm3/year) Average value for the period between 1941-2009) Reported to DG ENV for the Interim Report: PTRH3, PTRH4, PTRH5, PTRH6, PTRH7, PTRH8 WISE-SoE#3: all other RBDs / Eurostat JQ IWA: all Country level data to be checked on completeness and correctness
You cannot post comments to this consultation because you are not authenticated. Please log in.
Previous comments
Despite the improvements, the WEI+ is not adapted at an annual and national scale for France. With this map, it seems that there is no problem of water scarcity or drought in France. But it is not the case. It could be interesting to complete this annual map with a seasonnal map (for example summer), even if some data are lacking. I assume that the raw data, in fact, are lacking, especially monthly data, but with the new characterisation of RBDs for WFD, we may have new tools in France to improve our reporting, especially for the abstractions data (hopefully for the next WISE-SoE data flow).
To illustrate the problem of water scarcity in France, you will find in attached file the map representing over the last 10 years, the measures of water restrictions in French departments: in red, the departments where restrictions have been decided more than 8 years over 10, in yellow, between 4 or 6 and in white, less than 2 years. You will see that there is a lot of problem of water scarcity in the South-West or in the administrativ region Poitou-Charente that the WEI+ map does not illustrate.
Austria seems not to be represented appropriately in Map 4.1b. AT is country in general abundant of water and uses only arbot 3% of the available water resources. Usually the WEI for Austria is calculated at a value of about 4%, see e.g. on EEA Homepage: http://www.eea.europa.eu/data-and-maps/figures/water-exploitation-index-wei-2