
Table of contents
1. Indicator assessment
Recovering the financial costs of water services, and particularly doing so through water tariffs, is essential for improving water use efficiency in the long-term and in turn reduce the pressure on freshwater resources in Europe. Getting the price right can help ensure that water infrastructure is adequately operated, maintained and renewed.
Water tariffs should raise the awareness of users on water scarcity and water waste issues and provide incentives for water saving and sustainable use, therefore supporting environmental protection. However, they should be accompanied with locally adequate social policies to support households that might be especially vulnerable to tariff increases, to “leave no one behind”.
EU Member States use different methods and considerations to estimate financial cost recovery of water services, which hinders direct comparisons between different countries and river basin districts (RBDs).
During the 2nd WFD RBMP reporting, 20 EU Member States and Norway reported data on financial cost recovery. These data reflect financial cost recovery levels for drinking water supply services in 54 RBDs; for sanitation services in 45 RBDs; and for both supply and sanitation services combined in 82 RBDs.
The current indicator covers assessment on 147 RBDs from 20 Member States and Norway in total.
According to data reported under the Water Framework Directive (WFD), in 18% of the RBDs, water tariffs and other revenues recover 100% or more of the financial costs for the provision of water supply and/or sanitation services. In 57% of the RBDs financial cost recovery ranges between 80% - 100%, and in 24% of the RBDs financial cost recovery is lower than 80%. The lowest financial cost recovery is observed in RBDs of Belgium, Bulgaria, Croatia, Greece, Luxembourg, Portugal and Spain.
Water affordability is a concern for low-income households across Europe, and it could become an issue even for middle income households. Household expenditure on water supply and sanitation services remained the lowest compared to the expenditure on other household needs (e.g. food, clothing, housing) between 2005-2019. However, when expenses on these essential needs are compounded, they often take up a very high share of the households’ disposable income. This is the case for middle income households in some eastern (e.g. Latvia, Lithuania) and southern European countries (e.g. Greece), which could make them vulnerable to tariff increases. This is not the case in some western European countries like the Netherlands, France and Ireland.
Figure 1 (main view). Financial cost recovery for public water supply and sanitation services in European RBDs in the 2nd RBMPs [indicative data view for water supply / sanitation / combined water supply & sanitation services].
Note: The dynamic map will provide detailed information on financial cost recovery and water prices for public water supply per cubic meter at the river basin level and city level; "other" types of combined water services have been excluded.
Data availability of financial cost recovery of water services (WFD 2nd RBMPs)
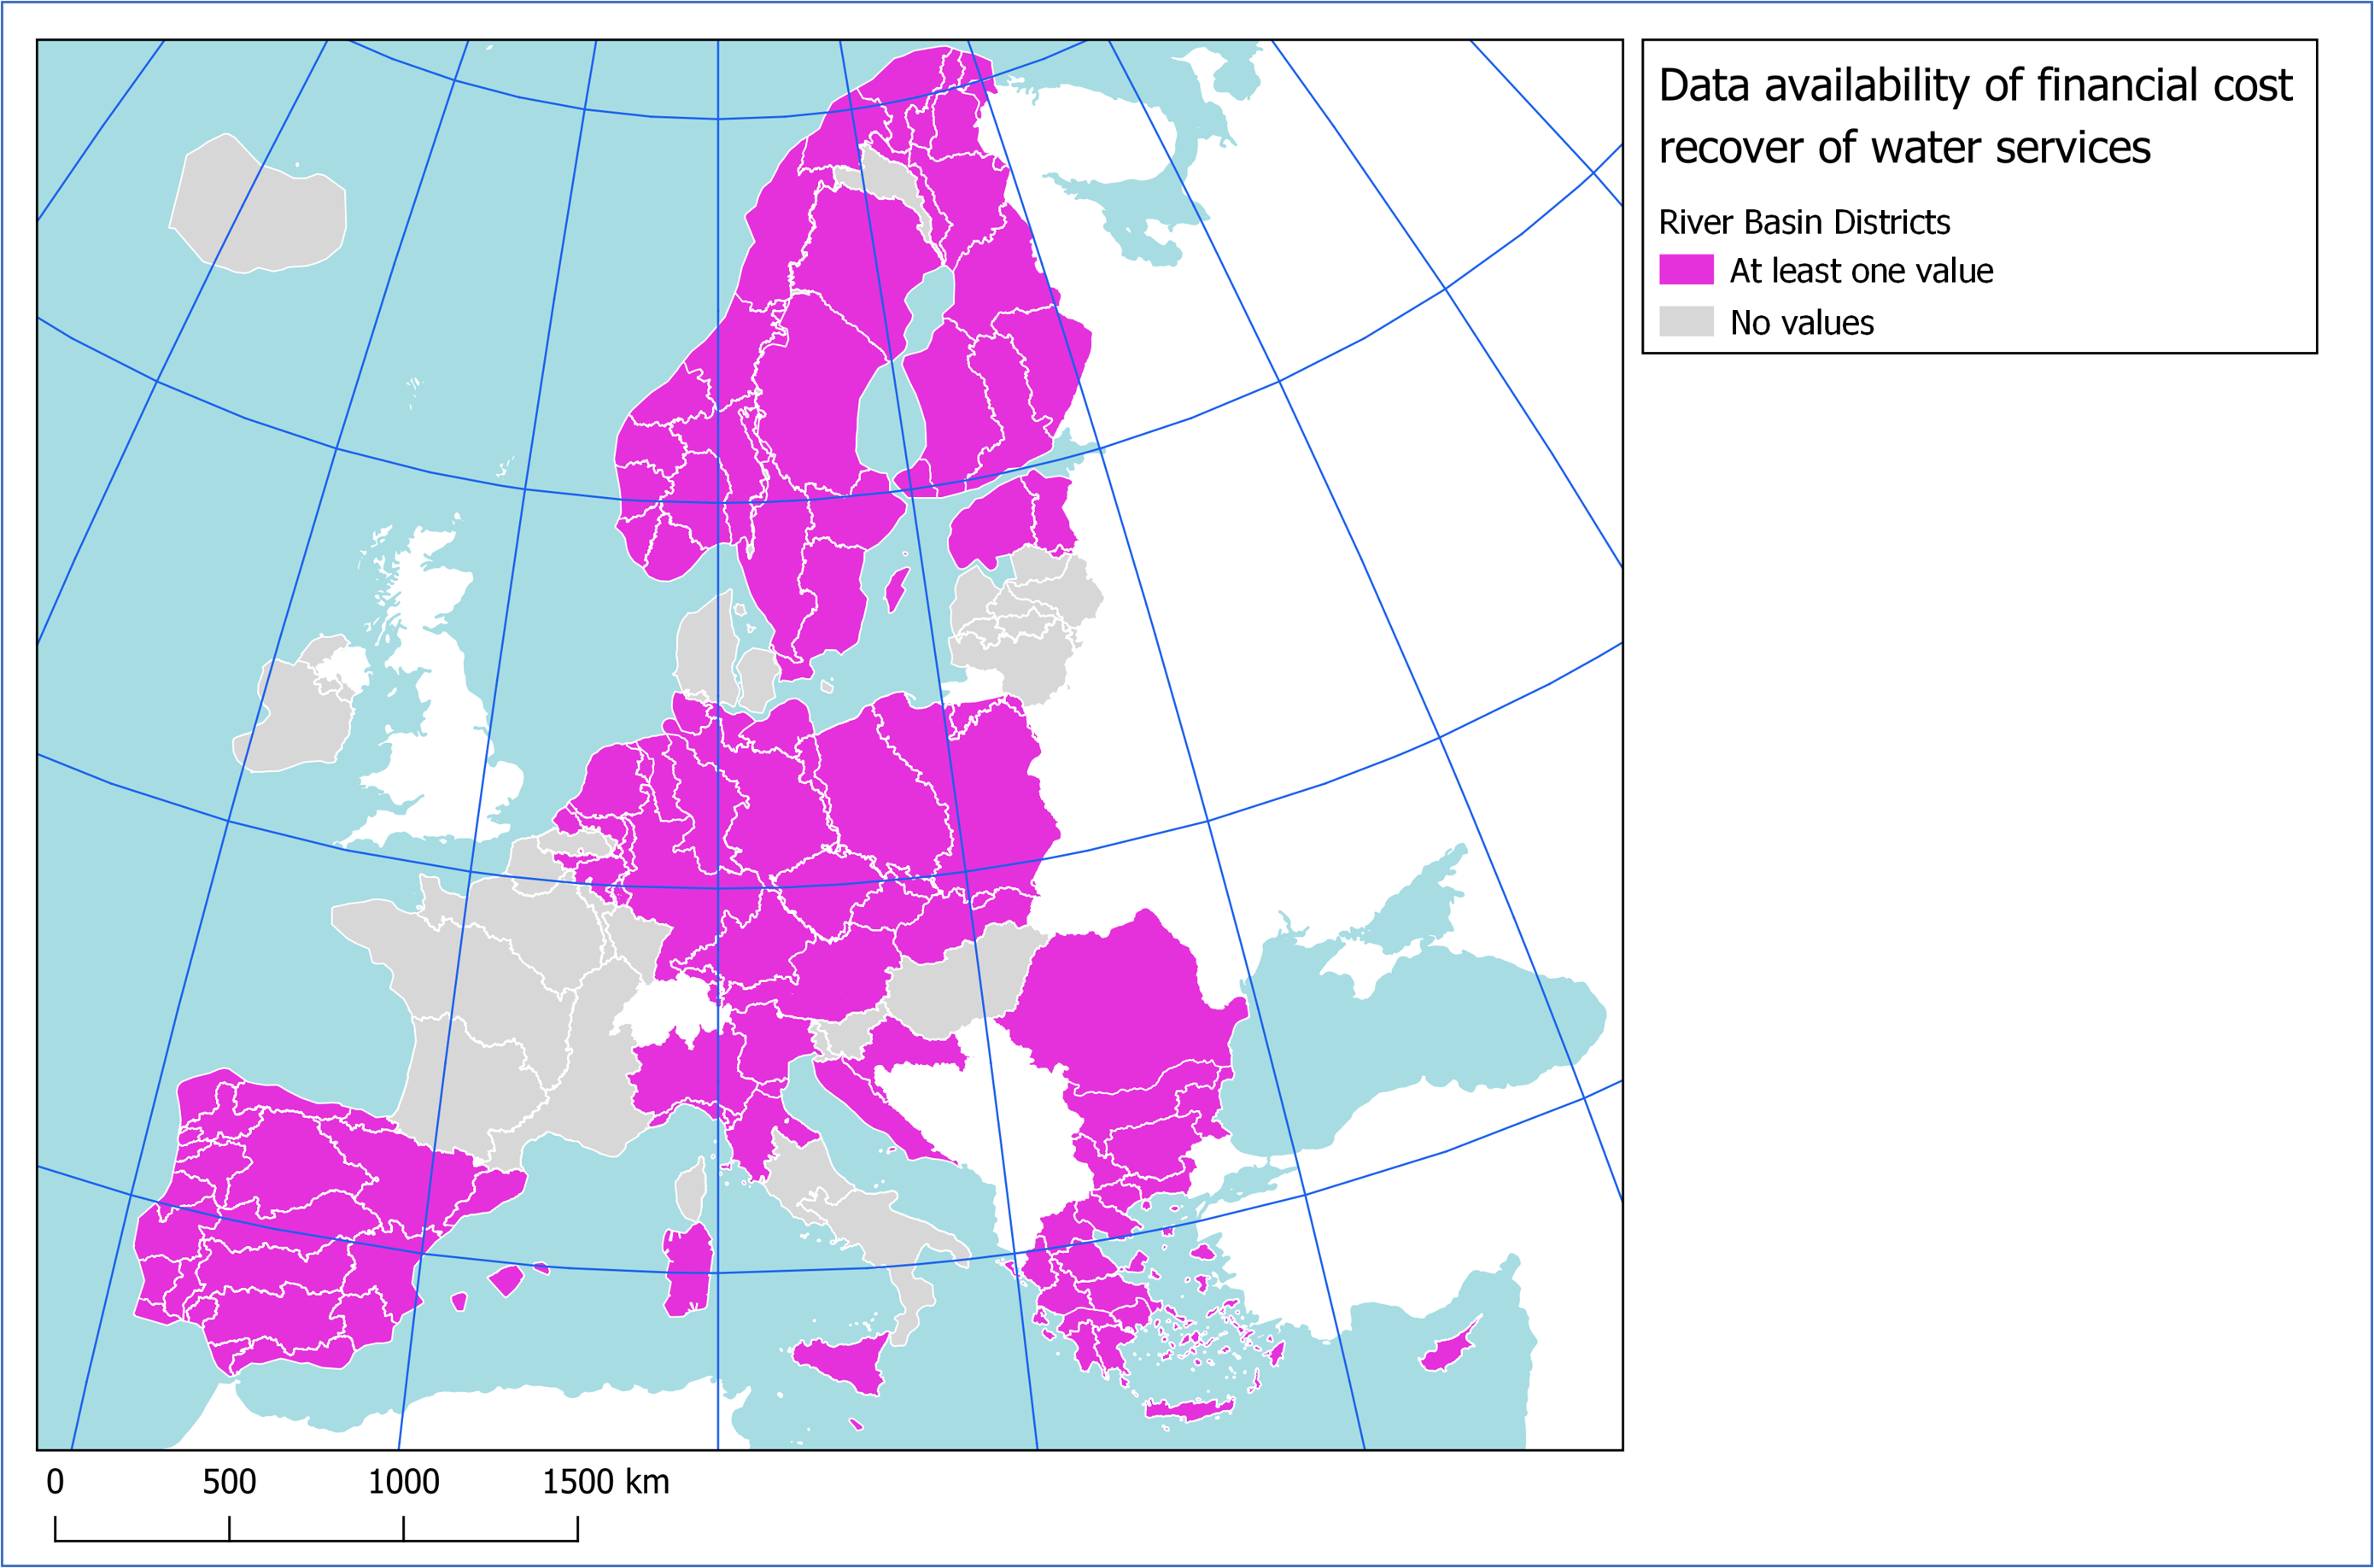
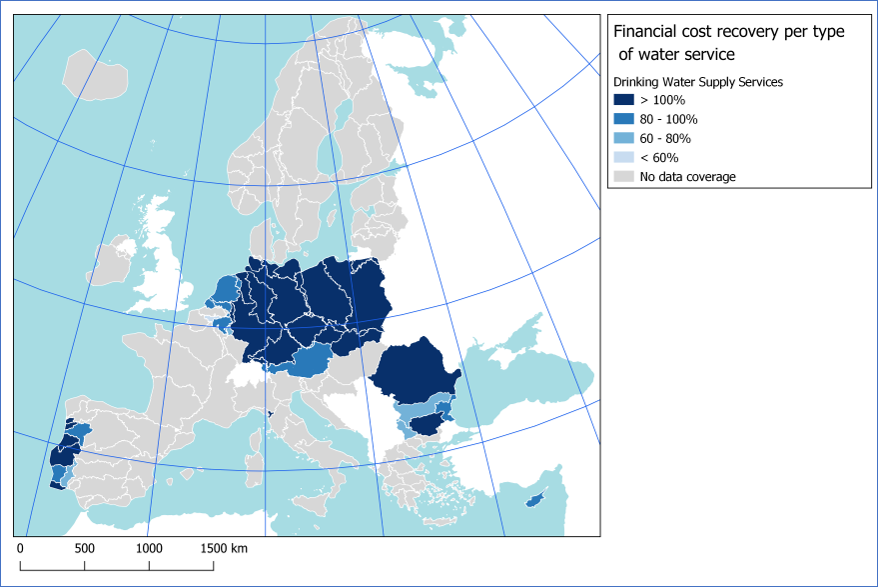
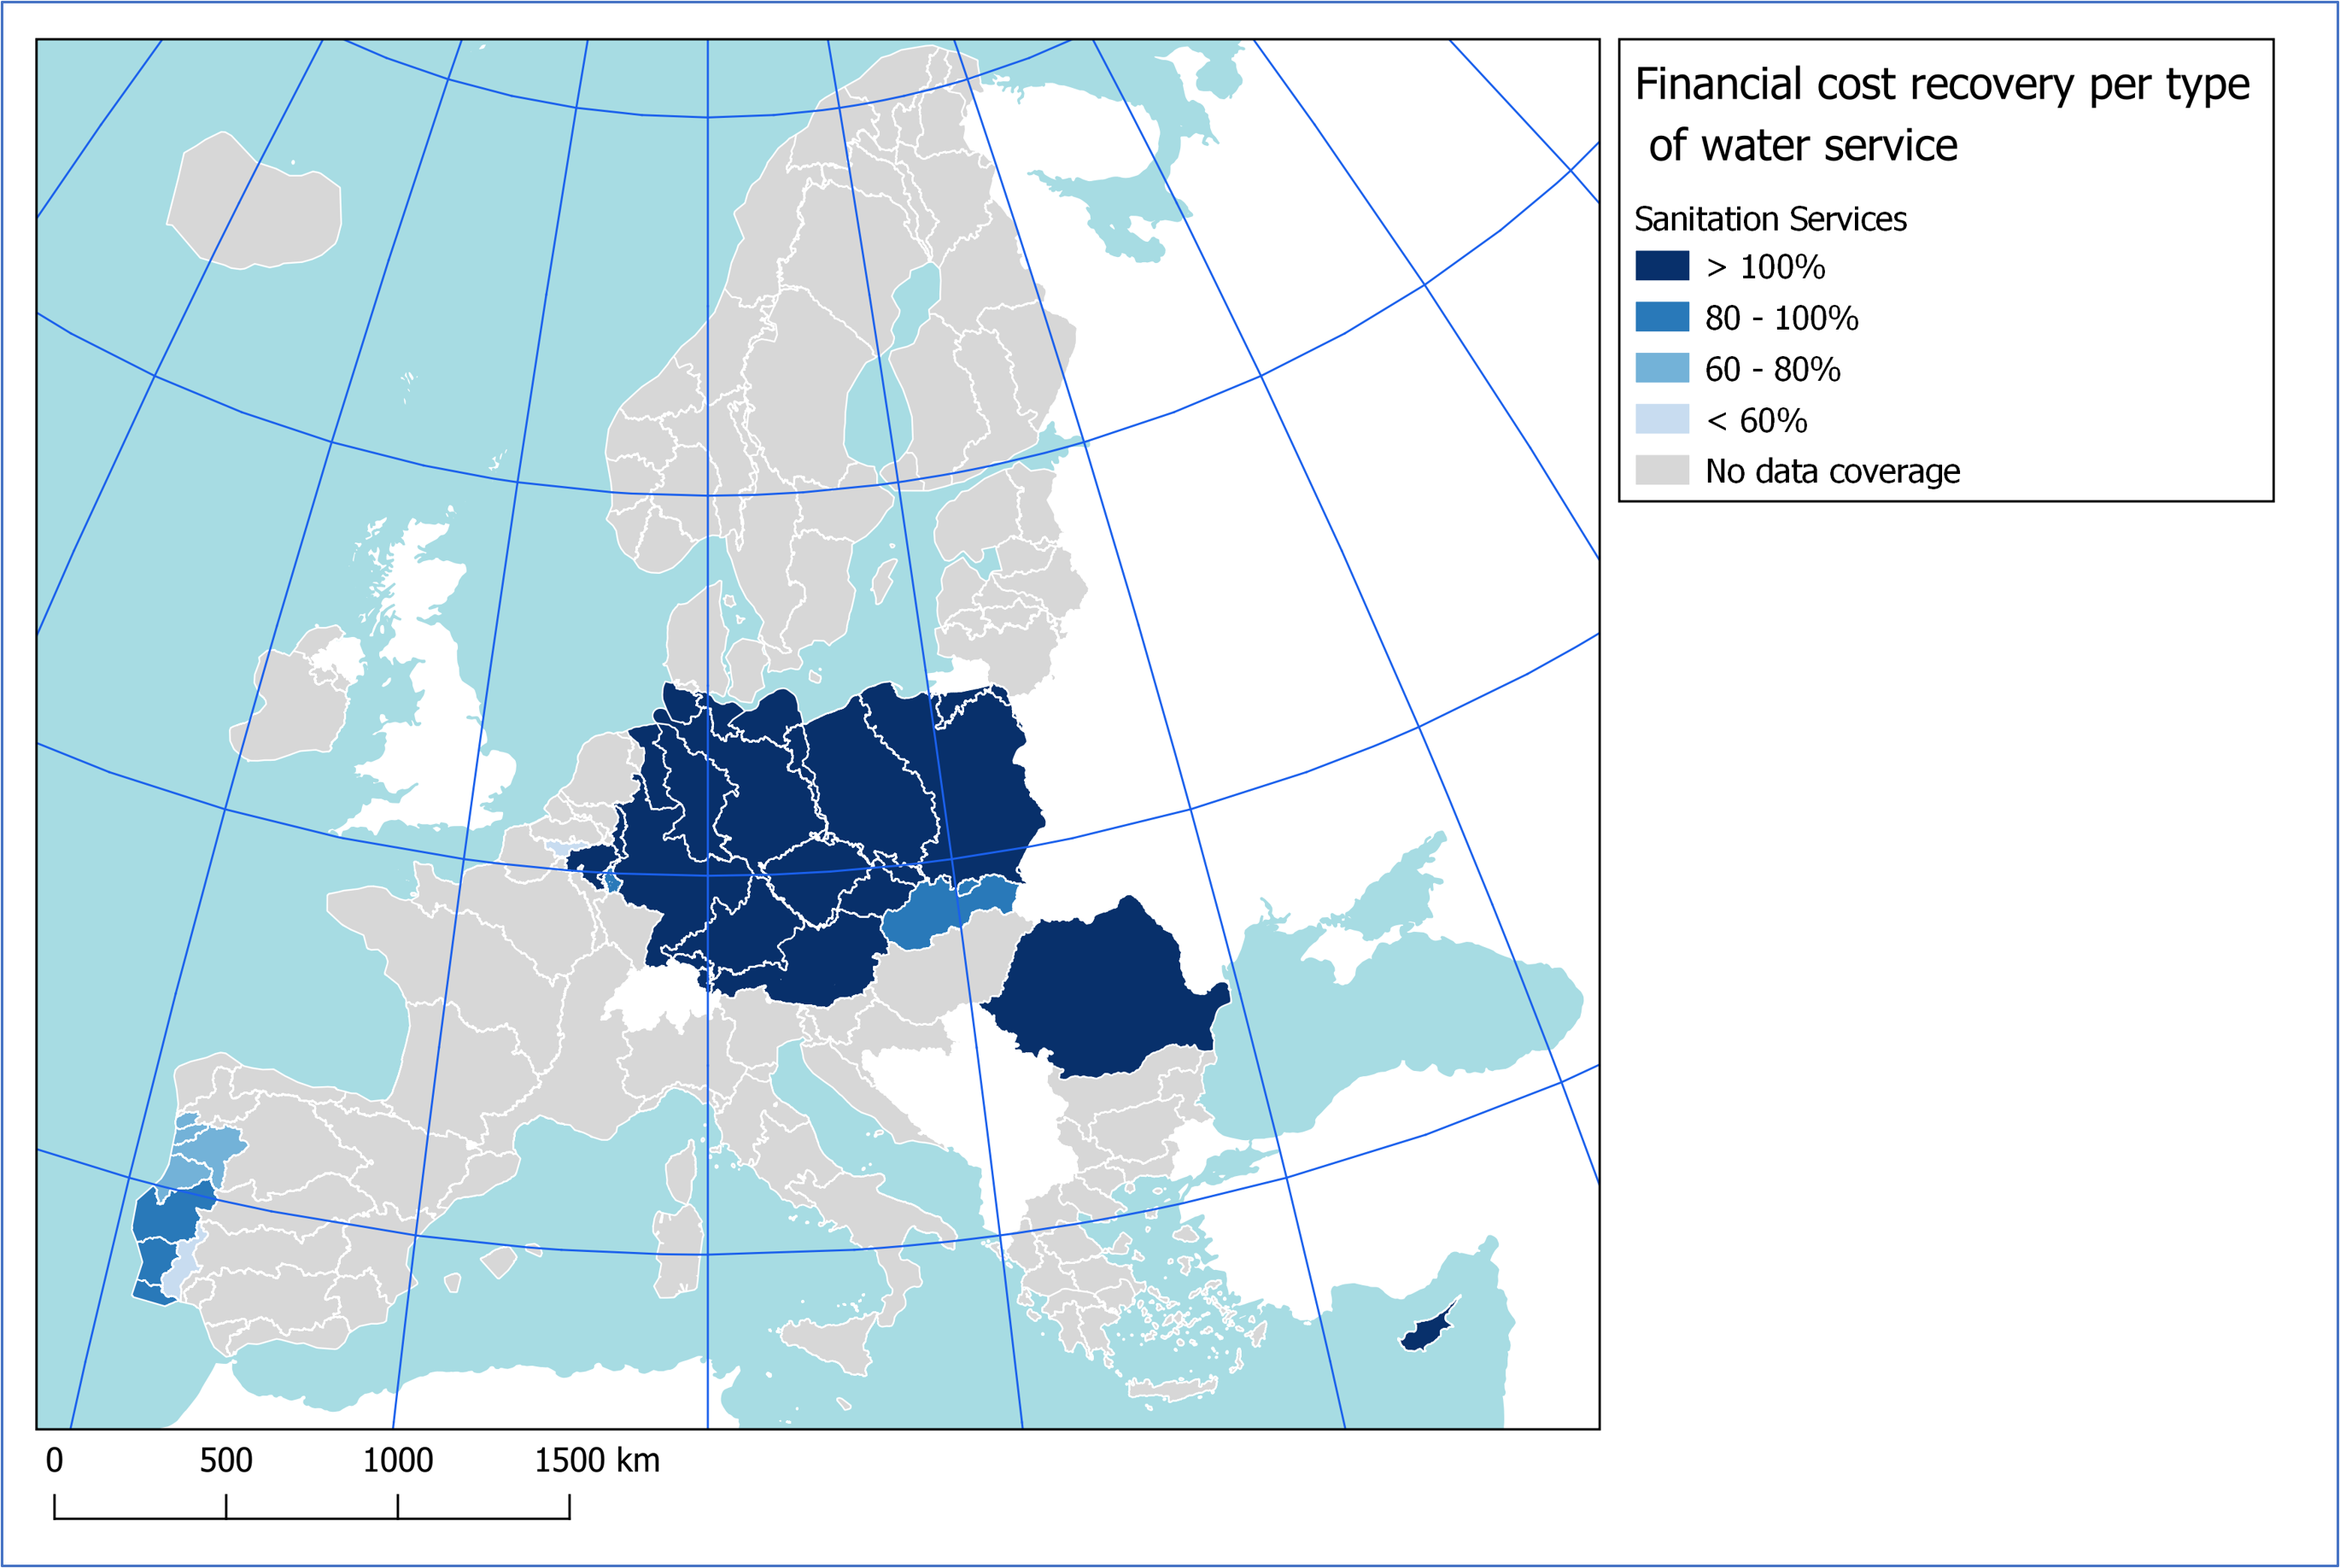
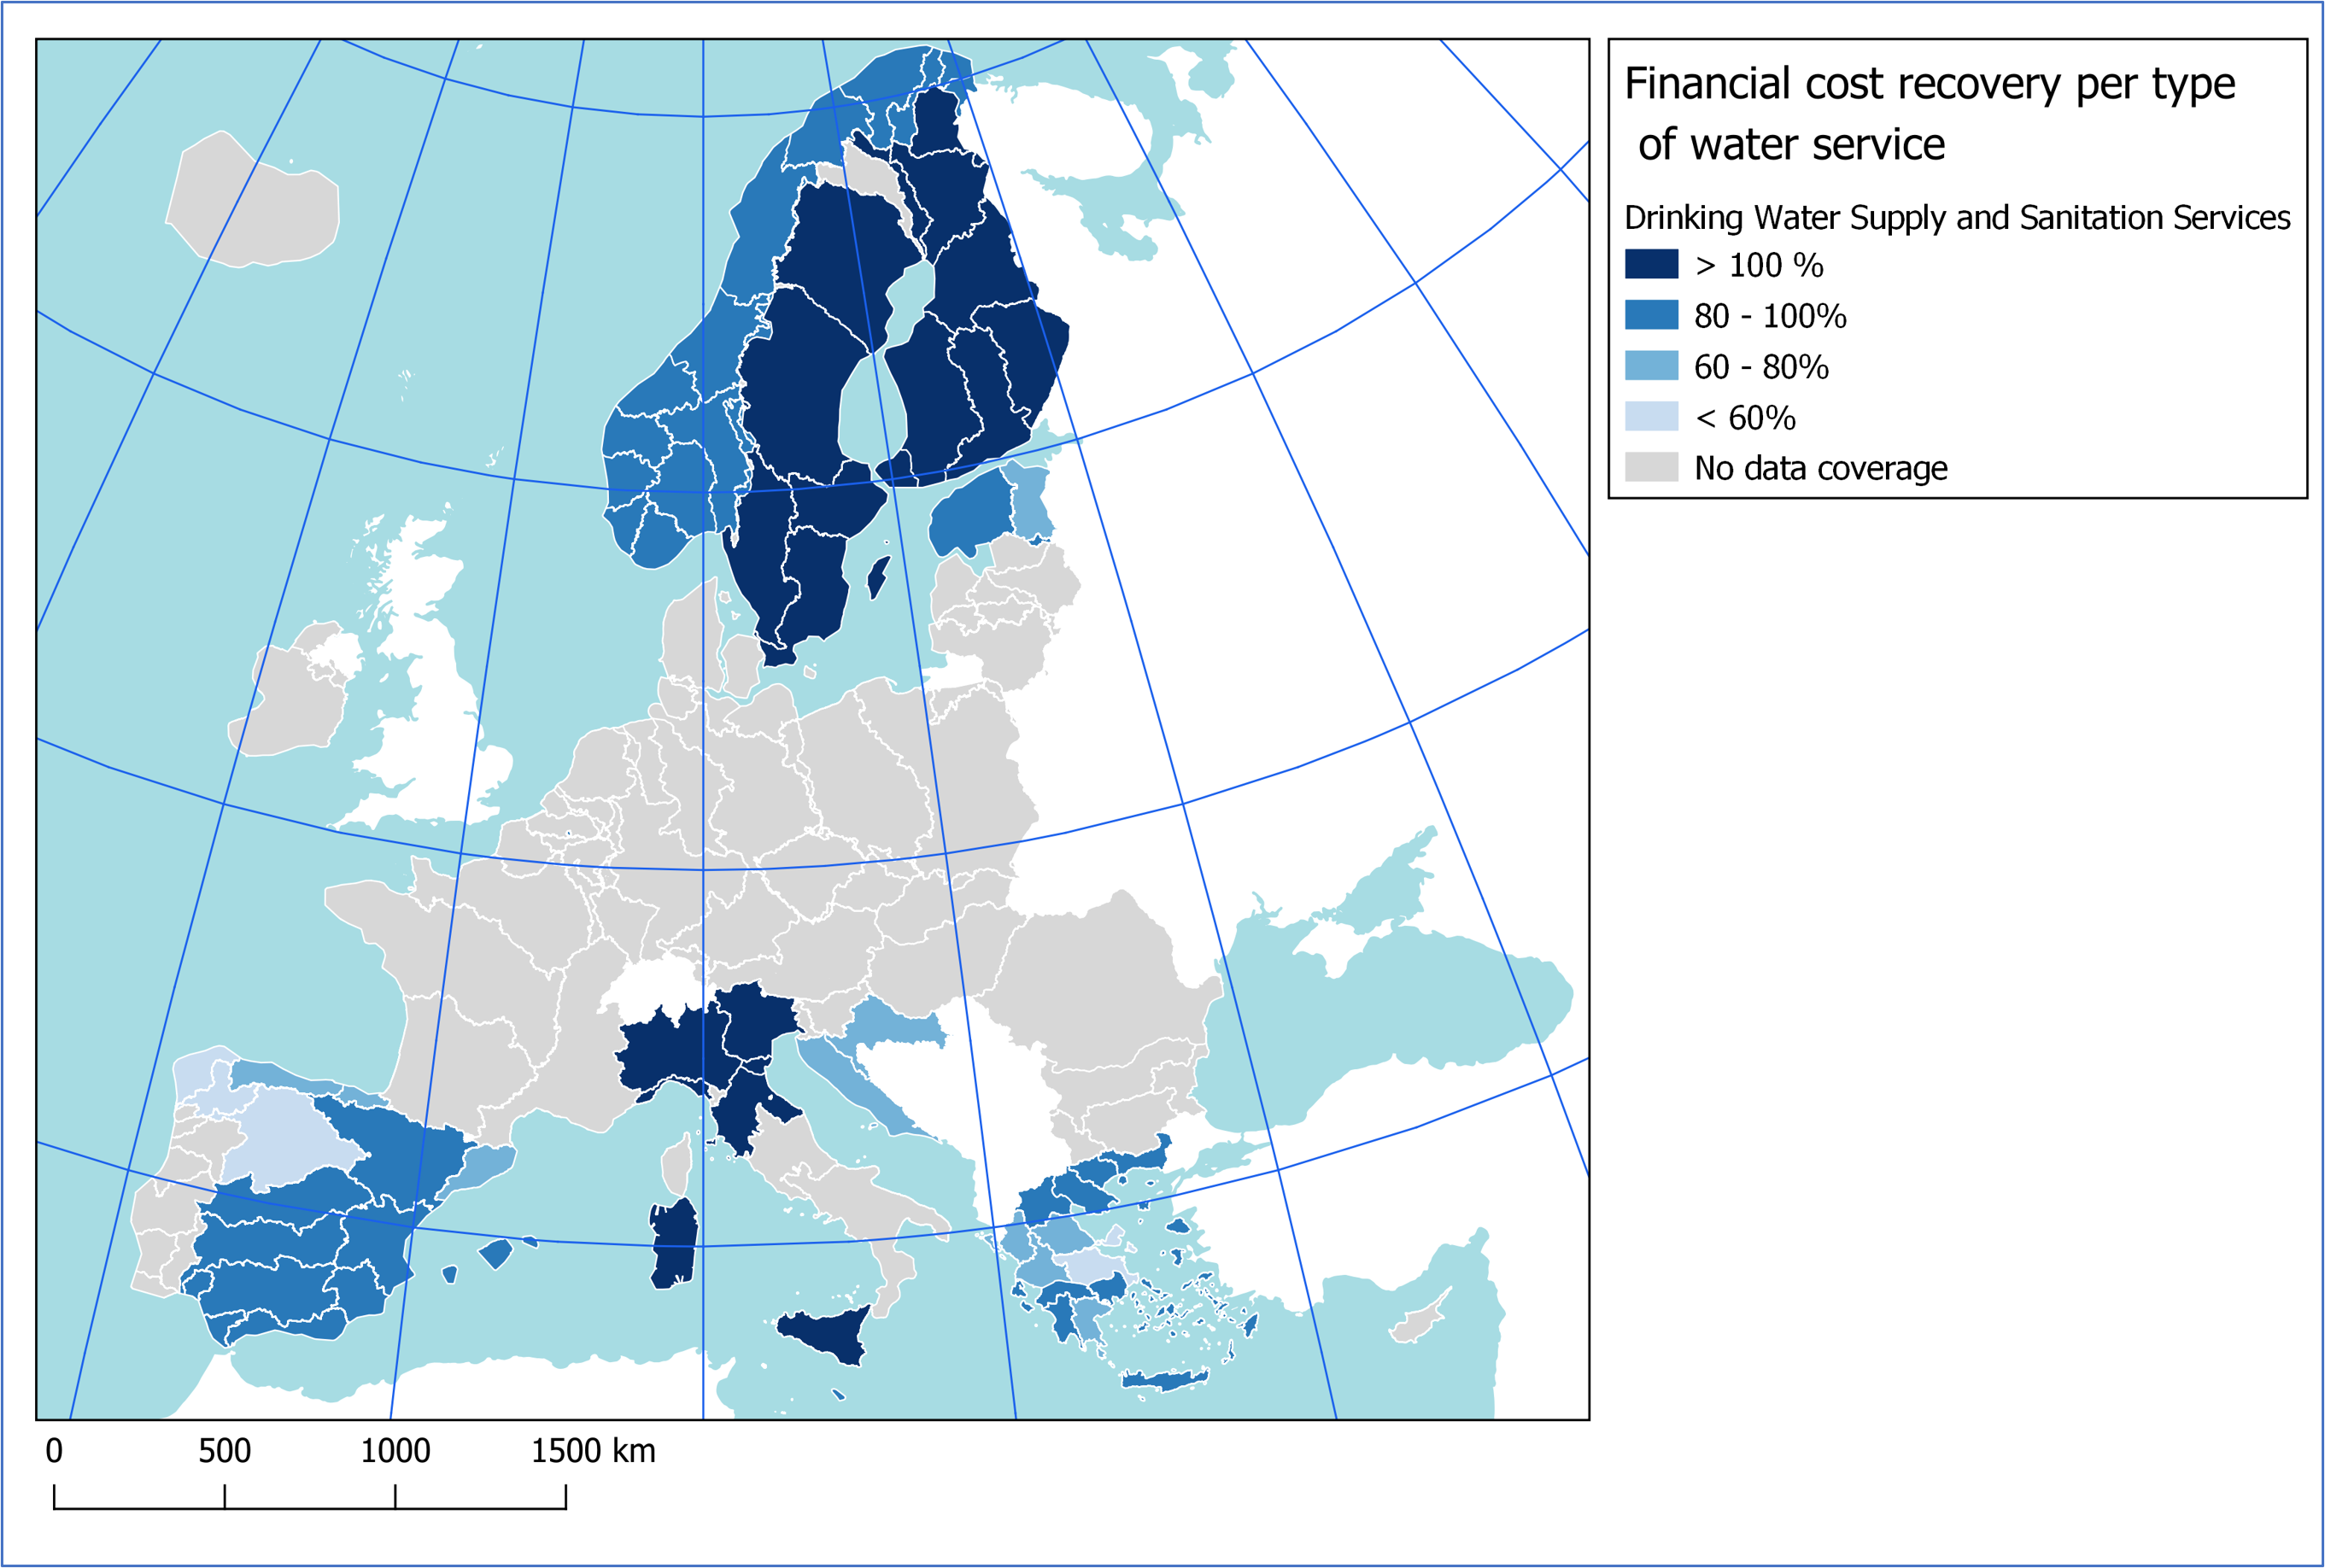
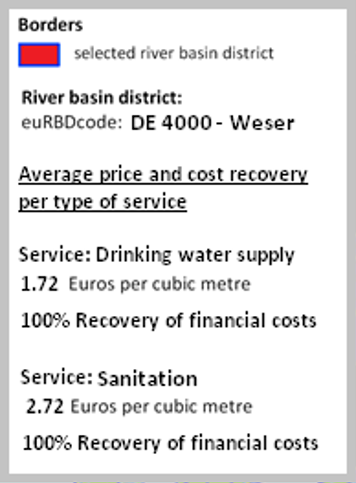
Figure 1 (complementary view). Average price level of combined water supply and sanitation services in main European cities in between 2000-2019 [indicative data view for Brussels city].

(under the dynamic map)
Note: Financial cost recovery levels are shown for the following services reported by the EU Member States: “Drinking water abstraction (surface and/or groundwater), treatment and distribution”; “Sewage collection and wastewater treatment”; “Drinking water abstraction (surface and/or groundwater), treatment and distribution and sewage collection and wastewater treatment (when considered together)”
Data source: 2nd RBMPs (WFD 2016 database; Schema: RBMP PoM – Service)
The financial costs of water supply and sanitation services include operational and maintenance costs, capital investments, and management costs of water service providers (EC, 2003). These can be recovered through revenues from tariffs, associated taxes, and transfers of public funds (national and EU). While data availability on financial cost recovery and water service prices has improved between the 1st and 2nd RBMP cycles (Strosser et al., 2021), large contextual differences restrict comparative analyses. The service price varies both among RBDs within the same country and across countries, as it is influenced by national and local socio-economic policies and conditions, availability and accessibility of water resources, quality of the service, and the cost categories transferred to the user. Similarly, financial cost recovery calculations may vary due to methodological inconsistencies, and estimates should be interpreted with careful consideration of contextual factors like national regulation and reliance on public funding. For instance, in some cases national regulation does not allow service providers to charge users for the costs of infrastructure that has been paid with public funds.
Acknowledging the methodological challenges associated with the economic aspects of the WFD, this indicator has been designed to help reactivate the discussion on these topics by illustrating the current data capacity on a) the financial cost recovery and water service price levels as reported by MS, and b) the affordability of water services in Europe.
European citizens (EU 27 + Norway) pay on average between 0.26-2.56 Euro/m3 for drinking water abstraction, treatment and distribution services (“public water supply”). In the 2nd RBMPs, recovery of financial costs of public water supply was higher than 100% in 23 RBDs and between 80%-100% in 25 RBDs. In some RBDs, such as Odra RBD, Czechia, the financial cost recovery rate for public water supply was as high as 128%, whereas in the international RBD of the Scheldt, Belgium, the financial cost recovery rate was reported lower than 1%. 10 RBDs did not report financial cost recovery data for this service in the 2nd RBMPs.
Sewage collection and wastewater treatment (“sanitation”) is another type of service considered. This service is particularly important for reducing the pollution pressure on surface and groundwater resources and freshwater ecosystems. European citizens pay on average between 0,27-4,52 Euro/m3 for sanitation services. The service price paid by users in 19 RBDs covers over 100% of the financial costs associated to keeping the collection and treatment system operational (e.g. 119% in Odra RBD, Czechia). In further 18 RBDs the financial cost recovery ranges between 80-100%, and in 4 RBDs between 60-80%. Financial cost recovery for this service is less than 60% in 4 RBDs (10% in Azores RBD, Portugal; 2.5% in the international RBD of the Seine, Belgium; 1% in the international RBD of the Scheldt, Belgium). 10 RBDs did not report data on financial cost recovery for this service.
In many RBDs, price levels are reported for combined water supply and sanitation services. The average price levels in such cases range between 0,16-4,18 Euro/m3. Recovery of financial costs is higher than 100% in 9 RBDs (e.g. 123% in Kokemäenjoki Bothnian sea RBD, Finland), and 80%-100% in 52 RBDs. 60-80% cost recovery is observed in 15 RBDs and less than 60 % in 6 RBDs (e.g. 36% in Minho RBD, Spain). 2 RBDs did not report data on the combined water supply and sanitation services.
The lowest financial cost recovery is generally observed in RBDs of Belgium, Bulgaria, Croatia, Greece, Luxembourg, Portugal and Spain.
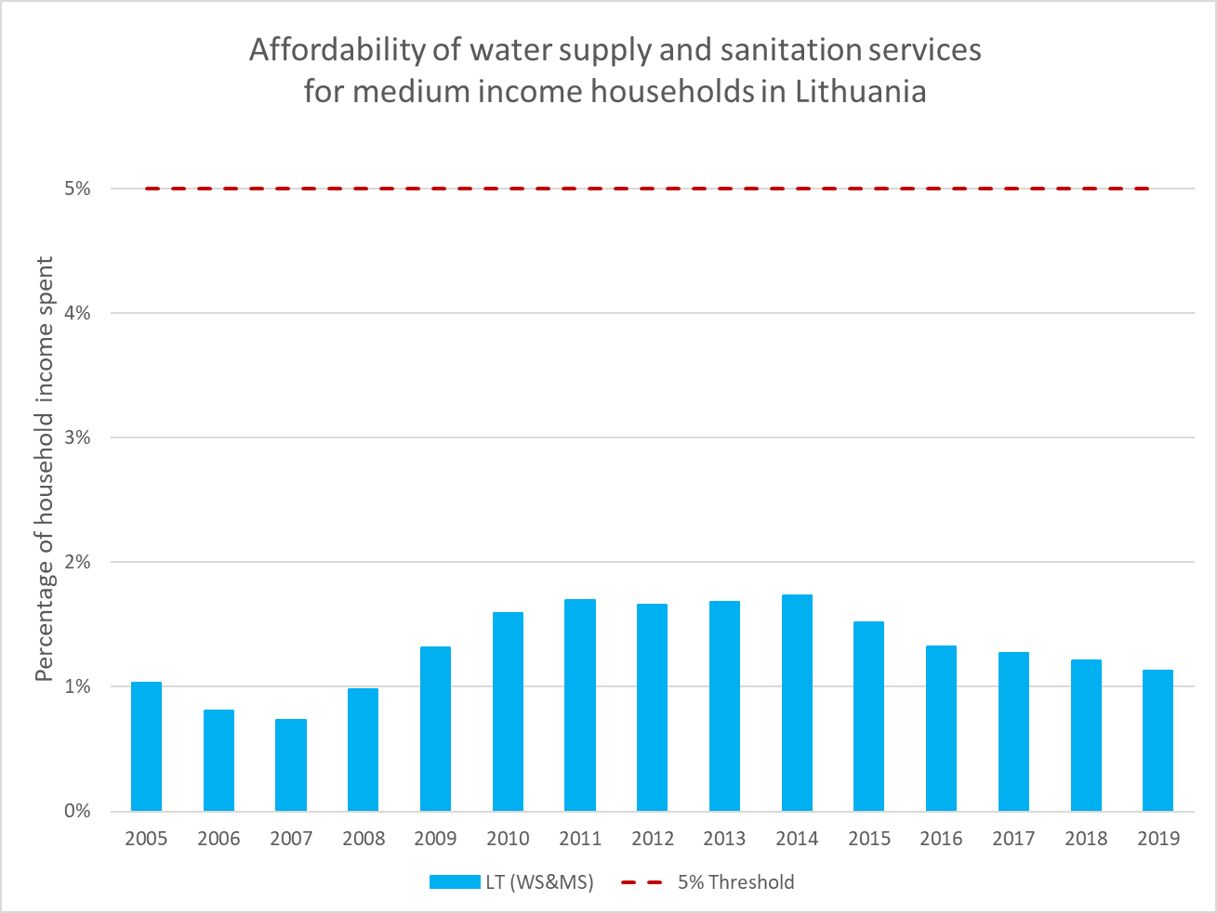
Figure 2 (main view). Affordability of water supply and sanitation services (relative to other household needs) over the period 2005-2019. [indicative data view for medium income households in Lithuania].
NOTE: Final scale and structure of illustrating the information on affordability will be decided at the later stages in accordance with capability of EEA IT infrastrucure
Data source: Eurostat (Final consumption expenditure of households by consumption purpose (COICOP 3 digit) [NAMA_10_CO3_P3__custom_1306597]; Number of private households by household composition, number of children and age of youngest child [lfst_hhnhtych]; Average household size - EU-SILC survey [ilc_lvph01]; Mean and median income by household type - EU-SILC and ECHP surveys [ilc_di04]; and Distribution of income by quantiles - EU-SILC and ECHP surveys [ilc_di01].
Additional tab- for a view of the relative burden of water services on household income against other household needs
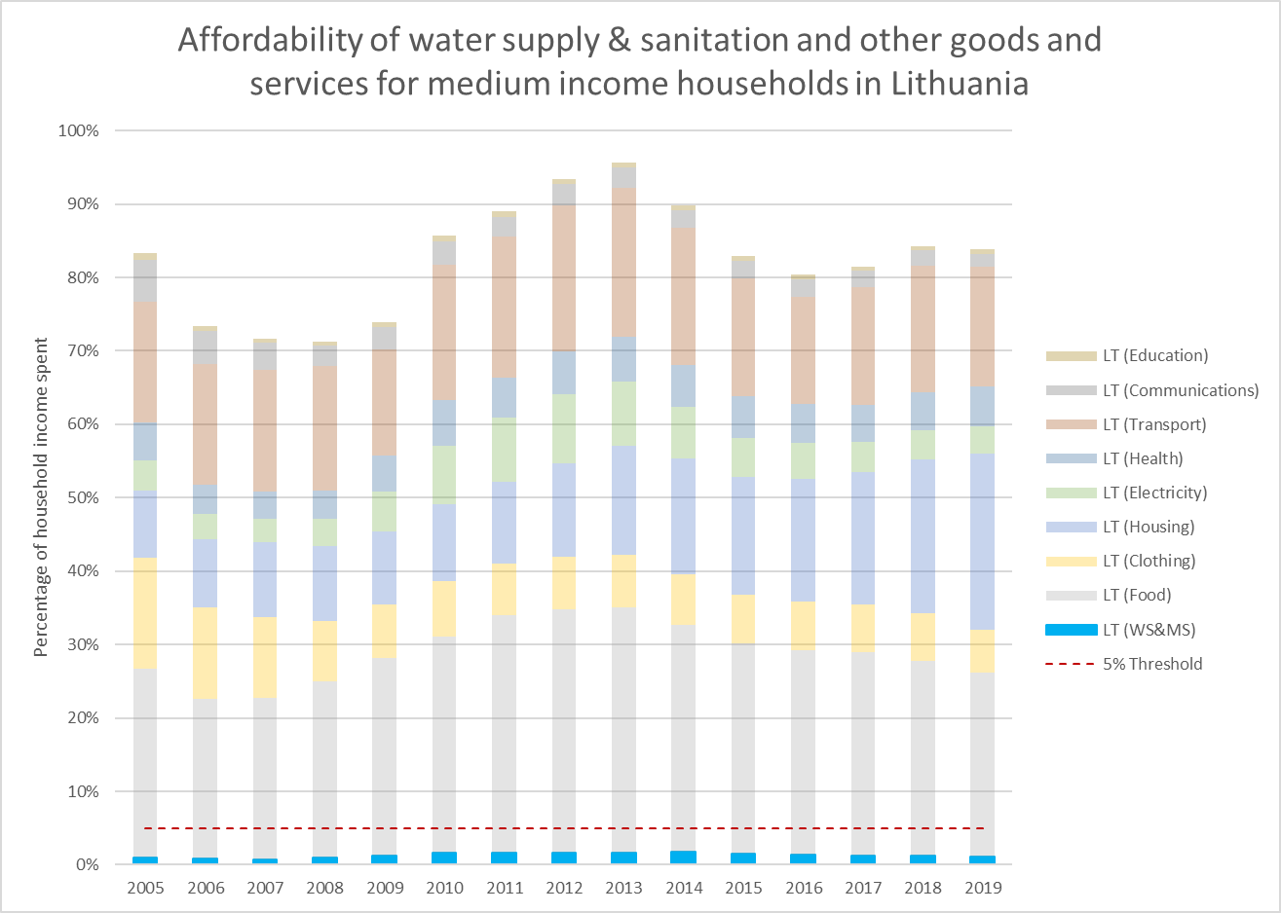
Figure 2 (complementary view). Affordability of water supply and sanitation services (relative to other household needs) over the period 2005-2019. [indicative data view for low income households in Lithuania].
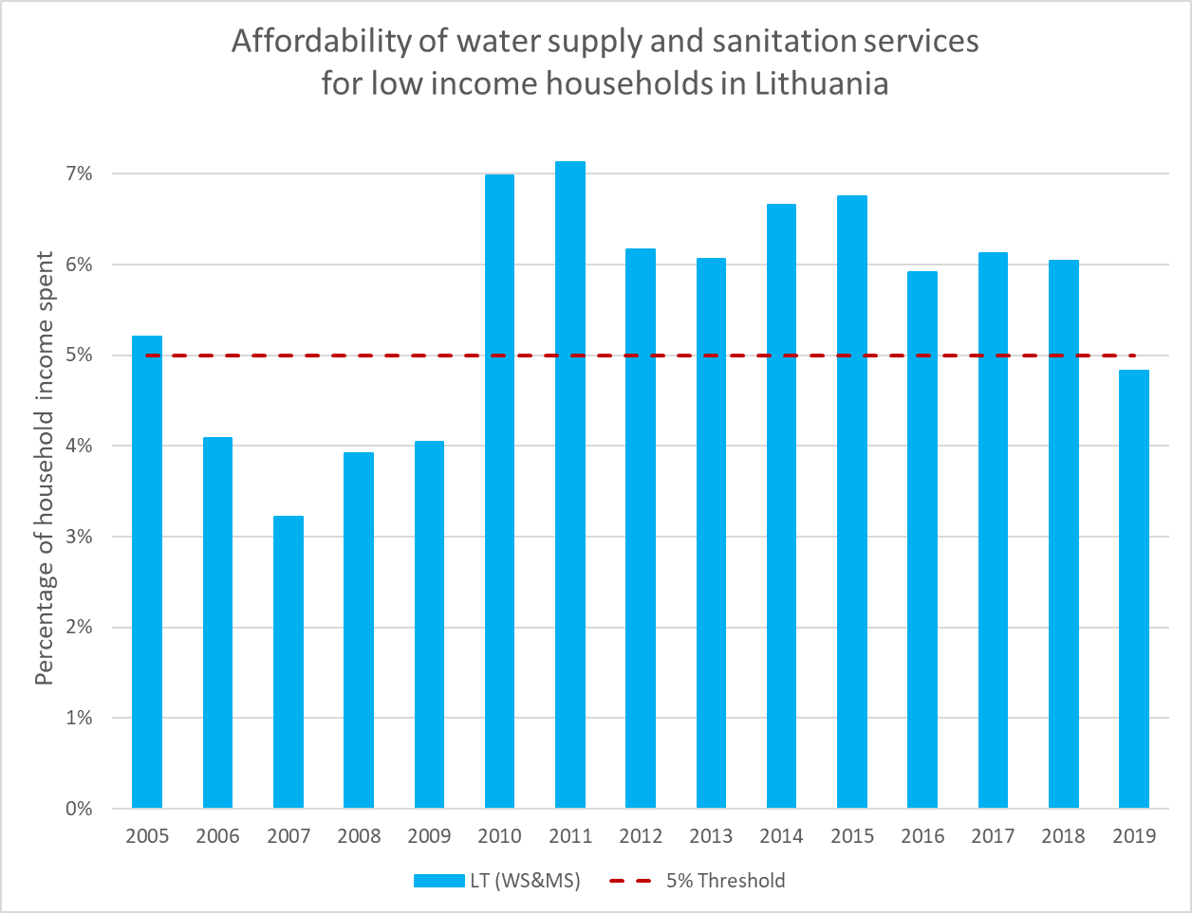
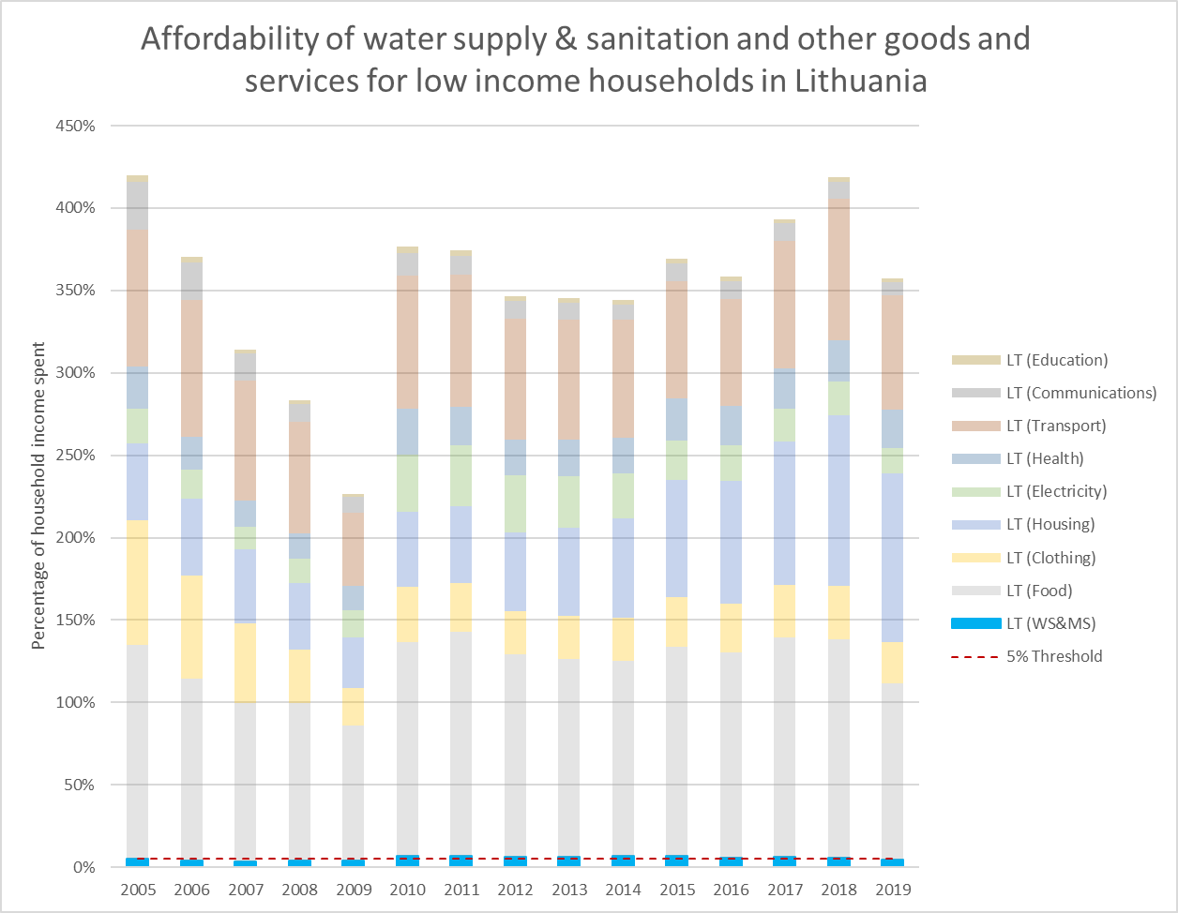
Note: Geographical coverage: Belgium, Bulgaria, Czechia, Denmark, Germany, Estonia, Ireland, Greece, Spain, France, Croatia (from 2009), Italy, Cyprus, Latvia, Lithuania, Luxembourg, Hungary, Malta, Netherlands, Austria, Poland, Portugal, Romania, Slovenia, Slovakia, Finland, North Macedonia (from 2011), Serbia (from 2012).
Affordability of water services
The WFD requires using economic instruments to promote efficient and sustainable water use and to contribute to the long-term protection of Europe’s water resources. EU Member States are requested to incorporate principles such as full cost recovery and incentive water pricing into their pricing schemes for water services. Simultaneously, water services should remain affordable for all segments of society, in accordance with the “Leaving no one behind” principle of the 2030 Agenda for Sustainable Development and the EU 2030 target on poverty and social exclusion. The interplay between these policy objectives may limit the extent to which water tariffs can leverage cost recovery levels (OECD, 2020).
During 2005-2019, expenditure on water supply and sanitation services in European countries remained consistently the lowest among expenditure on other household needs. Nonetheless, middle income households in Lithuania, Latvia and Greece exhibit the lowest levels of residual income left after covering the household needs considered (4-10% in the worst years). This leaves little margin to absorb additional price hikes in the future. Alternatively, households in western European countries such as Ireland, the Netherlands and France often had 50% or more of their income still available after covering such expenses during the same period, while their expenditure on water supply services is comparatively low.
A remarkable increase in expenditure levels for water supply services is observed in Romania (5.1 %) for the period, followed by high and moderate ones for Croatia (3.3%), Poland (1.5 %) and Slovakia (1.5%), respectively. Acknowledging the challenges associated with defining an affordability threshold for water services and with using it across countries, applying a 5% indicative threshold suggests that affordability of water services may be a concern for Romania in 2012 (4,4%), 2017 (4,7%) and 2019 (5,4%), and to less extent for Croatia in 2013 (3,3%).