
Post a comment on the text below
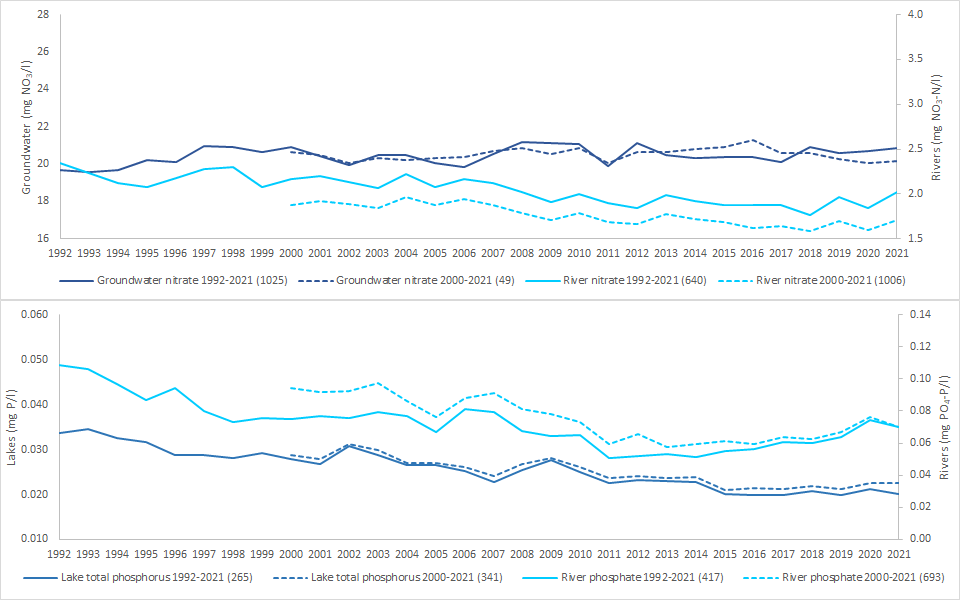
Figure 1. Nutrients in European water bodies
Notes:
Additional information
The geographical coverage is the 38 EEA member countries, but only complete time series are included in the analysis. The selected time series are aggregated to European level by averaging across all sites for each year.
Two time series are shown – a longer time series representing fewer water bodies and a shorter time series representing more water bodies.
Upper chart:
Nitrate in groundwater: The number of groundwater bodies included per country is given in parenthesis:
- 1992-2021: Europe (475), Austria (14), Belgium (24), Bulgaria (25), Denmark (1), Estonia (16), Finland** (7), France (260), Germany (67), Ireland (49), Portugal (2), Slovakia (4), Slovenia (5), Spain (1).
- 2000-2021: Europe (1025), Austria (14), Belgium (37), Bulgaria (40), Cyprus (6), Czechia (64), Denmark (4), Estonia (18), Finland** (8), France (452), Germany (176), Ireland (66), Italy (10), Latvia (11), Malta (2), Portugal (10), Serbia (21), Slovakia (16), Slovenia (6), Spain (25), Switzerland (37).
Nitrate in rivers: The number of river monitoring sites included per country is given in parenthesis:
- 1992-2021: Europe (640), Albania (3), Belgium (26), Czechia (22), Denmark* (36), Estonia (34), Finland** (60), France** (3), Germany (119), Ireland** (4), Latvia (13), Lithuania (22), Poland (13), Slovakia (8), Slovenia (7), Spain** (154), Sweden* (110), Switzerland (6).
- 2000-2021: Europe (1006), Albania (7), Belgium (34), Cyprus (13), Czechia (22), Denmark* (37), Estonia (36), Finland** (69), France** (3), Germany (122), Iceland (1), Ireland** (50), Italy (25), Latvia (16), Lithuania (22), North Macedonia (17), Poland (16), Romania (89), Serbia (33), Slovakia (8), Slovenia (8), Spain** (250), Sweden* (112), Switzerland (16).
(* = all data total oxidised nitrogen, ** = some data total oxidised nitrogen)"
Lower chart:
Phosphate in rivers: The number of river monitoring sites included per country is given in parenthesis:
- 1992-2021: Europe (417), Belgium (24), Bulgaria (32), Czechia (10), Denmark (38), Estonia (35), Finland (59), Ireland (4), Latvia (13), Lithuania (22), Norway (18), Slovakia (6), Slovenia (7), Spain (33), Sweden (110), Switzerland (6).
- 2000-2021: Europe (417), Albania (3), Belgium (28), Bulgaria (53), Croatia (23), Czechia (10), Denmark (39), Estonia (37), Finland (66), Iceland (1), Ireland (33), Italy (18), Latvia (16), Lithuania (22), Norway (18), Romania (88), Serbia (33), Slovakia (6), Slovenia (8), Spain (46), Sweden (112), Switzerland (16).
Total phosphorus in lakes: The number of lake monitoring sites included per country is given in parenthesis:
- 1992-2021: Europe (265), Austria (5), Denmark (5), Estonia (7), Finland (143), Germany (3), Lithuania (2), Netherlands (6), Norway (2), Slovenia (2), Sweden (90).
- 2000-2021: Europe (341), Austria (27), Belgium (1), Bulgaria (1), Croatia (3), Denmark (5), Estonia (8), Finland (167), France (1), Germany (6), Lithuania (3), Netherlands (6), Norway (3), Poland (9), Serbia (3), Slovenia (3), Sweden (95).
You cannot post comments to this consultation because you are not authenticated. Please log in.
Previous comments
It is advisable to consider presenting also data from a shorter reporting period, which will allow to include countries that started reporting data to the Agency in later years.