
Table of contents
1 - Indicator text and figures
Summary
In European rivers, oxygen consuming substances decreased over the period 1992 to 2020. Biochemical oxygen demand (BOD) fell to half of the 1992 level, but remained steady at around 2.5 mg O2/l since 2010. Ammonium concentrations fell to a 23% of the 1992 level. After 2014, the level stabilised around 100 µg N/l. The decrease in BOD and ammonium concentrations is a consequence of the improvement in wastewater treatment. The 1990s economic crisis in central and eastern European countries also resulted in decreasing pollution from manufacturing industries.
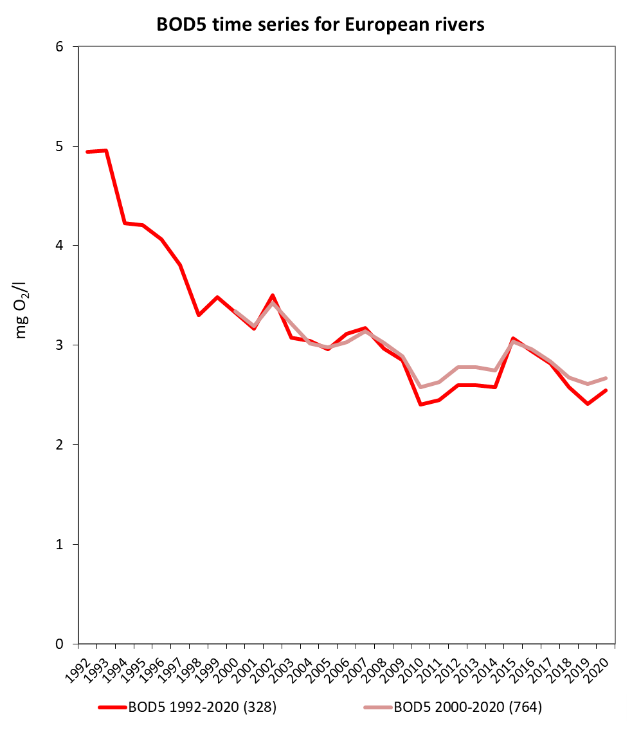
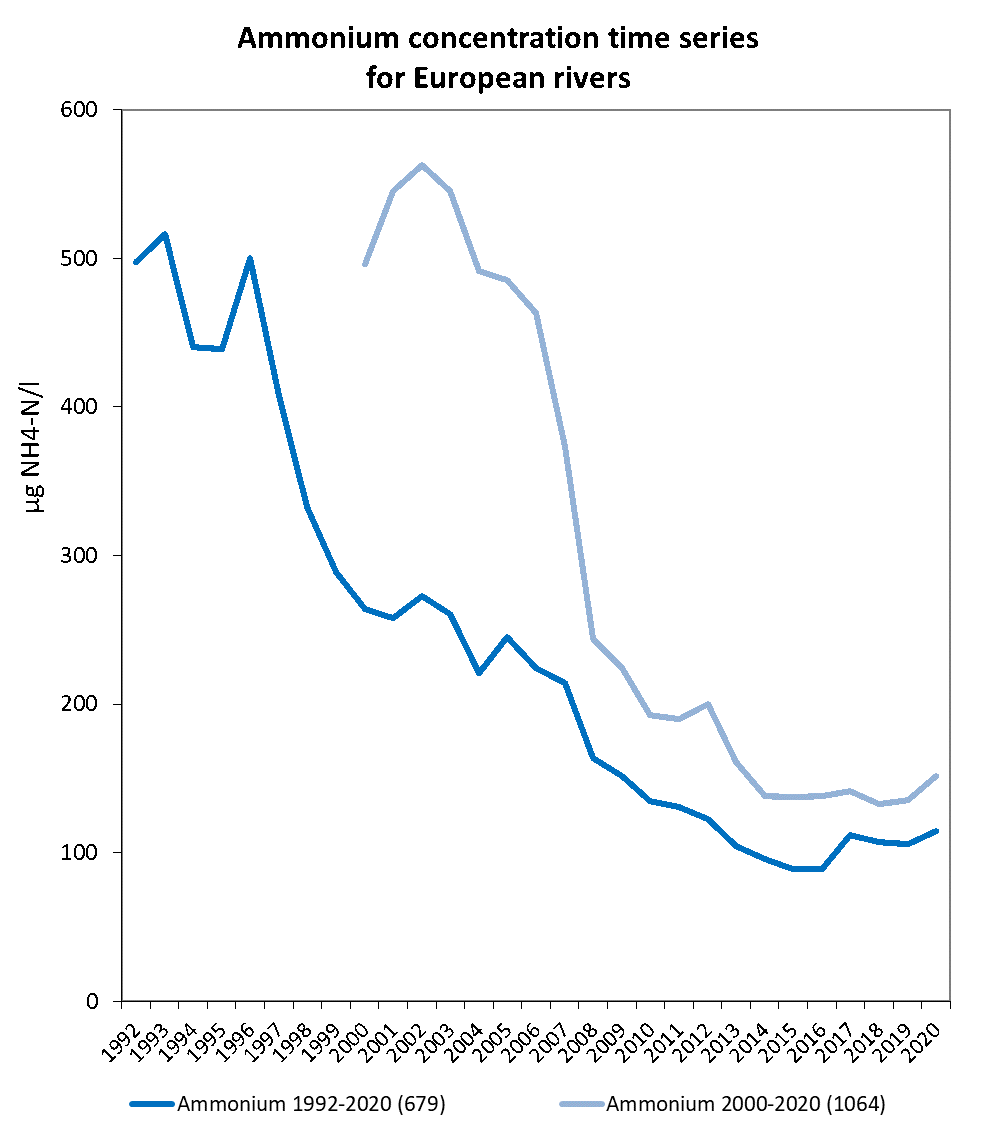
Note: The data series are calculated as the average of annual mean concentrations for river sites in Europe. Only complete time series after inter/extrapolation are included (see indicator specification). BOD7 data has been recalculated into BOD5 data. Two time series are shown – a longer time series representing fewer water bodies and a shorter time series representing more water bodies.
BOD in rivers: The number of river monitoring sites included per country is given in parenthesis:
1992-2020: Albania (4), Austria (44), Belgium (26), Bulgaria (57), Czechia (22), Estonia (33), Finland (5), Ireland (3), Latvia (13), Lithuania (22), North Macedonia (4), Slovakia (8), Slovenia (8), Spain (78), Sweden (1).
2000-2020: Albania (5), Austria (46), Belgium (36), Bulgaria (74), Croatia (23), Cyprus (4), Czechia (22), Estonia (35), Finland (5), Ireland (14), Italy (44), Latvia (16), Lithuania (22), North Macedonia (8), Poland (90), Romania (88), Serbia (34), Slovakia (8), Slovenia (10), Spain (179), Sweden (1).
Ammonium in rivers: The number of river monitoring sites included per country is given in parenthesis:
1992-2020: Albania (4), Austria (30), Belgium (20), Bulgaria (38), Estonia (35), Finland (60), France (160), Germany (119), Ireland (4), Latvia (12), Lithuania (21), North Macedonia (5), Norway (29), Slovenia (9), Spain (22), Sweden (111).
2000-2020: Albania (8), Austria (46), Belgium (23), Bulgaria (57), Croatia (23), Estonia (37), Finland (69), France (237), Germany (122), Iceland (1), Ireland (27), Italy (25), Latvia (15), Lithuania (22), North Macedonia (18), Norway (29), Poland (4), Romania (89), Serbia (34), Slovenia (10), Spain (55), Sweden (113).
Aggregate level assessment
Organic pollution of rivers from waste water, both municipal and industrial, as well as diffuse runoff from agriculture, negatively affect aquatic ecosystems, causing loss of oxygen and changes in species composition (i.e. deterioration of ecological status). Severe organic pollution may lead to the rapid de-oxygenation of river water, high concentration of hazardous ammonia and disappearance of fish and aquatic invertebrates. In addition, it can have negative effects on the use of the water for human purposes such as drinking, bathing and recreation. Without treatment, organic pollution is slowly diluted and degraded naturally along the river course. Biochemical oxygen demand (BOD) and ammonium are key indicators of organic pollution in water. BOD is the amount of dissolved oxygen needed (i.e. demanded) by aerobic biological organisms to break down organic matter present in a given water sample at a certain temperature over a specific time period. The BOD value is most commonly expressed in milligrams of oxygen consumed per litre of sample during 5 days of incubation at 20°C. Ammonium is toxic to aquatic life at certain concentrations in relation to water temperature, salinity and pH. BOD and ammonium increase with higher loads of biologically degradable organic matter.
Key sources of organic pollution are municipal waste water; industrial waste water, especially from paper or food processing industries, and agricultural emissions, especially from surface runoff of silage, manure and slurry from intensive livestock farms.
BOD
In European rivers, BOD levels have generally been decreasing between 1992 and 2020 (Figure 1a), with an average annual decrease in BOD of 0.06 mg/l (0.7% per year). The BOD reached its lowest level (2.4 mg/l) in 2010 and has only surpassed 3.0 mg/l once since then (in 2015). A significant decrease is evident at 44% of the river sites, with an additional 7% of the rivers having a marginally decreasing trend. A significantly increasing BOD trend is recorded at 12% of the sites.
Ammonium
Annual ammonium concentrations decreased by 10.93 µg/l per year (-2.6% per year) on average over the period 1992-2020 (Figure 1b). Significantly decreasing concentrations were observed at 74% of the sites, with an additional 4% of the sites showing a marginal decrease. No change has been observed at 20% of the river monitoring sites. A significant increase was evident at 1% of the sites.
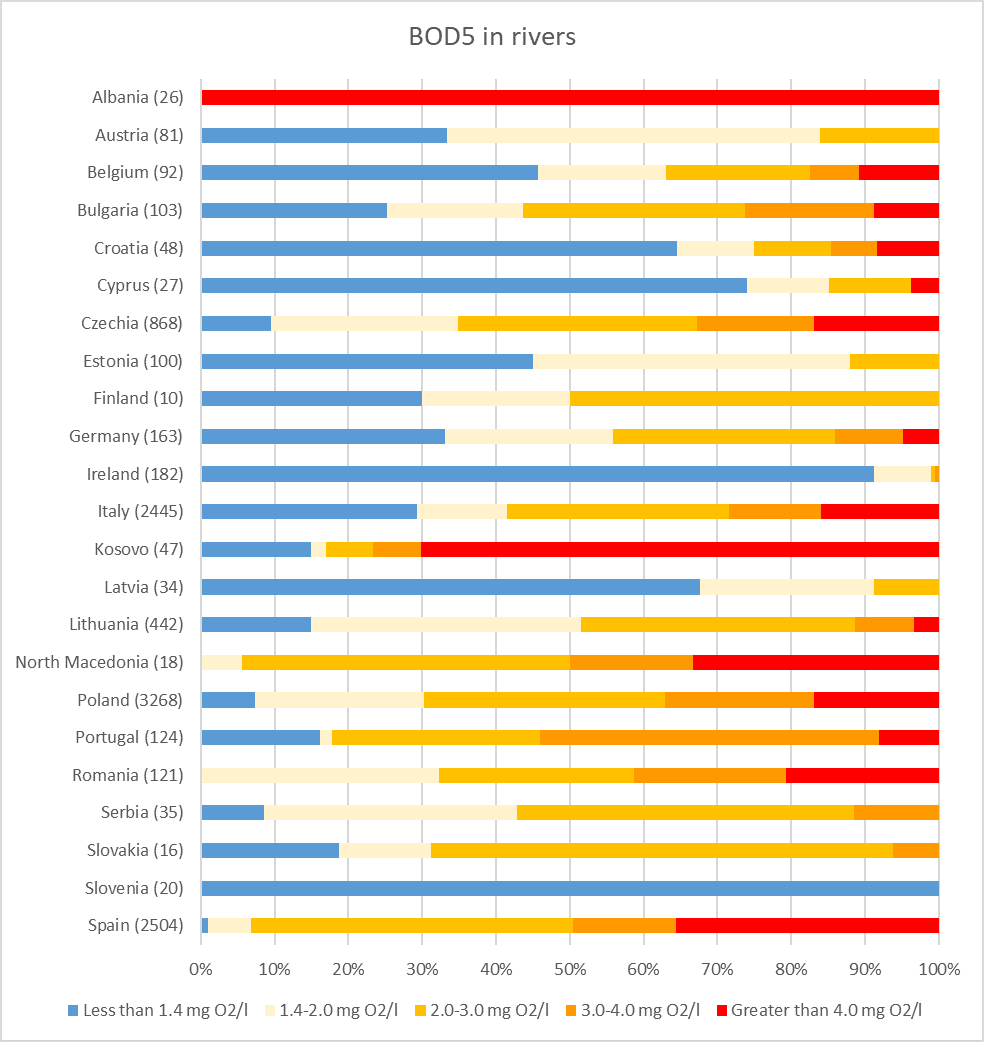
Notes: This figure shows the current status of biochemical oxygen demand in rivers in European Countries
The geographical coverage is the 38 EEA member countries.
Kosovo*: Kosovo (under UNSC Resolution 1244/99).
The current BOD level per river monitoring site is calculated as the average of available annual mean concentrations for the years 2018-2020. BOD is given as mg oxygen per litre (mg O2/l).
The river monitoring sites are assigned to different BOD classes. The number of river monitoring sites per country is given in parenthesis.
Sweden, with BOD data for only two sites, is excluded from the chart since the sites may not be representative for the whole country.
Assessment
The current BOD, averaged for the period 2017-2020, is 3.1 mg O2/l for 24 countries of Europe for which data are available (10 776 sites). Almost two thirds of the river monitoring sites in Europe fall into the three best BOD classes, which is also the recommended water quality for salmonid fish (less than 3 mg/l according to the Fish Directive 2006/44/EC) and recommended water quality for water intended for the abstraction of drinking water (according to the Directive concerning the quality required of surface water intended for the abstraction of drinking water 75/440/EEC).
Countries with the highest share of river sites in the best quality class (less than 1.4 mg/l) are Slovenia (all sites), Ireland (91 % of sites), and Cyprus (74 %). The share of monitored river sites with BOD not satisfying recommendations for salmonid waters is particularly high (more than 50%) in Albania, Kosovo under UNSCR 1244/99, and Portugal. Higher BOD is observed in agriculturally and industrially developed lowlands of Europe, such as the Po valley, and lower BOD in the highlands of Europe such as Scotland, the Alps, and the Dinaric Alps.