
Navigation
Notifications
Post a comment on the text below
Figure 3.4 Number of reported monitoring sites on pesticides per 100 km2 arable land in European countries in the time period 2007 to 2017
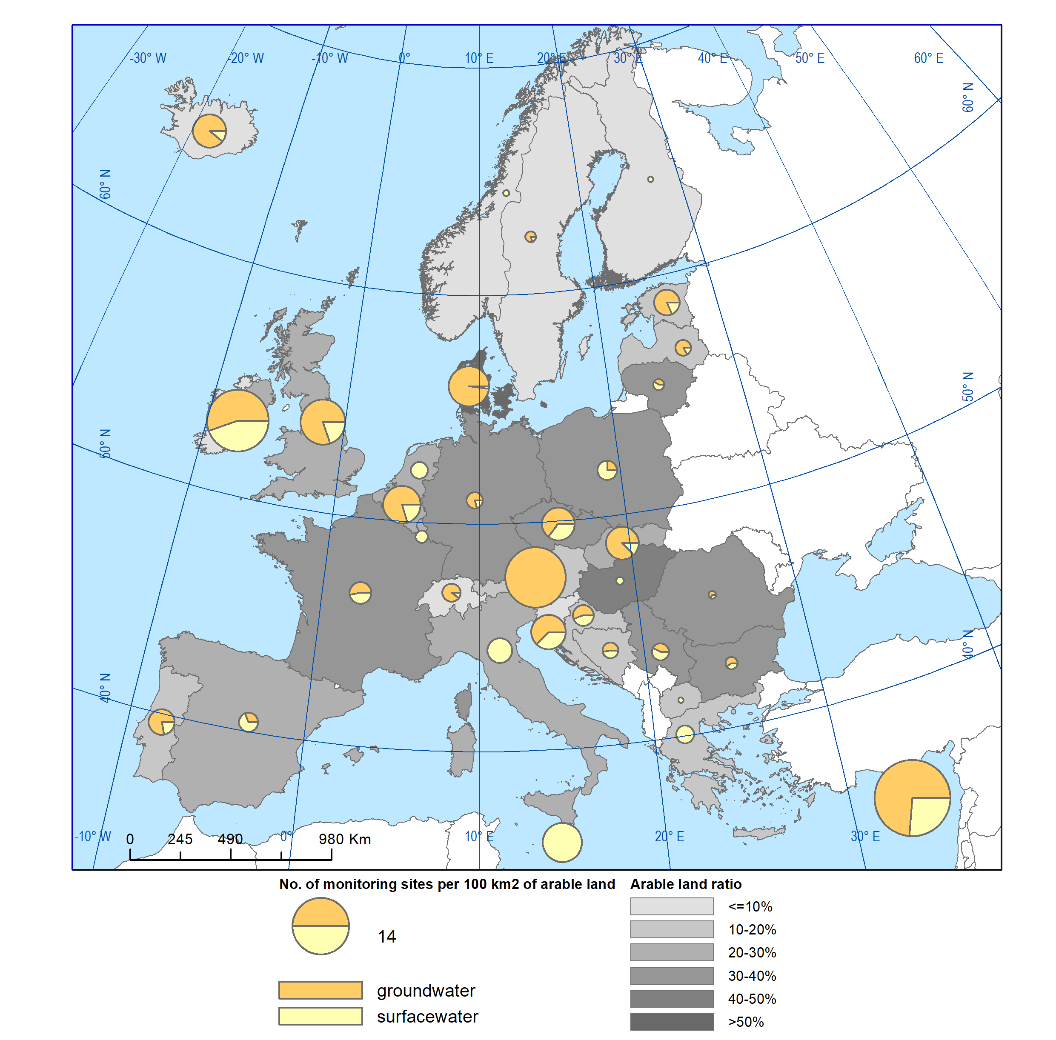
Source: WISE SoE – Water Quality database, version April 2019; Eurostat and Corine Land Cover data on arable land ratio.
You cannot post comments to this consultation because you are not authenticated. Please log in.
Previous comments
(Austria): Pie chart: although it is true that almost all sites in AT are groundwater sites, there are still few surface water sites and this could be highlighted in the pie by a thin line like for DK.