
Table of contents
1. Indicator Assessment: Pesticides in rivers, lakes and groundwater in Europe
Key messages
- Pesticides in surface and groundwaters are relevant to environmental quality, chemicals strategy for sustainability, Zero Pollution and agriculture assessments.
- This indicator focuses on pesticides[1] in rivers, lakes and groundwater based on measured concentrations[2] assessed against effect thresholds.
- 13 to 34% of all surface water monitoring sites showed threshold exceedances of pesticides in surface waters between 2013 to 2019. This was mainly caused by the insecticides imidacloprid and malathion, and the herbicides MCPA, metolachlor and metazachlor. These substances were approved for use in plant protection products during the monitoring period.
- The percentage of pesticides exceeding the groundwater quality standard was lower, at 3 to 17% of monitoring sites. In groundwater, exceedances were mainly caused by the herbicide atrazine and its metabolites. Atrazine was not approved for use in plant protection products during the monitoring period.
- Exceedance rates higher than 30% occurred in 15 out of 30 countries in surface waters, and in one out of 22 countries in groundwater. High exceedance rates were mainly related to monitoring sites in small and medium-sized rivers.
- No trends can be derived at this time, owing to e.g. variation in losses from the application of pesticides between years, or variation in the frequency of monitoring of pesticides in surface waters. For these reasons, between-year changes may not be significant.
[1] Pesticides include both active substances from plant protection products and biocides as well as their relevant metabolites.
[2] Data source: EEA Waterbase - Water Quality
-
Pesticides in surface and groundwaters are relevant to human health (so not only from an environmental quality perspective) as well as these types of waters are the main raw water source for drinking water.
-
Once the results of this analysis will be published, they will likely get a lot of attention. My prediction is that the pesticide regulatory system will be challenged, which is not necessarily bad. However, I think it may be good to highlight that the adoption of the one-out-all-out approach ‘hides’ that for the vast majority of records, effect thresholds were not exceeded. If I interpret the dashboard correctly (very nice BTW), >99% of records were below the effect thresholds for both surface and groundwater (except surface water in 2015). Perhaps it would be appropriate to acknowledge this, in the key messages or somewhere else.
-
Metolachlor is not approved for use in PPPs, S-Metolachlor is, so text needs revision
"13 to 34% of all surface water" - suggest to give an average figure, as this range is so wide that it is difficult to give a clear message. "showed threshold exceedances of pesticides in surface waters between 2013 to 2019".
I suggest it would be more useful and accurate to state "One or more pesticides were detected above threshold values at X % of surface water monitoring sites each year between 2013 to 2019"
Same applies to groundwater with range of 3-17% - the messsage is clearer by giving a simgle average figure.
"The percentage of pesticides exceeding..." is incorrect - the % relates to monitoring sites. I suggest "Exceedances of or more pesticides were detected at X % of ground water monitoring sites each year between 2013 to 2019"
"owing to e.g. variation in losses from the application of pesticides between years" - the meaning is not clear. is there any evidence that losses vary between years?
"For these reasons, between-year changes may not be significant." If this is correct, the uncertainty around the % figures needs to be highlighted more prominently
-
Support the point raised by Alessio Ippolito - it is important to state clearly that 99% of PPPs are not found in water above threshold values/0.1ug/l
-
Suggest to mention Green Deal and F2F in the first line, given that these are mentioned later in the text
-
PiRLG1:
This used working method also shows that different compounds are used to show one sort of visualization. This means that although within the WFD reporting priority substances are shown differently than national targeted substances. The former representing chemical status and the latter ecological status.
It cannot be stated enough that only data from (official) reporting is used. This concerns data used for WFD reporting. This means a.o. that emerging compounds are not presented in the current report.
Usage of the lowest EQS for the latter mentioned substances can lead to a different judgement within this indicator (PiRLG1) / report when compared to WFD reporting. Is it possible to state in which case(s), which substances, this will be the case? In PiRLG3 a table is shown in which the MS with lowest EQS is mentioned.
Usage of the lowest EQS for the latter mentioned substances can lead to a different judgement within this report when compared to WFD reporting. Is it possible to state in which case(s), which substances, this will be the case? In PiRLG3 a table is shown in which the MS with lowest EQS is mentioned.
PiRLG2: Although using the lowest EQS could lead to different judgement(s) – see prior comment – I am charmed by the overview of substances of national relevancy.
PiRLG5: Within national legislation (in the Netherlands) also the sum of pesticides must not exceed a threshold value. Within the current report this is nog taken into account. Is it possible to use a sum of various pesticides to come up with a judgment of ‘sum parameters’?
-
Comment from German Federal State Schleswig-Holstein:
The indicator concept was tested with a dataset derived from the WFD monitoring of the German Federal State Schleswig-Holstein. The results were:
- Surface waters: EQS exceedances were found especially in small rivers with the herbicides Flufenacet and Diflufenican, followed by the herbicide Nicosulfuron and the insecticide / biocide Imidacloprid on top of a list of 10 pesticides. Flufenacet was found in bigger rivers too, but, due to dilution, no EQS exceedances have been detected.
- Groundwater: We acknowledge, that the indicator does not use “Non relevant Metabolites” since there is no agreed EU threshold. In Germany these metabolites are assessed with “Health Related Indication Values (HRIV)“ specialized for each metabolite. Exceedances of these threshold values for the non-relevant metabolites are the main causes of the poor status in the group of plant protection and degradation products.
-
We suggest that an INFO should be added which would inform the public/readers, that this indicator should not be compared with national classification due to differences in methodologies.
-
I agree to the previous comment that some info could be added already here that the indicator is not comparable to the national water classification under WFD.
It’s not easy to make a good indicator based on reported very heterogenious monitoring data -and without harmonized quality standards. Indicator tries give the overview of the situation and has to simplify the system. I think that the uncertainties related to data and method should be stated clearly already in the key messages.
In addition to the last point “No trends..”, it’s clear that neither countries can be compared (the other one having several monitoring sites in background areas and the other a few in risky areas). Perhaps this could be added to the text. Moreover, a new point could be added e.g. “The indicator demonstrates the need of EU wide harmonizing of limit values (including national RBSP EQS values)”.
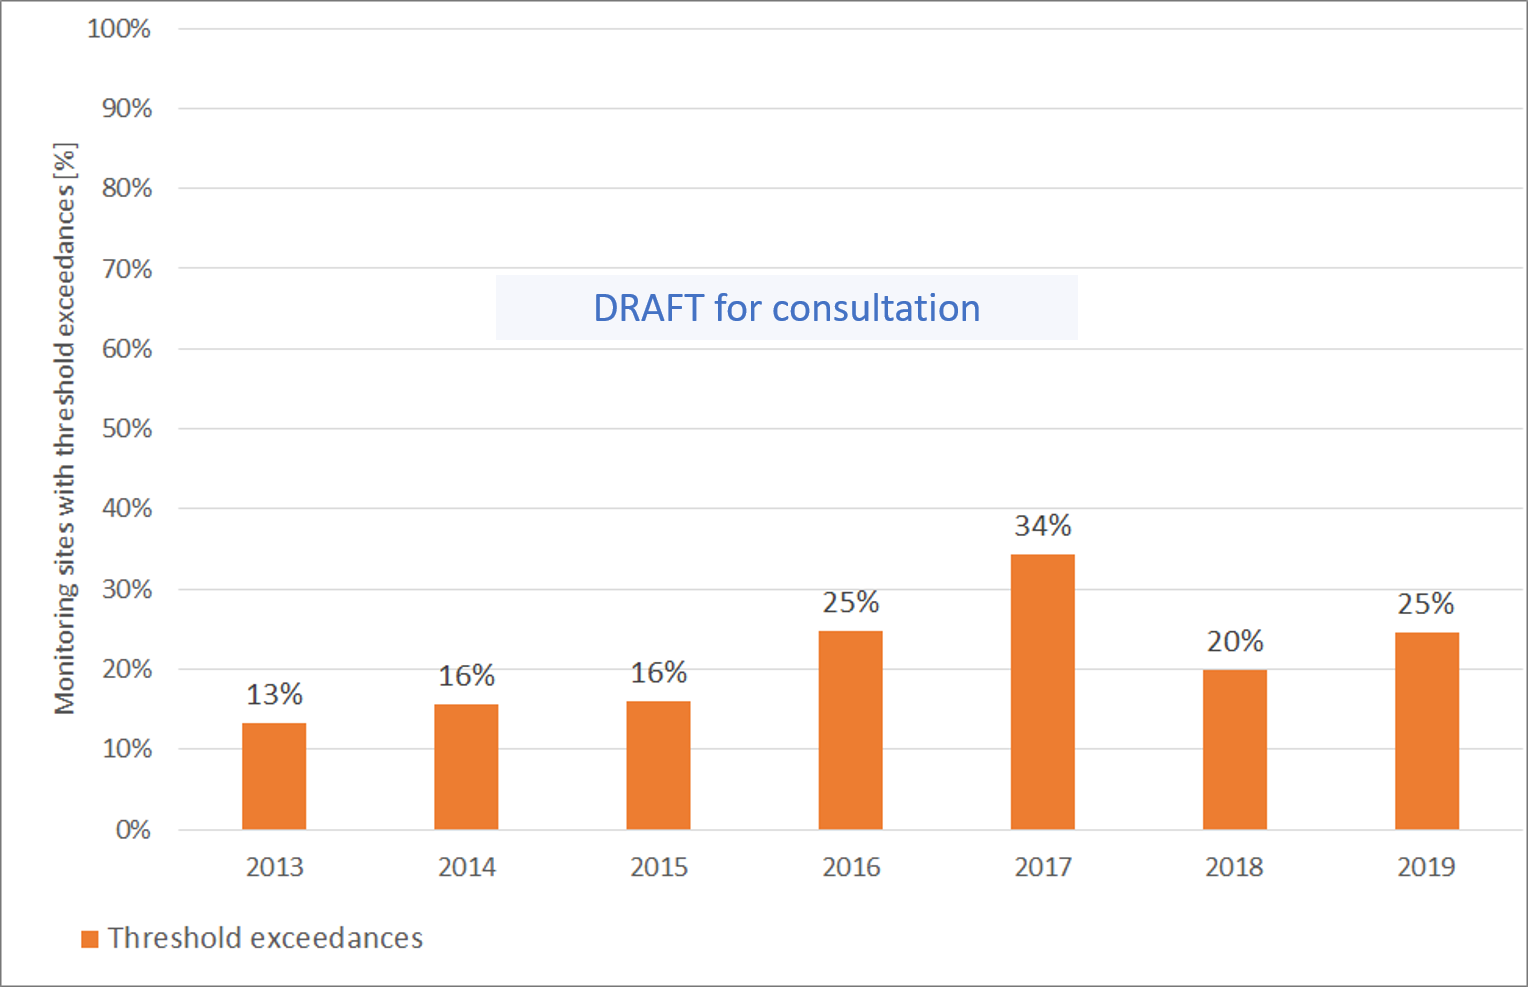
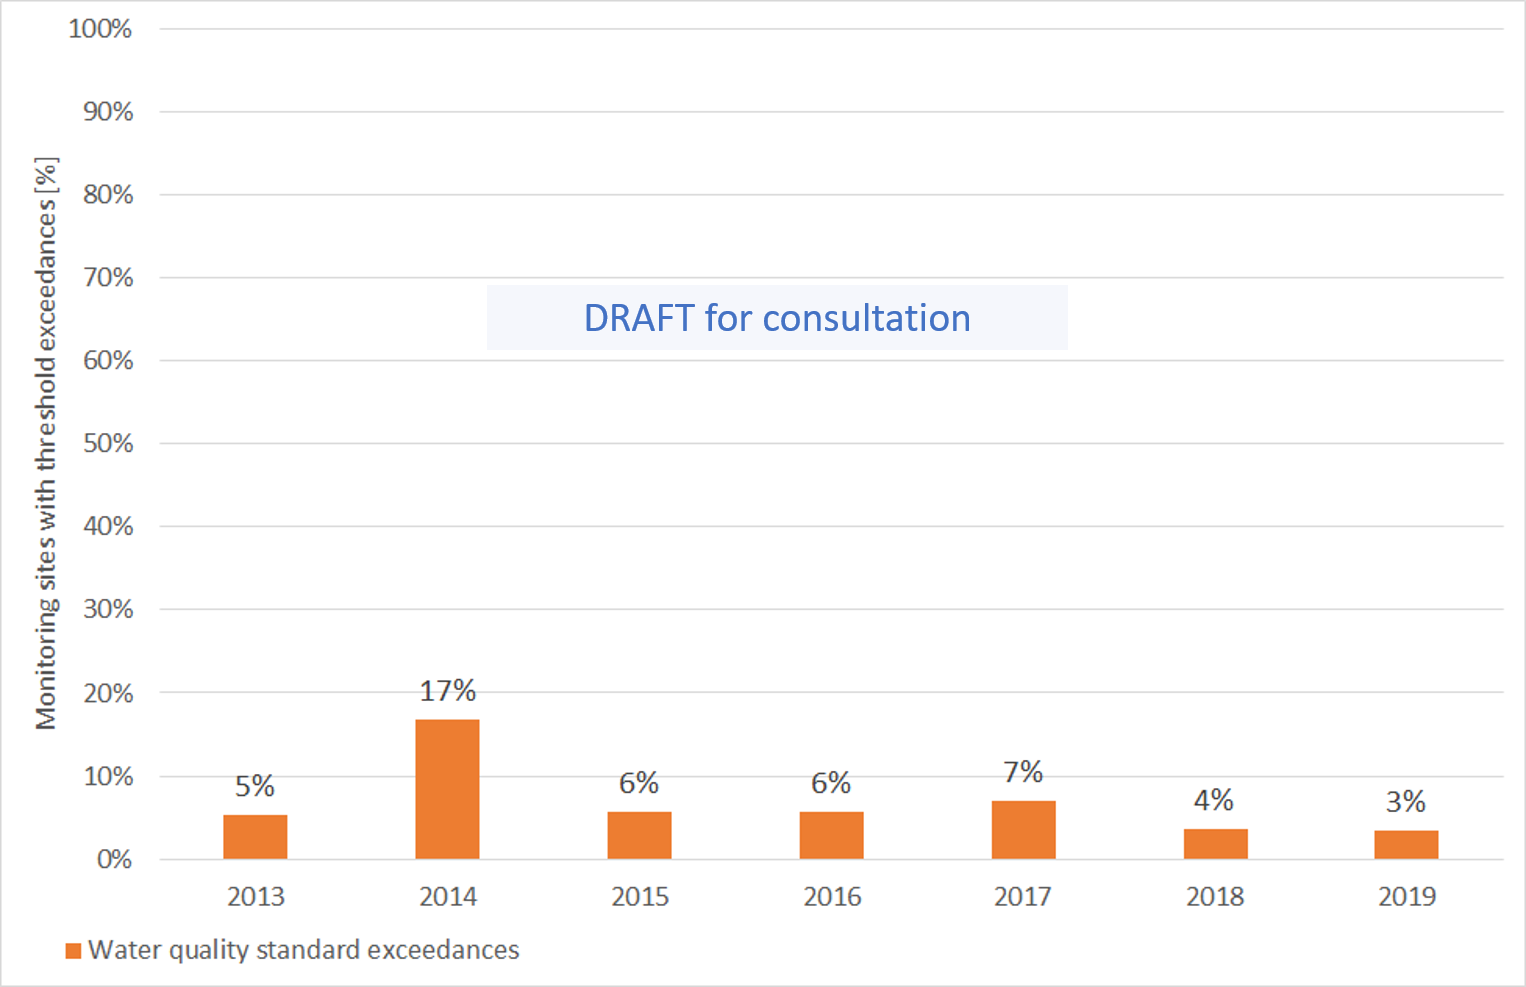
Fig 1 Percentage of monitoring sites with threshold exceedances in surface waters and groundwater in Europe
a) Surface waters
b) Groundwater
Note:
The figures show the percentage of monitoring sites with exceedance of effect thresholds or quality standard, set by European or national regulatory standards, with a country weighting factor to reduce the impact of uneven data reporting:
∑ Percentage of monitoring sites with exceedances per country [%] x country area [km²]
∑ Area of countries with reported monitoring sites per year [km²]
For surface waters, European environmental quality standards and (in absence of those) national regulatory standards were used, reflecting the lowest ecotoxicologically-based effect threshold. Effect thresholds were identified for 114 out of 217 pesticides (53%). Exceedances included here refer to these 114 pesticides.
For groundwater, the Groundwater Directive quality standard of 0.1µg/l was used to identify exceedance. 12 non-relevant metabolites (nrM) were excluded from the assessment. Further information on methods of indicator development can be found in the supporting information for the indicator.
-
- The use of the “lowest ecotoxicologically-based effect threshold” for an EU-wide assessment will lead to a worst-case picture, which does not reflect the national situation with regard to exceedance of national EQS values. This may be confusing for country stakeholders and citizens that know the national reporting on EQS exceedances in their countries. In addition, high exceedance levels at EU level may then not be used to trigger actions at MS level, as there the level of EQS exceedances calculated with the national EQS may be acceptable.
Alternatively, the EQS exceedances can be calculated for each country with the respective national EQS value. - Please specify why 12 nrM were not included in the assessment: e.g. “12 non-relevant metabolites (nrM) were excluded from the assessment, as no specific (ecotox-based) EQS were yet established for surface or groundwater at EU level or in MSs, and the 0.1 µg/L limit value for pesticides and their relevant metabolites does not apply to nrMs”.
- Please specify what was done with the data for the 103 compounds without effect threshold: Were these data then excluded from this analysis?
- The use of the “lowest ecotoxicologically-based effect threshold” for an EU-wide assessment will lead to a worst-case picture, which does not reflect the national situation with regard to exceedance of national EQS values. This may be confusing for country stakeholders and citizens that know the national reporting on EQS exceedances in their countries. In addition, high exceedance levels at EU level may then not be used to trigger actions at MS level, as there the level of EQS exceedances calculated with the national EQS may be acceptable.
-
Further information is needed regarding the exclusion of non-relevant Metabolites from the assesment. These metabolites are a part of the CIS Voluntary Groundwater Watch List Process and they are not yet required by the Groundwater Directive.
-
For groundwater, the treshhold value of 0.1 µg/L was used to set an indicator value. Note however that in the BPR (Annex IV, Article 68) it is written that:
“The evaluating body shall conclude that the biocidal product does not comply with criterion (iv) under point (b) of Article 19(1) where, under the proposed conditions of use, the foreseeable concentration of the active substance or any other substance of concern, or of relevant metabolites or breakdown or reaction products in groundwater, exceeds the lower of the following concentrations:
— the maximum permissible concentration laid down by Directive 98/83/EC, or
— the maximum concentration as laid down following the procedure for approving the active substance under this Regulation, on the basis of appropriate data, in particular toxicological data,
unless it is scientifically demonstrated that under relevant field conditions the lower concentration is not exceeded.”
This means in practice that if e.g. toxicological threshold values for some substances are lower than the trigger value of 0.1 µg/L, then the lower threshold value is used in the assessment.
Note that the same principle applies also for plant protection products! The text in the BPR was in fact copied from the regulation on plant protection products. This means that for the indicator setting you may overlook some critical substances when looking only at the trigger value of 0.1 µg/L…
-
1) Fig1 „Percentage of monitoring sites with threshold exceedances in surface waters and groundwater in Europe“
The presented exceedances are only from reported monitoring sites, not from all monitored sites and this should be added also in the title, together with infrmation about using weighting factor, e.g.: Fig1 Percentage of reported monitoring sites with threshold exceedances in surface waters and groundwater in Europe based on a country weighting factor
2) It would be appropriate to add the table to the Fig 1 for surface water and groundwater - for each year to present substances that exceeded the limits. These substances that exceeded the limits should be further assessed for their risk.
3) Figure1 Groundwater: The descriptions on the Y axis should correspond to the formula in line 82. Now there are only pure percentages but there should be percentages affected by the country weight index according to the formula in line 82. Proposal to modify the title for Figure 1: Surface waters and groundwater in Europe based on a country weighting factor.
4) Page 4, Line 85: European environmental quality standards: We propose to add reference to EU directives
5) Page 4, Line 89-90: What criteria were defined for the non-relevancy of metabolites excluded from the assessment?
6) Page 5, line 94, 95, Figure 2.:
a / Are the percentages for surface waters calculated in this table in the same way as the percentages in Figure 1? I. e. Is the percentage multiplied by the weighting factor of the land area? If so, this table should indicate what the actual units are and whether the data in Figure 1 and Figure 2 are comparable.
b / The evaluation given in Figure 2 is based on data from SELECTED REPORTED sites. There are few countries that report all monitoring sites within WISE. Therefore, we think that if the weighting factor is used in the table and the area of the landscape is taken into account, the situation is distorted here.
c / Is the data for groundwater for SK correct? We soppose it shoud be 10% according to the data in the file PiRLG_4_reported_data_and_exceedance_rates_by_country_and_year.xlsx. (?)
d) There in this table are presented „only“ reported monitoring sites, not all monitored sites. Therefore the results could be indicative.
7) Could be made available a list of all assessed substances (with active substance/metabolite resolution)?
-
The weightning by country area assumes that results from monitoring sites could be exrapolated into the whole country. This is not the case e.g. in Finland where monitoring is focused in the potential risky areas - while areas with no presseures are not monitored (some sites included into screenings to demonstrate no detections).
=> perhaps river basin specific weighting instead of country specific?
Moreover, it seems that no weighting is given to data quality (number of analyzed substances, LOQs, sampling frequencies). It should be added - but i have no ideas how ot do it.
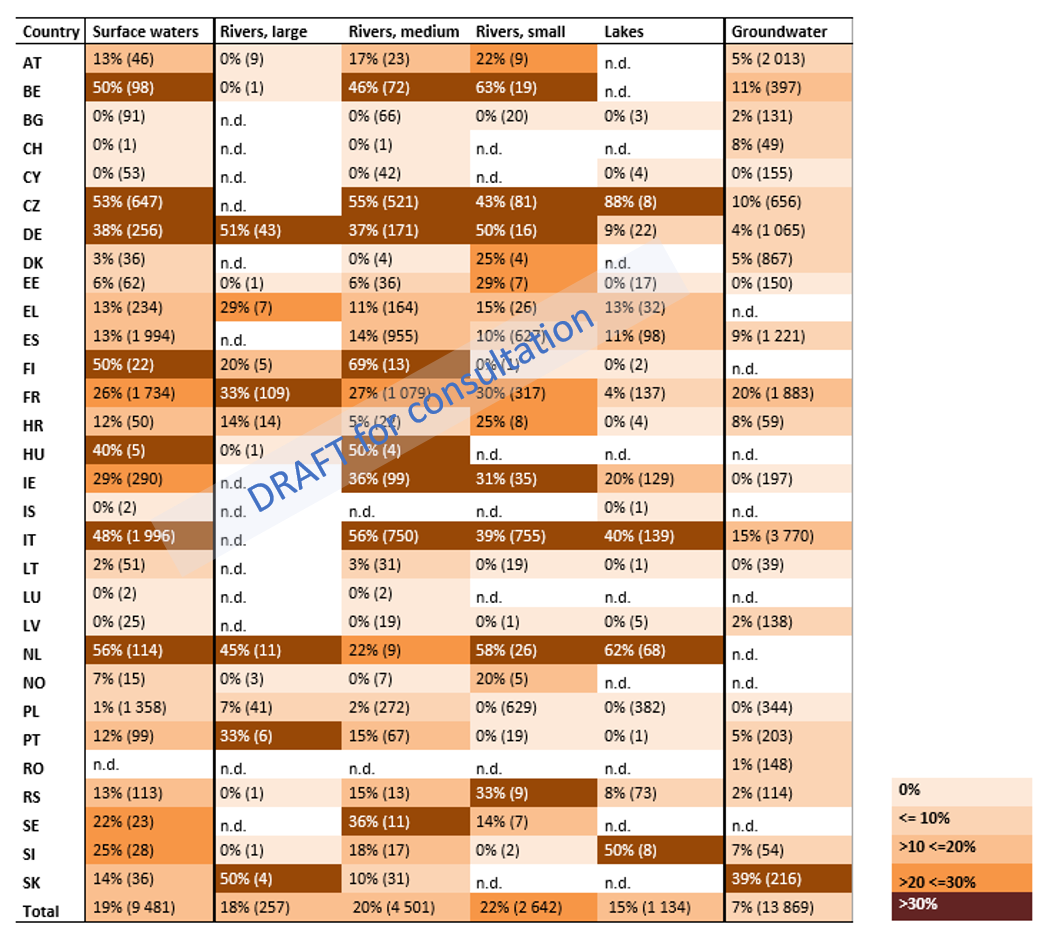
Fig. 2 Percentage of monitoring sites with threshold exceedances of pesticides in surface waters, different sized rivers, lakes and groundwater in European countries, 2013 – 2019.
Note:
n.d. = No data; In brackets: Total number of reported monitoring sites.
The percentage of exceedance rates was calculated based on the number of reported monitoring sites with exceedances, divided by the total number of reported monitoring sites. River size could not be assigned to all monitoring sites (so total surface waters does not equal the sum of lakes plus large, medium and small rivers). This issue mainly affects Italy and Spain.
-
Clarity is needed in this table, and throughout, if the results refer to a 6 year period or 6 x 1 year periods. E.g. 13% of surface waters in Austria above the threshold - this could be 2.1% of rivers each year, (but always different rivers for each of the 6 years), or 13% of rivers (but the same rivers) each year
-
- See comment on previous section:
The use of the “lowest ecotoxicologically-based effect threshold” for an EU-wide assessment will lead to a worst-case picture, which does not reflect the national situation in MSs with regard to exceedance of national EQS values. This may be confusing for country stakeholders and citizens that know the national reporting on EQS exceedances in their countries. In addition, high exceedance levels at EU level may then not be used to trigger actions at MS level, as there the level of EQS exceedances calculated with the national EQS may be acceptable.
Alternatively, the EQS exceedances can be calculated for each country with the respective national EQS value. - Please specify the criteria for classification of “large”, “medium”, and “small” rivers.
- See comment on previous section:
-
The use of the “lowest ecotoxicologically-based effect threshold” seems logic for an EU-wide assessment since the overview should in fact be based on harmonised background values, if the values are chosen country-specific, the picture is not very meaningful.
-
We strongly support the comment given by Volker Laabs. Our main concern is the fact, that indicator like this is not in line with national classification systems where national EQS are being used.
Comment on Slovenian data:
We report 11 lakes through WISE. On three (3) lakes we do not measure pesticides, since there is no pressure identified. So the result for Slovenian lakes should state 36% (11). Data should be corrected accordingly.
Pesticides differ from many other pollutants as they are designed to harm organisms (e.g. plants, insects, fungi) and thus inevitably have an effect on the environment. When concentrations of pesticides are above critical thresholds, individually or as mixtures, they can be harmful to the environment and /or humans by contaminating soil, surface waters and groundwater. Pesticide contamination of both surface waters and groundwater can affect aquatic fauna and flora, but also human health if, for instance, water or fish contaminated by pesticides is consumed.
According to Water Framework Directive (WFD) (EC, 2000) pesticide pollution above critical thresholds leads to both failure of ‘good chemical status’ in surface waters based on pesticide substances listed as priority substances, and failure of ‘good ecological status’ based on pesticide substances listed as river basin specific pollutants. This directly affects the failure of the environmental objectives of the WFD as well as the goal of the new Biodiversity Strategy to implement and enforce the WFD objectives to be met by 2027.
Within the WFD, pesticides are also listed as groundwater pollutants to assess the chemical status of groundwaters. For each specific pesticide substance, a quality standard of 0.1µg/l was set in the Groundwater Directive (EU, 2006).
Within actions of the Green Deal, the EU set targets for the reduction of the use and risk of pesticides by 50% and a 50% reduction in more hazardous pesticides until 2030 in the Zero Pollution Action Plan (EC, 2021), the Farm to Fork Strategy (EC, 2020a) as well as the Biodiversity Strategy (EC, 2020b) with a focus to improve and protect ecosystems and biodiversity. The indicator is based on ecotoxicological effect thresholds defined for aquatic systems and thus addresses the targets of all the directives and strategies mentioned above.
-
No data is presented on pesticide mixtures, so suggest to delete.
No data presented on pestiicdes in soil, so suggest to delete
Green Deal - the target is a 50% reduction in the use and risk of chemical pesticides
-
- First paragraph: We suggest to re-phrase the first sentence to: “Pesticides differ from many other pollutants as they are used to kill/control harmful organisms (i.e. defined pests like weeds, insects, fungi) in agricultural fields to protect the crops. Consequently, pesticides have an inherent potential to cause effects on organisms in the environment.”
- Third paragraph: We suggest to add information about the nature of the 0.1 µg/L limit value for pesticides in groundwater and rephrase the 2nd sentence:
“For each pesticide substance, a quality standard of 0.1 µg/L was set in the Groundwater Directive (EU, 2006), which is not a health-based limit value, but a general precautionary limit value.” - Last paragraph: The groundwater quality standard is not based on ecotoxicological effect thresholds (see comment above). Therefore, we suggest to rephrase the last sentence to:
“The indicator for surface water is based on ecotoxicological effect thresholds defined for aquatic systems (EQS values) and thus addresses the targets of all the directives and strategies mentioned above. The groundwater quality standard for pesticides of 0.1 µg/L is a precautionary one, reflecting the political desire to keep pesticides concentrations in groundwater at extremely low levels.”
-
If the idea is that the term "pesticides" covers in this report also biocides, I would describe the use area as well as the potential exposure area much wider.
Biocides, using partly the same active substances as plant protection products, are used in a wide range of areas, from stables (insecticides) to households, over industrial uses (e.g. preservatives in different industries) with potential direct releases to soil and surface waters, including marine compartments: e.g. wood-/paint- or masonry preservatives applied outdoors, releasing to soil during applicaiton and service life (for up to 20 years) and anti-foulings applied on ships/boats releasing to freshwater or saltwater compartments during their service life.
The indicators are in line with the one-out-all-out-principle of the WFD: If one substance exceeds effect threshold value (in surface water) or quality standard (in groundwater) the monitoring site is classified as ‘Threshold exceedance’ or ‘Quality standard exceedance’.
Between 2013 to 2019, pesticide concentrations were reported from a total of 9 481 monitoring sites for surface waters and 13 869 for groundwater. The number of reported monitoring sites in surface waters varies between countries from less than 10 sites (CH, HU, IS, LU) to more than 1 000 sites (ES, FR, IT, PL). This variation also occurs in groundwaters, with numbers ranging from 39 sites (LT) to more than 3 000 sites in IT (and more than 1 000 sites in AT, DE, ES, and FR).
The number of reported pesticide substances in surface waters ranges from less than 10 substances (CH, DK, HU, IS, LU, NO) to more than 100 substances (CZ, DE, FR, IT). For groundwater, the lowest reported number of substances was reported from AT (6) and highest number from FR (226).
Pesticides most often causing exceedance in surface waters are the insecticides imidacloprid and malathion, and the herbicides MCPA, metolachlor and metazachlor. These substances were approved for use in plant protection products during the monitoring period. In groundwater the herbicide atrazine and its metabolites cause the most exceedances. Atrazine was not approved for use in plant protection products during the monitoring period.
-
SANTE request the data be presnted and analysed for the EU-27 to make it more relevant to Green Deal, F2F, Biodiversity Strategy
-
- Last paragraph: We suggest to include in the 2nd sentence newest information on substance approval status:
“These substances were approved for use in plant protection products during the monitoring period, while imidacloprid approval has expired in 2020." - Furthermore, we propose to make a separate assessment of the exceedance rates for pesticides in water bodies for
a) all measured substances (as done currently in the report)
and in addition
b) measured substances with current approval of crop protection product (active ingredient) of origin.
This would provide on the one hand a complete picture of water contamination with pesticides (assessment a), and on the other hand the part of the contamination, for which actions may still be possible and potentially needed (assessment b).
- Last paragraph: We suggest to include in the 2nd sentence newest information on substance approval status:
-
The number of reported monitoring sites in surface waters varies between countries from less than 10 sites (CH, HU, IS, LU) to more than 132 1 000 sites (ES, FR, IT, PL).“ Here, in this sentence, is exactly what we wrote about above, what is the huge difference in the number of reported places. In that case, even a weighting factor will not help ...
It is not yet possible to determine a trend in Figure 1. Losses from the application of pesticides may vary considerably between years depending upon e.g. crop type and the weather (EC, 2008), and the frequency of monitoring of pesticides in surface waters can be limited to one year out of three. For these reasons, changes between years may not be significant. It is anticipated that a trend will become apparent in the next few years.
Fig. 1 shows the percentage of monitoring sites with threshold exceedances in surface waters and groundwater. In surface waters, the peak in 2017 is driven by an exceedance rate in Spain ten times more than compared to other years. In groundwater, the peak in 2014 is driven by an exceedance rate in Italy ten times more than other years, and in Slovakia three times more.
-
The appearance of a meaningful trend will very much depend the stability of the monitoring programme. In the period considered in this study, there is a rather clear temporal trend (increase) in the number of monitored substances, monitoring sites, and overall records. While this trend is welcome to get a better picture of the overall situation, it hampers a meaningful year-by-year comparison, especially when using the one-out-all-out principle.
-
-
Further explaination needed, as this will raise questions - text needs to explain in simple English how the exceedance rate in Spain jumped 10 times in 2017. in the absence of a clear explaination, this will reduce confidence in the indicator.
-
- 2nd paragraph: What is the explanation for the peaking exceedance rates in single years in Spain, Italy, and Slovakia?
In case of insecure data (e.g., due to analytical or sampling method issues) or suspected reporting issues (i.e., no reasonable explanation could be given for the excessive exceedance rates in these years), we suggest to exclude these anormal years as outliers from the exceedance rate calculations.
- 2nd paragraph: What is the explanation for the peaking exceedance rates in single years in Spain, Italy, and Slovakia?
-
Additional information regarding the exceedance rate in Italy reported in the years excluding 2014 is needed to explain the stated highest percentage of pesticide exceeding the common threshold value of 0.1 ug/l. Furthermore, it is significant to specify if the numbers and/or locations of groundwater monitoring sites with exceedance of the quality standard or the types of pesticides analyzed in 2014 were considerably different than the rest of monitoring period.
-
We suspect wrong Spanish data are being used to calculate the indicator. The right file was uploaded from Spain (and apparently accepted) in the web WISE SoE Data Deliveries (WISE-SoE_WaterQuality_2017_SW_v4.xls) in July, 2019. There was a Final Feedback which informed us that the delivery had been accepted. This is the source we analysed last July when we answered the mail about the high values reported from Spain in relation to the headline indicator. Our data are not consistent with the information contained in the file “PiRLG_4_Reported data and exceedance rates by country and year”, for the years 2016 and 2017. According to the information of this file, nº of reported monitoring sites for Spain is 2 for 2016 and 3 for 2017, which is clearly a mistake, especially if you compare the data with the whole historic series.
Fig. 2 shows the percentage of monitoring sites with threshold exceedances of pesticides in surface waters, different sized rivers, lakes and groundwater in European countries. This was used to examine threshold exceedances according to Surface Waters; Rivers, small; Rivers, medium; Rivers, large; Lakes, and Groundwater. Exceedance rates higher than 30% occurred in 15 out of 30 countries in surface waters, and in one out 24 countries in groundwater. High exceedance rates were mainly related to monitoring sites in small and medium-sized rivers.
-
Suggest to explain what are small rivers, medium rivers etc., e.g. length, water volume etc.
-
Exceedance rates for pesticide in surface water shall be based on the “lowest ecotoxicologically-based effect threshold”. However, looking at Annex 4 (list of used EQS values) it becomes apparent that for several pesticides (or metabolites) a precautionary value of 0.1 µg/L was used as lowest AA-EQS value (presumably based on the drinking water quality standard), instead of a truly ecotox-effect based threshold. This is the case for the following substances:
2,4,5-T
2,4-D
Ametryne
Bentazone
Chorfenvinphos
Chloridazon
Demeton-O
Demeton-S-methylsulfon
Desethyl-terbuthylazine
Dichlorprop
(2,4-DP)MCPB
Mecoprop
Mecoprop-P (MCPP-P)
Methamidophos
Metolachlor
Oxydemeton-methyl
Phosalone
In a few countries (e.g., Italy, Germany, Luxembourg), surface water AA-EQS values were derived for some substances based on precautionary or drinking water quality standards (see national ordinances). For instance, in Italy an ordinance (Legislative Decree 172, 2015) defines that where an ecotox-based EQS value has not been set for an individual pesticide (listed in the respective table), a value of 0.1 µg/L should be used for both parent and metabolites.
As this is not in accordance with the WFD CIS guidance for establishing surface water EQS values (which should be ecotox based), we strongly propose to not use the (precautionary) value of 0.1 µg/L in the EQS exceedance calculation method for surface water, but to use the next lowest truly ecotox-based EQS value available in MSs for these substances. -
Additional information as a list of pesticides exceeding the thresholds in each country can be given on the same figure or with a separate table elsewhere.
-
Would be interesting to know if the focus in the screening was only on pesticides active substances or if also specific biocides were included (e.g. isothiazolinone or in general actives with a high DT50 and the potential to accumulate)
-
Comment from German Federal State Schleswig-Holstein (repeated from 1. Key Messages):
The indicator concept was tested with a dataset derived from the WFD monitoring of the German Federal State Schleswig-Holstein. The results were:
- Surface waters: EQS exceedances were found especially in small rivers with the herbicides Flufenacet and Diflufenican, followed by the herbicide Nicosulfuron and the insecticide / biocide Imidacloprid on top of a list of 10 pesticides. Flufenacet was found in bigger rivers too, but, due to dilution, no EQS exceedances have been detected.
Pre-face for all comments made by me: I make these comments on behalf of CropLife Europe.
We propose to make a separate assessment of the exceedance rates for pesticides in water bodies for
a) all measured substances (as done currently in the report)
and in addition
b) only measured substances with current approval of crop protection product(s) (active ingredient) of origin.
This would provide on the one hand a complete picture of water contamination with pesticides (assessment a), and on the other hand illustrate the part of the contamination, for which actions may still be possible and potentially needed (assessment b).