
Post a comment on the text below
3.3. Emission sources and pathways
Having identified the substances causing poor water quality, the WFD requires investigation of the pressures causing that. In the reporting of 2nd RBMPs there is not a direct link between a substance failing in a water body and the pressure(s) causing that. Instead, we looked at reporting under the EPRTR, the WFD inventory of emissions, discharges and losses of priority substances and WISE-State of Environment reporting https://www.eea.europa.eu/data-and-maps/data/waterbase-emissions-5 . The aim was to identify trends in chemical discharges, given the difficulty of disentangling historic pollution from current, so as to see whether emissions are increasing or decreasing.
There are different approaches to recording emissions. One looks at the emissions from a known source – e.g. a manufacturing or waste water treatment plant. This “source-oriented” approach addresses the whole system, starting from the principal sources of substance release. The E-PRTR is an example of this, where emissions of particular chemicals above a certain amount per year must be reported by the operator. Pathways are the routes by which substances can be transported to the aquatic environment, with the “pathway-oriented” approach modelling where pollutants may be temporarily stored (e.g. in soils) before eventually reaching surface waters through other processes e.g. erosion or storm water overflows. The “riverine load oriented approach” estimates the observed total load in the river and can include an estimate of the diffuse inputs. Riverine loads describe the mass of the pollutant transported in the river. Both the WFD inventory and WISE SoE emissions reporting allow reporting under each of these three approaches. While accommodating different approaches, these diverse methods can make it difficult to compare results.
Both point source – from a known discharge – and diffuse source – from multiple sources in an area - should be covered by emissions reporting. In practice, reporting from point sources is generally more straightforward, dominating emissions reports.
A general scheme setting out principal sources, pathways and intermediates has been developed under the WFD for the Inventory of emissions, discharges and losses of priority substances, shown in Figure 3.1 (EC, 2012) .
Figure 3.1 Relationship between the different surface water compartments and pathways (P1-P13) (EC, 2012)
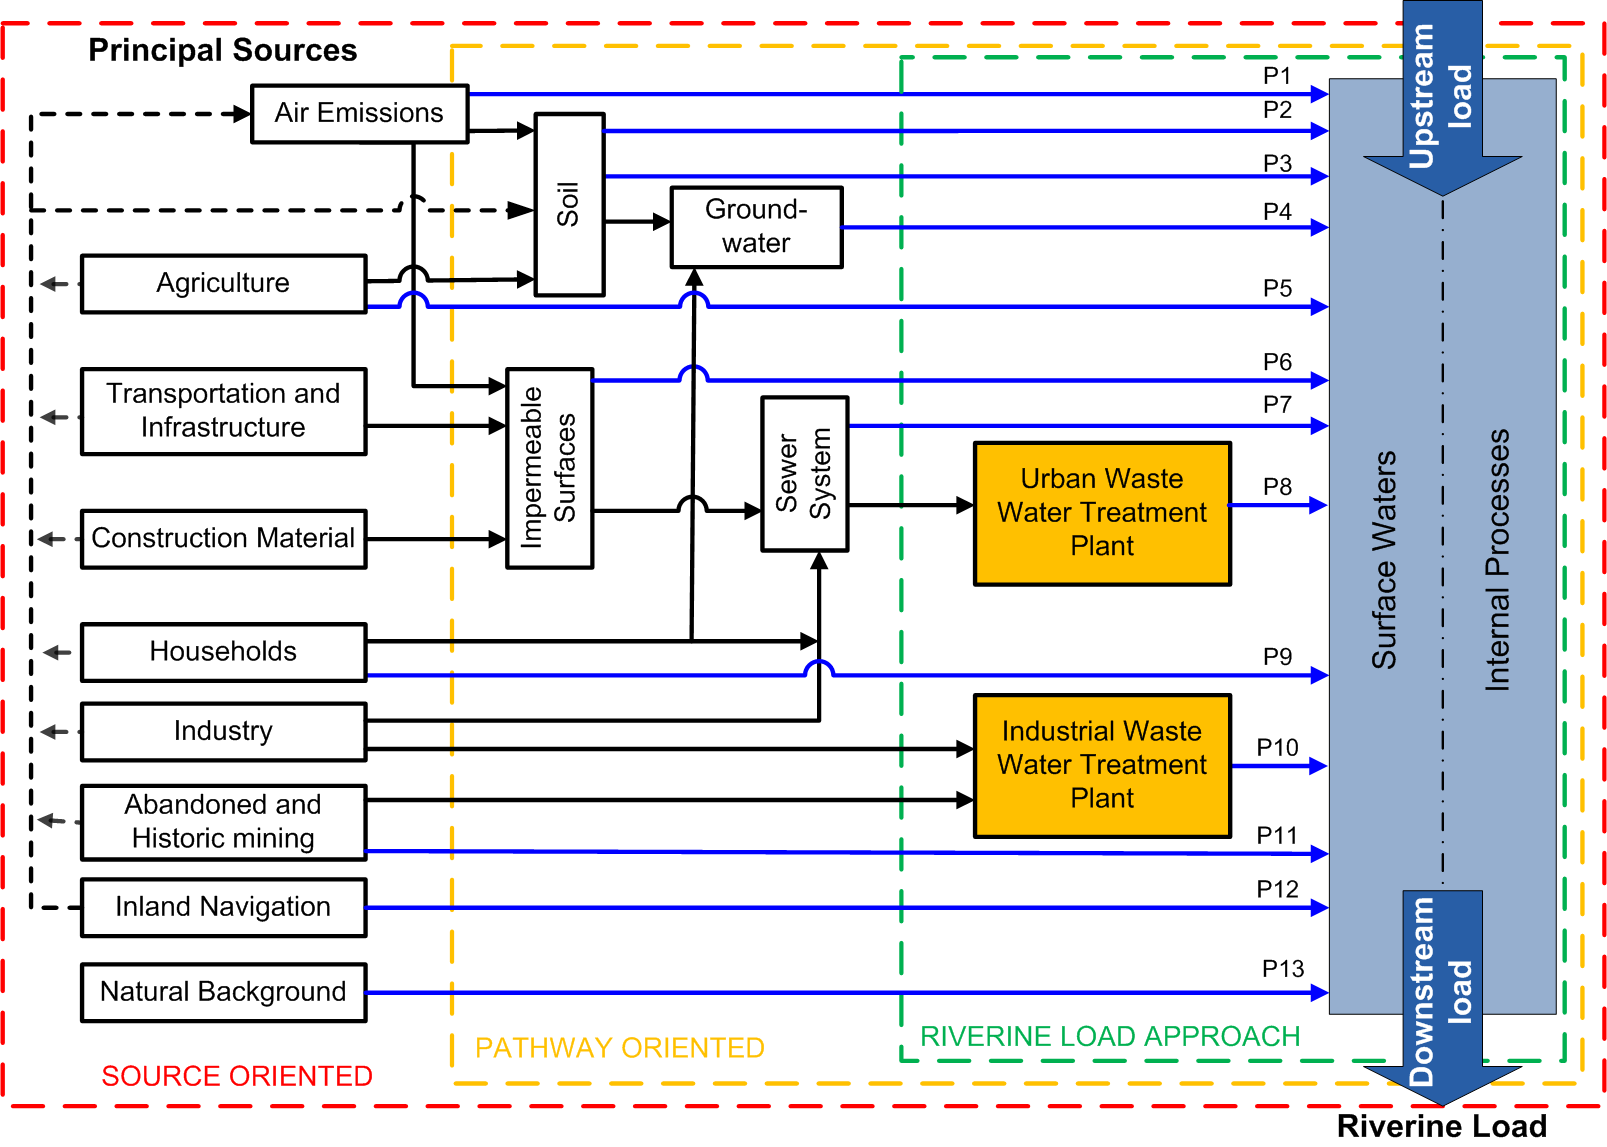
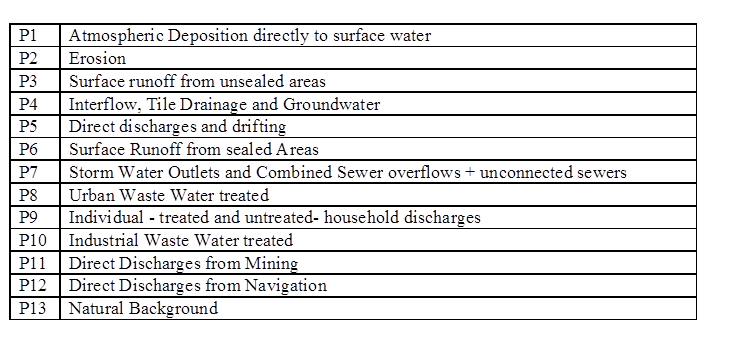
Figure 3.1 provides a way to compare emissions reported under the different approaches. On the left, the principal sources of the pollutants are shown, representing groups of sources. Emissions, discharges or loads can follow different pathways, either directly to surface water, or to other compartments of the environment (air, soil, groundwater), represented by the middle section of the Figure. Emissions can be the result of losses during the production or as a result of the use of products. A part of the wastewater from industry and households is collected in a sewer system and treated in industrial waste water plants (P10) or urban waste water treatment plants (P8) (UWWTPs), on the right hand side of the Figure.
In this chapter, main pathways are considered but substances have more ways of entering the aquatic environment.
Emissions datasets provided in Figures 3.2 to 3.14 (tables A1 to A9 in Annex A).
E-PRTR are data from large sources, either industry or urban waste water treatment plants serving over 100,000 people (or equivalent). Data have been reported under this EU obligation since 2007.
WFD is reporting of the emissions inventory for each river basin district, required for priority substances for the first time in the 2nd RBMPs, for the year 2010.
WISE reporting is voluntary reporting of emissions by EEA’s member countries.
“Estimated diffuse 2010” are those from a project calculating diffuse loads to surface water (Roovaart et al (2013a, 2013b).
The WFD inventory should contain information on priority substances. Emissions data below therefore focus on emissions reporting of priority substances, though more information is available on RBSPs (https://www.eea.europa.eu/themes/industry/industrial-pollution/ ; Roovaart et al, 2017).
What should the emissions data tell us?
In the tables, the lowest emissions estimate would be expected to be the E-PRTR, as these reports include emissions from large installations only. We would expect WISE SoE data to be the same or higher as E-PRTR. WFD data, which should include all the losses, emissions and discharges ought to be higher than E-PRTR. However, this is often not the case and it is unclear which are the most accurate values.
The WFD inventory reporting was expected to provide data on emissions of priority substances into each river basin. Study of the emissions therefore focused on the priority substances identified as key pollutants in Table 3.1. However, owing to the limited reporting, and poorly comparable data, rather little information can be gleaned from the WFD emissions inventory.
Specific details on the emissions datasets can be found in Annex A.
You cannot post comments to this consultation because you are not authenticated. Please log in.
Previous comments
DE-SH:
'WFD emissions inventory'
which paragraph in the WFD cals for a WFD emission inventory? Please specify.
UBA- II 2.2:
Typo it should be E-PRTR (with hyphenation)
UBA II 2.2:
a) Please add a reference to the figure 3.1: 'There are different approaches to recording emissions (Figure 3.1).'
b) Releases to water reported in E-PRTR should be taken into account in each of the three appoaches. Therefore, in my opinion E-PRTR is not an example for source oriented approach only (see also EC, 2012).
Is there source oriented use information on emissions to air from E-PRTR?
c) 'erosion or storm water overflows' : direct point sources are also included (UWWTPs and industrial releases to water)
From our point of view, the three approaches are not well described - poorly explaining the main differences. Furthermore, there are not only methodical differences but differences in meaningfullness of results.
d) 'estimate of the diffuse inputs': To our knowledge direct point sources are also included if information are available
DE UBA II 2.2:
'E-PRTR are data from large sources': To our knowledge large facilities (the capicity threshold in Annex I of E-PRTR Regulation) need to report only if pollutant threshold value is exceeded (see Annex II of PRTR Regulation)
DE-UBA II 2.2:
a) Did all Member States report under WISE SoE? Maybe this could also be a reason that data don´t fit (see Figures 3.1 .....
b) Important! : The German inventory was prepared respective the recommendations of EU Technical Guidance No 28 (EC, 2012). That means, we only reported emissions on riverbasin level for substances which had been identified as relevant for the riverbasin. That means - if a substance is not relevant for all German riverbasins E-PRTR reporting and WFD reporting might not be compareble.
EurEau
Again WWTP are not a source of pollution. It is a point in the system where the measurement can be done. The sources are the households or others connected to the sewer network.
EurEau
On figure 3.1:
It is difficult to understand why UWWTP and IWWTP are included in the Reverine load approach. They should be included in the pathway. There are transformations happening in the plants but as in other media and the load P8 or P10 need to be considered only.
EC 2012 is not listed in the reference and cannot allow to better understand the reasoning behind the figure.
Eurometaux
Figure 3.1 Relationship between the different surface water compartments and pathways (P1-P13) (EC, 2012)
Thank you for providing a nuanced overview of the complex pattern of various sources of chemicals, and importantly for including “natural background” as a possible source. Given this complex pattern is especially valid for metals, this reinforces the need for amending the Section 3.6 header (see below).
Direct Discharges from Mining Please replace “mining” with abandoned historic mining
1st paragraph: Although there are available 3 different data sources (E-PRTR, WFD, WISE-SoE), each of them was introduced with different aims, there are guideline how to report data (with different selection criteria..., there is also used a criterion not to report data twice) – therefore the correct data interpretation requires good knowledge about „background“ of data available in different „dataflows“.