
Post a comment on the text below
2.2 Ecological status in the second river basin management plans
Ecological status and potential
Overall, around 40 % of the surface water bodies are in good or better ecological status, while 60 % did not achieve good status (Figure 2.2). Lakes and coastal waters are in better status than rivers and transitional waters. The ecological status of natural water bodies is generally better than the ecological potential of heavily modified and artificial water bodies.
Figure 2.2. Ecological status/potential of rivers, lakes, transitional and coastal waters.
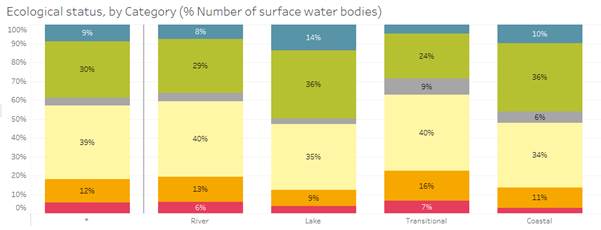
Notes: The term (*) means all surface water bodies summarizing rivers, lakes, transitional and coastal waters. Classification by length of rivers and surface area of the other water categories shows similar distribution of status classes as the classification by number of water bodies for each water category (see below links to WISE), except a lower proportion high and good for the area of transitional waters.
Source: Preliminary results based on WISE-SoW database including data from 25 Member States (EU28 except Greece, Ireland and Lithuania).
You cannot post comments to this consultation because you are not authenticated. Please log in.
Previous comments
Figure 2.2:
Please adjust the colours in the diagram (blue, green an so on) as in the other diagrams showing the status/potential in the report (use the same colours)
or (as an alternative) add a description /legend for the colours to the titel.
Please add % numbers also to the narrow grey and red stripes.
The legend is missing.
Ecological status/potential classification by length of rivers and surface area of the other water categories should also be shown here, not only behind links.
It is mentioned in Notes under Figure 2.2: Classification by length of rivers and surface area of the other water categories shows similar distribution of status classes as the classification by number of water bodies for each water category (see below links to WISE), except a lower proportion high and good for the area of transitional waters.
But this is not enough. River length and lake/coastal/transitional areas would provide actual information how widely EU surface waters are in good or less than good condition.
It would be especially interesting to see lengths and areas against pressures in chapter 6.
It would be nice to add a colour code to figure 2.2.
(AT): 1st sentence: 'around 40 % of the surface water bodies are in good or better ecological status...'
Reference to good potential is needed here. Generally I would prefer to include a differt colour (green/grey stripes) for good potential in the graphs. If not, a separate chapter on AWB/HMWB or separate graphs
(AT) Figure 2.2 and Notes:
It is not acceptable to merge status and potential! Separate graphs for natural and HMWB/AWB are needed.
Notes: The term (*) means all surface water bodies summarizing rivers, lakes, transitional and coastal waters
AWB/HMWB are a separate water category and have to be mentioned here.
SK: Page 23, 1st paragraph, and Figure 2.3: At least in this introductory section, it would be beneficial to present figure for the ecological potential separately (by category). We propose to present information and data in a more positive way, we would welcome to present figures also for high and good status (figure 2.3), not only for less than good status.
CZ: Missing legend (e.g. gray – unknown)