
Table of contents
- Guidance to the reader
- General comments
- Executive summary
- 1. EEA State of Water assessment and EU water policy context
- 2. Ecological status and pressures
- 3. Chemical status and pressures in surface waters
- 4. Groundwater chemical status and pressures
- 5. Groundwater quantitative status and pressures
- 6. Overall status, progress achieved and future challenges
2. Ecological status and pressures
2. Ecological status and pressures
Key messages
- On a European scale, around 40 % of the surface water bodies are in good or high ecological status, with lakes and coastal water bodies having better status than rivers and transitional waters bodies. The improvement in overall ecological status since the first RBMPs were reported is limited.
- Marked efforts have been made by Member States to improve water quality and hydromorphology. Some of the measures have immediate effect; others will result in improvement in the longer run. Results are usually visible at the level of individual quality elements but often do not translate into an overall improved ecological status.
- However, for the individual quality elements (biological quality elements, supporting physico-chemical and hydromorphological quality elements) that make up the overall status the situation has improved.
- The main pressures are point and diffuse source pollution, and various hydromorphological pressures. Diffuse pollution affects 37 % and point source pollution 18 % of the surface water bodies, while hydromorphological pressures affect 41 % of water bodies.
- The main impacts on surface water bodies are nutrient enrichment, chemical pollution and altered habitats due to morphological changes.
2.1 Introduction
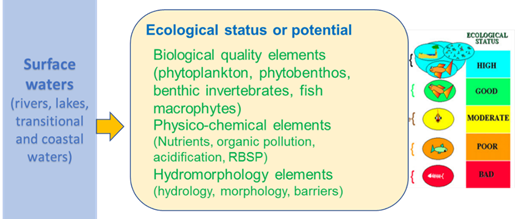
Ecological status[1] is an assessment of the quality of the structure and functioning of surface water ecosystems. It shows the influence of pressures (pollution, habitat degradation, climate change, etc.) over the identified quality elements. Ecological status is determined for each of the surface water bodies of rivers, lakes, transitional and coastal waters based on biological quality elements, supporting physico-chemical and hydromorphological quality elements (Figure 2.1). The overall ecological status classification for a water body is determined, according to the one-out-all-out principle, by the worst status of all the biological quality elements and the supporting quality elements.
Figure 2.X. Assessment of ecological status of surface water bodies
Significant pressures causing less than high or good ecological status
Water bodies in moderate, poor or bad ecological status require action in terms of mitigation and restoration measures to achieve the WFD good status objective. To plan the measures, the pressures causing water bodies to fail good ecological status must be identified.
These include pressures from point sources of pollution, diffuse sources of pollution, hydrological and morphological alterations, and a number of other pressures. Similarly, impacts include nutrient, organic and chemical pollution, altered habitats, and acidification.
Better understanding and knowledge of ecological status
During the first RBMP cycle (2009-2015), Member States have introduced a vast network of monitoring sites and assessed the ecological status of their water bodies. From 2008 to 2017, the number of intercalibrated ecological assessments methods increased from around 100 to nearly 400 methods. Overall, this has reduced the proportion of water bodies with unknown ecological status from 16 % to 3 %, and the confidence in the classification has improved from one third of water bodies with high or medium confidence in the first RBMPs to more than half of the water bodies in the second RBMPs.
In the second RBMPs more than two-thirds of all water bodies are classified based on at least one biological quality element (Figure 2.1). For most of the remaining water bodies, status has been assessed based on supporting physico-chemical and/or hydromorphological quality elements.
Figure 2.1. Percentage of classified water bodies using different quality elements.
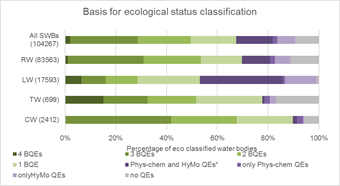
Notes: * at least one physico-chemical quality element and one hydromorphological quality element, but no biological quality elements. Number in parenthesis is number of water bodies.
Source: Preliminary results based on WISE-SoW database including data from 25 Member States (EU28 except Greece, Ireland and Lithuania).
Overall, these improvements mean that the results of the ecological status classification are now a better indication of the general health of the water environment. However, the improved status assessment in the second RBMPs makes the comparison between the status in the first and second RBMPs difficult. Caution is advised when drawing detailed conclusions regarding changes observed between the two RBMPs and when comparing results between Member States.
|
Further and detailed information on improvements in ecological status assessment is available in WISE · Monitoring of ecological status (see chapter 1) · Change in proportion unknowns: unknown ecological status · Confidence in: ecological status assessment Table and Graph*; · Proportion of water bodies assessed by using biological quality elements, and supporting physico-chemical and hydromorphological quality elements (see Figure 2.1 – dashboard to be produced) |
* draft dashboards;
2.2 Ecological status in the second river basin management plans
Ecological status and potential
Overall, around 40 % of the surface water bodies are in good or better ecological status, while 60 % did not achieve good status (Figure 2.2). Lakes and coastal waters are in better status than rivers and transitional waters. The ecological status of natural water bodies is generally better than the ecological potential of heavily modified and artificial water bodies.
Figure 2.2. Ecological status/potential of rivers, lakes, transitional and coastal waters.
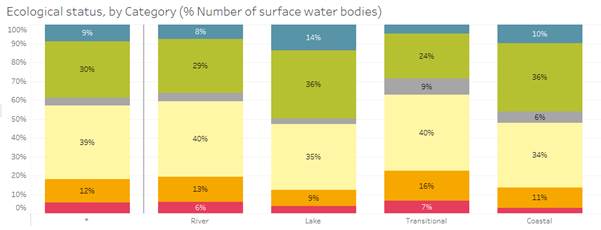
Notes: The term (*) means all surface water bodies summarizing rivers, lakes, transitional and coastal waters. Classification by length of rivers and surface area of the other water categories shows similar distribution of status classes as the classification by number of water bodies for each water category (see below links to WISE), except a lower proportion high and good for the area of transitional waters.
Source: Preliminary results based on WISE-SoW database including data from 25 Member States (EU28 except Greece, Ireland and Lithuania).
The northern countries, particularly the northern Scandinavian region and Scotland show a high proportion of water bodies in high or good ecological status. In contrast, the central European river basin districts as well as some southern RBDs show the highest proportion of water bodies not in good ecological status or potential.
Figure 2.3. Percentage of water bodies not in good ecological status in Europe’s river basin districts in 2016 <Maps from 2012 (first RBMPs)
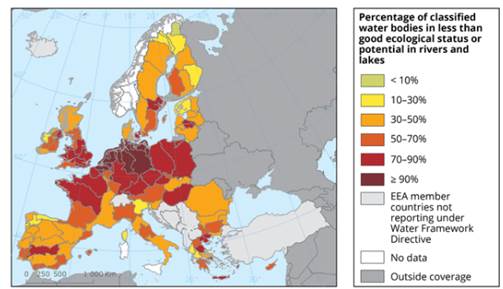
An updated map has not been included – EEA is exploring different option on presenting the information on interactive map services. The map service should present ecological status per RBD for either the first or second RBMP with filters for the four categories (rivers, lakes, transitional and coastal waters) and by count of water bodies and by size (Length for rivers; and area for the other categories) and with pop-up windows with the results for the specific RBD. See results for map Table
In general, highland rivers and lakes have better status than lowland water bodies. Mid-altitude and siliceous water bodies are also in better status compared to lowland and calcareous water bodies. The European downstream part of large rivers has in many cases less than good status, while the status of large European lakes is much better than the average status of lakes.
In coastal and transitional waters, the best ecological status is found from the Celtic Sea to the Iberian Coast and in the Mediterranean, while the worststatus is found in the Baltic and Black Seas.
|
Further and detailed information on ecological status results is available in WISE · Ecological status by category, table – graph – · Ecological status of natural or heavily modified and artificial water bodies (use the filter) · Ecological status by common broad types · Ecological status by Member States – see above table - graph_MS - graph_MS_category · Ecological status by RBDs (Results for Map) - Table · Ecological status in 2015 Table |
* draft dashboards;
2.3 Status of quality elements
Ecological status is determined for rivers, lakes, transitional and coastal water bodie based on biological quality elements and supporting physico-chemical and hydromorphological quality elements.
Textbox: Biological quality elements and supporting quality elements
|
Phytoplankton are free floating microscopic algae, which are very sensitive to the level of nutrients in a given water body. Phytoplankton may cause the water to become green, brown or red, depending on the dominant species. Phytoplankton consist of many different groups of algae, e.g. green algae, diatoms, dinoflagellates, as well as the potentially toxic cyanobacteria that may create blooms in nutrient enriched lakes, and cause problems for use of the water for drinking water supply and recreation. |
|
Aquatic benthic flora comprises phytobenthos and macrophytes in rivers and lakes, and macroalgae and angiosperms in coastal and transitional waters. Aquatic flora is particularly susceptible to elevated nutrient concentrations in the water. Phytobenthos are small algae that grow on rocks and other substrates, including bacterial tufts and coats if the water body is enriched with organic matter from waste water. Aquatic plants (macrophytes and angiosperms) grow mainly on soft substrate in shallow waters in rivers, lakes and transitional and coastal waters, while large algae (macroalgae) grow on rocky substrate along the shores of coastal and transitional waters. |
|
Benthic invertebrates are small animals that inhabit the bottom, as well as nearshore areas of streams, rivers, lakes, coastal and transitional waters. They include e.g. aquatic insects, crustaceans, snails and mussels. Benthic invertebrates are a key source of food for fish. Benthic invertebrates are susceptible to many different pressures, such as organic enrichment causing oxygen deficiencies, alterations of habitats, acidification, fine-sediments, and inputs from agricultural pesticides. |
|
Fish are particularly susceptible to hydromorphological pressures, revealing impacts of river bank constructions, large flow fluctuations, water abstraction, inadequate shelters beneath roots and poorly structured water beds. Such habitat alterations affect the fish abundance, their species composition or age structure. In addition, salmon and many other fish species that migrate from the sea to river headwaters to spawn are dependent on river continuity. Hence, changes in fish composition and abundance often reveal lost river continuity (e.g. due to barriers or dams). Fish are also very sensitive to acidification. |
|
Hydromorphological elements support the biological elements. They generally consist of 1) the hydrological regime (e.g. quantity and dynamics of water flow and connection to groundwater bodies) and 2) the morphological conditions (e.g. depth and width variation, structure and substrate of the bed, and structure of the riparian zone). In rivers, it also includes river continuity (i.e. presence of barriers and dams or other transversal structures). |
|
Physico-chemical quality elements support the biological quality elements. They generally consist of 1) light and thermal conditions, 2) oxygenation conditions, 3) salinity, 4) nutrient conditions, and 5) river basin specific pollutants (RBSPs). For rivers and lakes, they also include acidification status. |
Although a large proportion of water bodies are not classified for each single quality element (grey bars in figure 2.4), more than two-thirds of all water bodies are classified with at least one biological quality element. The most frequently classified biological quality elements for rivers are benthic invertebrates, phytobenthos/other aquatic flora/macrophytes and fish, phytoplankton for lakes and phytoplankton and benthic invertebrates for transitional and coastal waters.
The ecological status for individual quality elements is generally much better than the overall ecological status. For rivers, for example, 50-70 % of the classified water bodies have high or good status for several biological quality elements, while the overall ecological status is only high or good for less than 40 % of the river water bodies. For the physico-chemical and hydromorphological quality elements generally more than two-thirds of the water bodies have at least good ecological status.
Figure 2.4. Ecological status of biological quality and supporting elements in rivers, lakes, transitional and coastal waters.
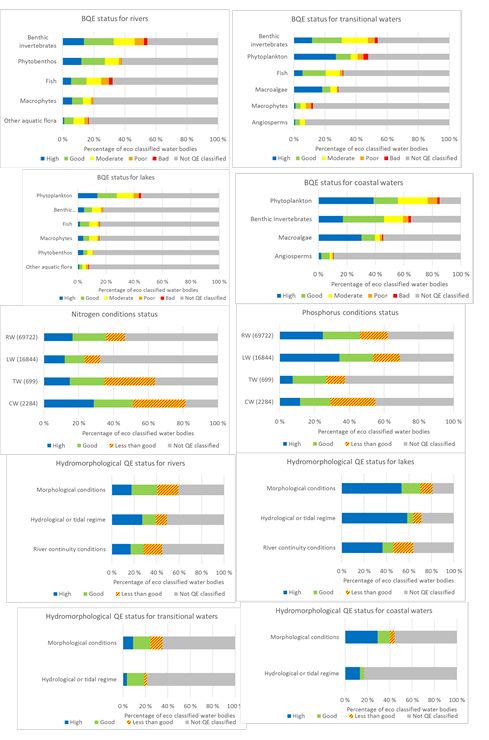
Notes: Ecological status for biological quality and supporting elements in water bodies classified for overall ecological status (100%). The grey part shows water bodies not classified for that particular quality element.
EEA is exploring possibilities to present aquatic flora correctly – some Member States report “Other aquatic flora” while other Member States have reported the aquatic flora sub-indicators.
Source: Preliminary results from WISE-SoW database including data from 22 Member States (excluding Austria, Denmark, Greece, Ireland and Malta). See Link for results including 25 Member States.
The best ecological status for benthic invertebrates in rivers is found in Romania, Finland and the UK, while the worst is found in the Netherlands, Germany and Croatia (Figure 2.5).
Figure 2.5. Ecological status for benthic invertebrates in rivers in different countries.
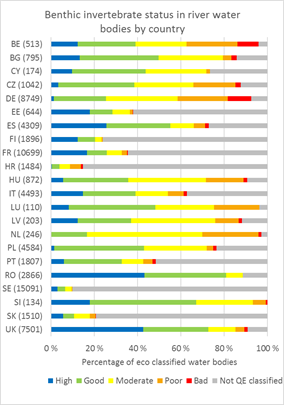

Notes: Classification of ecological status for macroinvertebrates in rivers including the water bodies not classified for this biological quality element (grey bars) (left panel) and excluding these water bodies (right panel). The number in brackets in the left panel is the total number of water bodies classified for overall ecological status (100% on the x-axis). In the right panel, the numbers in brackets indicates the number of water bodies classified for benthic invertebrates in rivers (100% on the x-axis). Here, the percentage in brackets is the number of water bodies classified for benthic invertebrates out of the total number of water bodies classified for overall ecological status. Source: Preliminary results from WISE-SoW database including data from 22 Member States (excluding Austria, Denmark, Greece, Ireland and Malta). See Link for results including 25 Member States.
|
Further and detailed information on quality elements results is available in WISE · Quality elements Table - ; QE group Table; QE:EU_overview Table · BQE_table; BQE_graph*; HYMO_QE_table; HYMO_QE_graph*; PhysChem_QE_table; PhysChem_QE_graph*; RBSP_QE_table and RBSP_QE_graph* · Quality elements by category and Member States · Quality elements – monitored, grouping or expert judgement Table* - Graph* |
* draft dashboards;
River Basin Specific Pollutants
Ecological status includes the assessment of RBSPs[2]. The status of RBSPs was not reported for a large proportion of surface water bodies (around 50 %). At EU level, 88 % of water bodies with known RBSP status were in good ecological status[3]. The proportion of water bodies where RBSPs did not compromise good or high status ranged from [7% (NL) to 100% (FI)].
About 150 RBSPs were reported as causing failure to achieve good ecological status in at least one waterbody. Those most frequently reported as causing failure were the metals zinc, with 798 waterbodies failing to achieve good ecological status, and copper (522 such waterbodies). Other types of substances causing most failures were pesticides, such as glyphosate and its breakdown product AMPA. As individual substances, most RBSPs caused fewer than 100 waterbodies to fail good ecological status.
There are differences in the numbers of substances defined by countries as RBSPs (between 4 and 300) and differences in environmental quality standards applied. This means comparison between countries should be undertaken with care.
Of the thousands of chemicals in use and potentially present in surface waters, relatively few have been identified as causing failure. From the information reported, it is not known how many other chemical pollutants are present in surface waters, and whether their concentrations should be of concern. Further discussion on chemicals is provided in chapter 3 link and chapter 6 link.
|
Further and detailed information on RBSPs/quality elements results is available in WISE · Ecological status by RBSPs see Table and RBSPs status including water bodies with unknown status Table – graph* – graph2* · RBSPs causing failure to achieve good ecological status Table - TableEU – graph · table*, table_category* – table_Member_States* and specific RBSPs* |
* draft dashboards;
2.4 Change in ecological status between first and second RBMPs
The quality of the ecological status classification has largely improved from the first to the second RBMPs. There is a marked reduction of unknowns, a marked improvement of confidence in classification and a large increase in the intercalibrated biological assessment methods.
However, the overall ecological status has not improved since the first RBMPs (figure 2.6). In fact, the results show a slight reduction in the proportion of water bodies in good or better ecological status or potential for all the water body categories. During the first RBMP cycle Member States have introduced better or new ecological monitoring programs with more monitoring sites and more quality elements included.
This complicates the comparison between the status in the first and second RBMPs. The results show that there is limited change in the ecological status from the first to the second RBMPs.
Figure 2.6. Ecological status or potential of all surface waters, rivers, lakes, transitional and coastal waters in the two RBMPs A) with known ecological status in first and second RBMP; and B) both known and unknown ecological status. <in the final report only one of the diagrams will be shown>Notes: SW are surface water bodies summarising all the water categories. The numbers in parenthesis are the number of classified waters bodies that are comparable between the two cycles of RBMPs (WISE evolution type nochange, change, changecode).
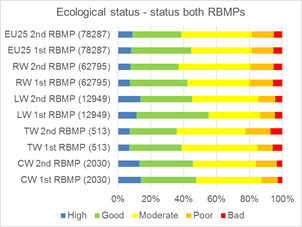

Source: Preliminary results based on WISE-SoW database including data from 25 countries
A closer look at the change in quality elements shows some improvement (Figure 2.7). The improvements are seen in all the most commonly used Biological quality elements (BQEs) in rivers, and in phytoplankton in transitional waters, but is less clear in phytoplankton in lakes and benthic invertebrates in coastal and transitional waters. For phytoplankton in coastal waters, there is even a slight deterioration.
Most of the changes are not reported as consistent, but are rather due to changes in methodology. However, many countries have not reported on consistency, so it is unclear how the changes should be interpreted.
Figure 2.7. Ecological status or potential for major biological quality elements in surface waters in the first and second RBMPs.
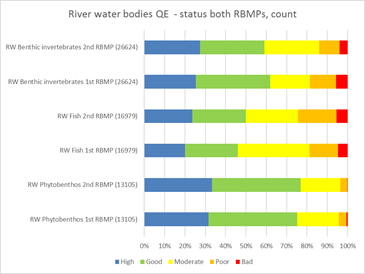
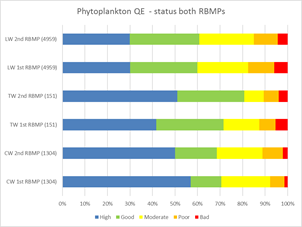
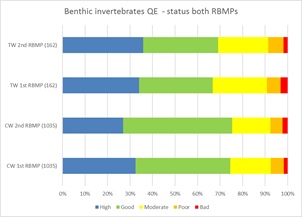
Notes: The numbers in parenthesis are the number of classified waters bodies that are classified for the single biological quality elements and that are comparable between the two cycles of RBMPs (WISE evolution types nochange, change, changecode).
Source: Preliminary results based on WISE-SoW database including data from 25 Member States EU28 except Greece, Ireland and Lithuania).
|
Further and detailed information on change in ecological status and status of quality elements from first to second RBMPs is available in WISE · Ecological status by category in first and second RBMPs graph* · Ecological status by category and Member States in first and second RBMPs graph* - · Ecological status by main quality elements by category in first and second RBMPs table* & graph* – graph2* |
* draft dashboards;
2.5 Pressures and impacts
The main significant pressures causing risk of not achieving good ecological status are point and diffuse source pollution and hydromorphological pressures. The main impacts on surface water bodies are nutrient enrichment, chemical pollution and altered habitats due to morphological changes, reflecting the key pressures.
Diffuse pollution and point source pollution affects 38 % and 18 % of the surface water bodies, respectively. A relatively higher proportion of transitional and coastal water bodies are affected by pollution pressure compared to rivers and in particular lakes. The main drivers for point source pollution pressures are urban wastewater, followed to a lesser degree by industrial plants and storm overflow. For diffuse source pollution, the main driver is agriculture, followed by atmospheric deposition and discharges not connected to sewerage plants.
Hydromorphological pressures comprise all physical alterations of water bodies (including continuity interruptions) which modify their channel, shores, riparian zones, water level/flow, e.g. dams, embankments, channelization, flow regulation. These activities cause damage to the morphology and hydrology of the water bodies. They result in altered habitats, with significant impacts on the ecological status.
Figure 2.8. Proportion of water bodies affected by main pressures of all surface water bodies and by categories: rivers, lakes, transitional and coastal waters.

Notes: The term all SWBs means all surface water bodies summarizing rivers, lakes, transitional and coastal waters. A full attribution of main pressures to ecological status or chemical status is not possible. For diffuse source pollution, 25% of the classified water bodies have diffuse pollution only from atmospheric deposition, which is most relevant for chemical status.
Source: Preliminary results based on WISE-SoW database including data from 25 Member States EU28 except Greece, Ireland and Lithuania).
Hydromorphological pressures affect around 40 % of the surface water bodies, and the highest proportion is reported for rivers and transitional water bodies. Hydromorphological pressures are subdivided into further categories of pressures: physical alterations in the channel, bed, riparian zone or shore (26 %), as well as structures which impact longitudinal continuity (dams/barriers and locks, 24 %) affect the largest share of water bodies. Hydrological alterations affect a smaller share (7 %) of total surface water bodies.
Figure 2.9. Proportion of water bodies affected by main pressures (left) and detailed point source, diffuse source and hydromorphological pressures (right).

Note: Proportion of water bodies with specific pressures, for example, 18 % of water bodies are affected by point sources, and the main point source pressure is discharges from urban waste water treatment plants affecting 12 % of all surface water bodies. A water body may be affected by more than one pressure therefore the sum of percentages is greater than 100 % for the main significant pressures or the percentage for the groups, e.g. the sum of detailed point source pressures is greater than 18 %.
Source: Preliminary results based on WISE-SoW database including data from 25 Member States. EU28 except Greece, Ireland and Lithuania).
|
Further and detailed information on pressures and impact results is available in WISE · Main pressures by category table, · Main impacts by category table · Detailed pressures table; point source pressures table, diffuse source pressures table and hydromophological pressures table; abstraction pressures table; other pressures table |
* draft dashboards;
[1] In the analyses in this report, no distinction has been made between ecological status and potential. The criteria for classification of natural water bodies (ecological status) and HMWBs or AWBs (ecological potential) vary, but the ecological conditions they reflect are assumed to be comparable, having the same deviation from reference conditions.
[2] RBSPs are substances discharged in significant quantities into a water body and are identified by Member States. Environmental quality standards (EQS) are set by the Member State, often at national level but can be at river basin district level. Where the environmental quality standard is exceeded, a water body cannot not be in good or better status. In contrast with priority substances, which are considered under chemical status (chapter 3) the comparability of number of substances set as RBSPs and the value of the EQS can vary between Member States.
[3] Ecological status by RBSPs see Link and RBSPs status including water bodies with unknown status Link