
Post a comment on the text below
3.4 Linking pressures and land use systems
For a continental overview of agricultural production and pressures, data on farming systems, agricultural production levels and agricultural pressures were aggregated at the level of more than 30.000 functional elemental catchments in Europe . Four agricultural pressures were considered: nitrogen surplus, pesticide toxicity, water abstraction for irrigation, agricultural land use in the floodplain (Map 3.1, Map 3.2, Map 3.3, and Map 3.4). This allowed for defining 15 large-scale landscape units of similar agricultural land use and pressures, the so-called “Broad European Agricultural Regions” (BEARs; Schürings et al., unpublished) .
The 15 BEARs consider the four major agricultural regions and distinguish between different farming systems (see chapter2.3). They relate to the dominant agricultural system in the catchment and are characterized by mean levels of agricultural pressures and production, summarised across all catchments belonging to a BEAR. The BEARs show distinct coverage and distribution patterns across Europe: The largest BEAR, for instance, comprises 'Extensive grassland area and fallow farmland’, which is assigned to 25% of the catchments dominated by agriculture (Figure 3.7). With 17% of the catchments the BEAR 'Western intensive cropland’ covers the second largest area. All other BEARs comprise less than 10% of catchments each.
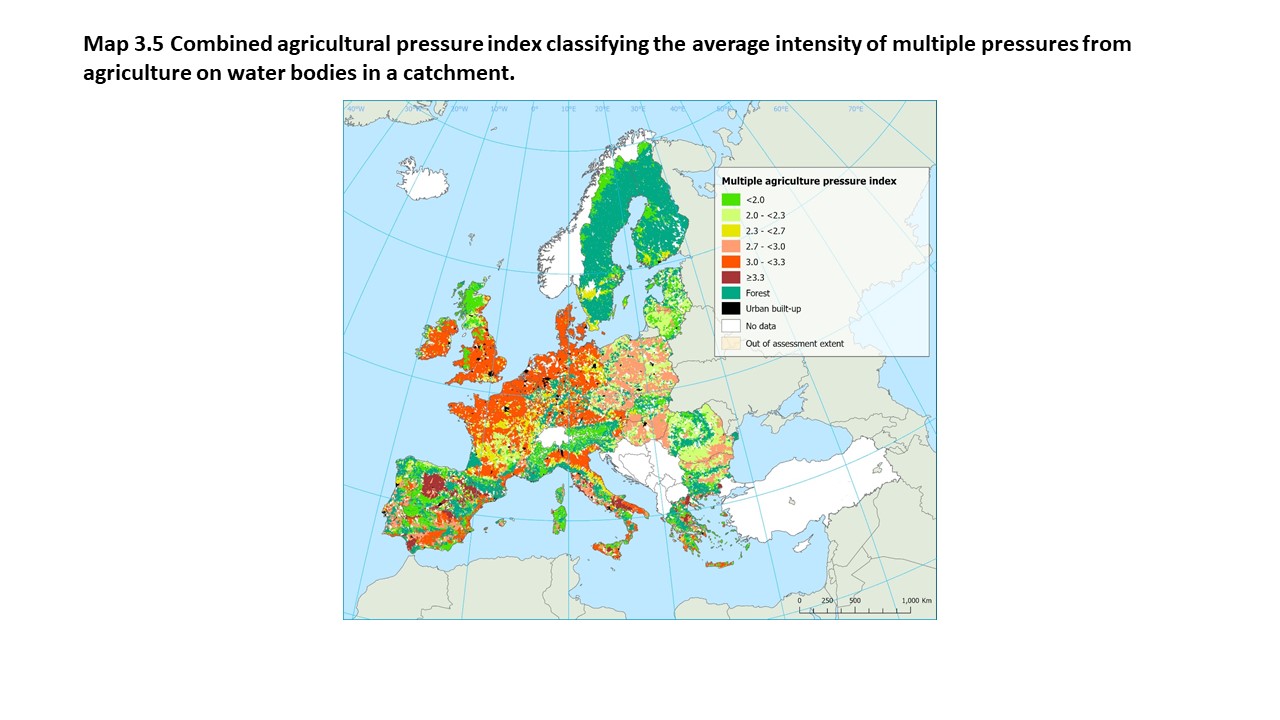
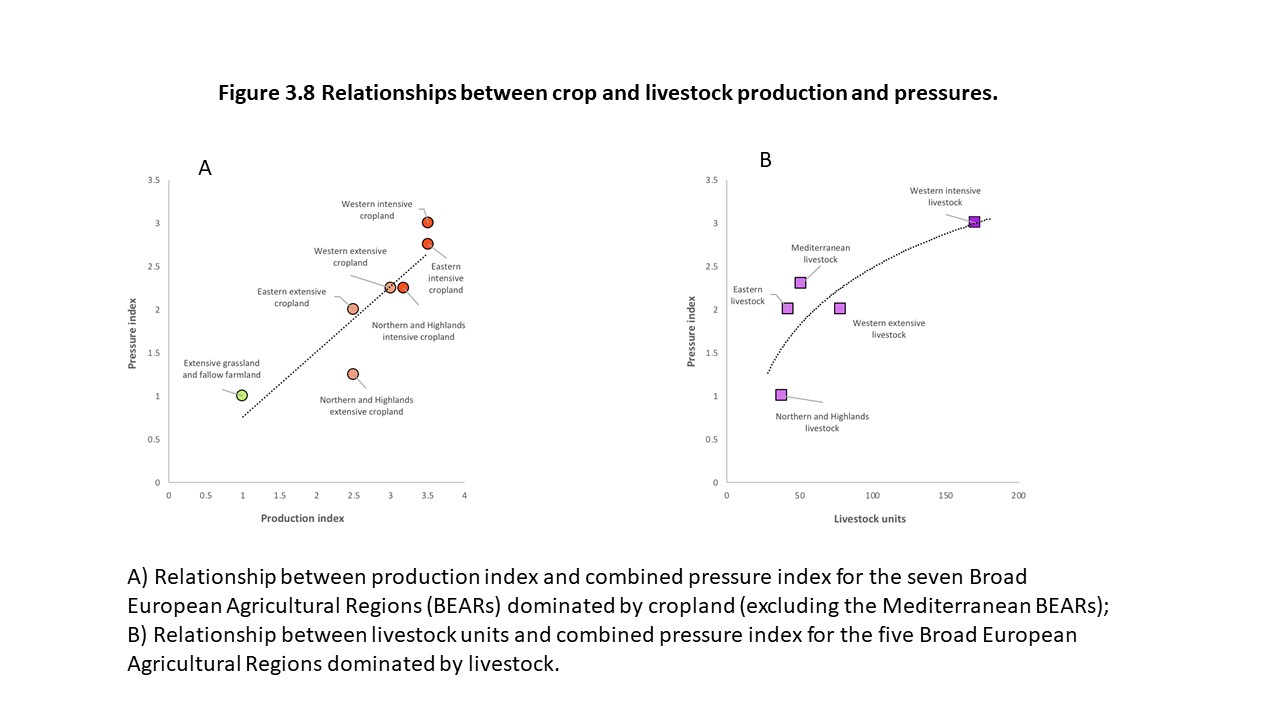
The mean levels of agricultural pressures and production per BEAR allow for calculating cumulative pressure and production indices. For the pressure index, the mean intensities of the four pressures within each BEAR were ranked and their rank-sums were averaged per BEAR. The resulting multiple agricultural pressure index is shown in Map 3.5. For the production index, the mean yields of six common crops within each BEAR were also ranked and their rank-sums were averaged per BEAR. Both indices illustrate positive relationships between agricultural yields and multiple pressures from agriculture, with farming systems of different management intensities well distinguishable across the gradient (Figure 3.8). Similar patterns are discernible for livestock density and multiple pressures across the five livestock-BEARs (Figure 3.8).
You cannot post comments to this consultation because you are not authenticated. Please log in.
Previous comments
At the hydromorphological subchapter Hungary is mentioned as a country which has reported a lot of water bodies affected by agricultural hydromorphological pressure. Due to the uneven distribution of precipitation, drainage and irrigation co-exists in Hungary, to maintain agricultural production and to protect settlements from the excess of water. Both are elementary needs of the society. Map 3.4 clearly shows the overlap between flood-prone areas and agricultural land. Despite all these conditions we see, and agree with the classification of Map 3.5, which shows the multiple agriculture pressure index, that this pressure is moderate in Hungary, especially compared with France, Germany UK, Italy and Benelux MSs.