
Table of contents
3 Pressures from agriculture to the aquatic environment
Key messages
- Currently a large share of surface and groundwater bodies are not achieving good status as required by the Water Framework Directive, in part due to pressures from agricultural activities. Although point source pollution, nitrogen surplus and water abstraction have been reduced, freshwaters continue to be affected by diffuse pollution, water abstraction, and hydromorphological pressures.
- Diffuse pollution of nutrients and chemicals from agriculture remain a significant pressure to one third of surface and groundwater bodies in Europe, and are a main pressure to Europe’s seas. Water abstraction for irrigation accounts for up to 80% of water abstracted in in parts of Europe, and water storage, drainage and land reclamation projects are linked to considerable hydromorphological pressures.
- Pressures are not uniformly distributed across Europe, but are higher in Western and Southern Europe, and lower in Eastern Europe. A multiple pressure analysis indicates a relationship between more agricultural pressures and intensity of the agricultural production.
Diffuse pollution and water abstraction pressures are expected to continue in response to intensive agricultural practices. Climate change increases temperature and alters the supply and demand of water regionally, increasing the need to manage floods and droughts, as well as larger and less predictable seasonal variations. These additional climate impacts exacerbate pollution and abstraction pressures. These changes will impose large additional challenges to manage pressures from water abstraction, nutrients and pesticides, and hydromorphology.
Pressures to the aquatic environment from the agricultural production can be roughly be split into three categories: pollution from diffuse sources, hydromorphological pressures, and from water abstraction. In this chapter, we discuss the status and trends of those pressures together with their impacts.
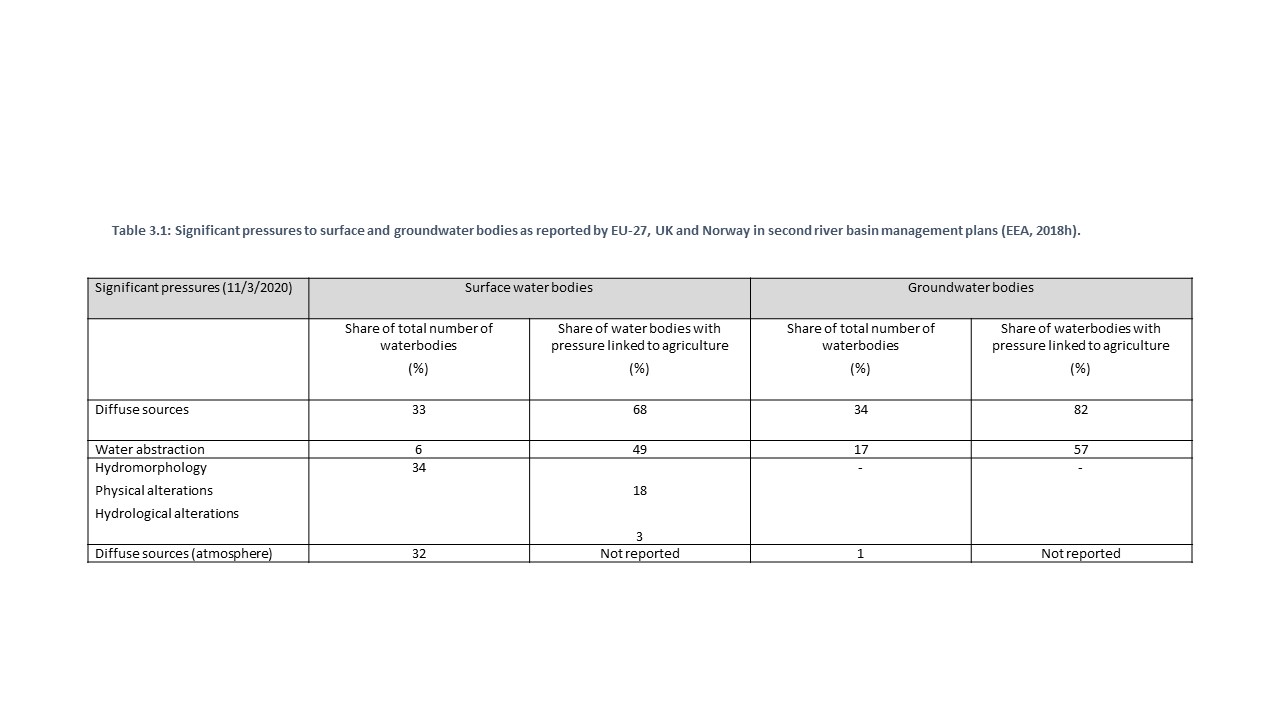
As part of the second river basin management plans, EU-27, UK and Norway reported on significant pressures to surface and groundwater bodies (Table 3.1). Significant pressures are reported when water bodies fail to achieve good status, and for most pressures the attribution to agriculture is to more than 50% of the water bodies affected.
Both crop and livestock production are associated with pollution and water abstraction pressures to the aquatic environment. Crop production requires application of synthetic and organic fertilisers, pesticides, herbicides and other plant protection products, as well as irrigation water to support and optimise crop productivity. Manure from livestock production is an organic fertiliser both used as a crop fertiliser and it is spread by grazing animals. In contrast to crops, livestock rearing does not require large inputs of water. Hydromorphological pressures are associated with the over all agricultural activity, where alterations to the natural river has often been made with the aim of optimising the agricultural production.
Soil management operations and cropping practices are important for managing risks to the water environment. Overall, disturbances to soil structure and functions may reduce its capacity for efficient nutrient recycling and natural water storage capacity. Hence, optimising soil for the agricultural production through drainage is a considerable hydromorphological pressure, as is alteration of rivers to enable better water storage for irrigation.
3.1 Diffuse pollution
Agriculture is considered a main contributor of nutrients, pesticides and some metals to the aquatic environment (Chapter 2). Other substances, such as veterinary medicines also reach the aquatic environment, but in comparison very little is known about inputs or their impacts. Diffuse pollution of nutrients and pesticides remain a significant pressure to one third of surface and groundwater bodies in Europe, and are a main pressure to Europe’s seas.
3.1.1 Diffuse nutrient pollution
Excess nutrient pollution causes widespread environmental and human health problems. Nutrients stimulates undesired plant growth, and can lead to widespread eutrophication of Europe’s rivers, lakes, transitional and coastal waters and seas. By causing anaerobic conditions, eutrophication has large impacts on biodiversity. Therefore, the ecological status of water bodies is highly sensitive to nutrient pollution. High nutrient concentration also influences drinking water quality. Excess of nitrates in drinking waters can have human health impacts, such as methemoglobinemia, which prevents the normal transport of oxygen by the blood to the tissues causing cyanosis (EC, 2018)
In EU, the average nitrogen surplus from excess fertilization of agricultural areas was 49 kg N/ha in 2013-15. It decreased by 10 % between 2004 and 2015, although nitrogen fertilizer use increased during the same period. This is possible because more optimal fertilization approaches are in use, securing that inputs are much more in line with timing of plant uptake, i.e. nitrogen use efficiency has improved (ESTAT, 2017). In the same period phosphorus surplus on agricultural land also decreased from 4 kg P/ha and year to 1.2 in the time period 2004 to 2015 (ESTAT, 2017). As phosphate is effectively stored in soils, a surplus can be reduced without short term impacts on crop productivity (provided that soil is saturated).
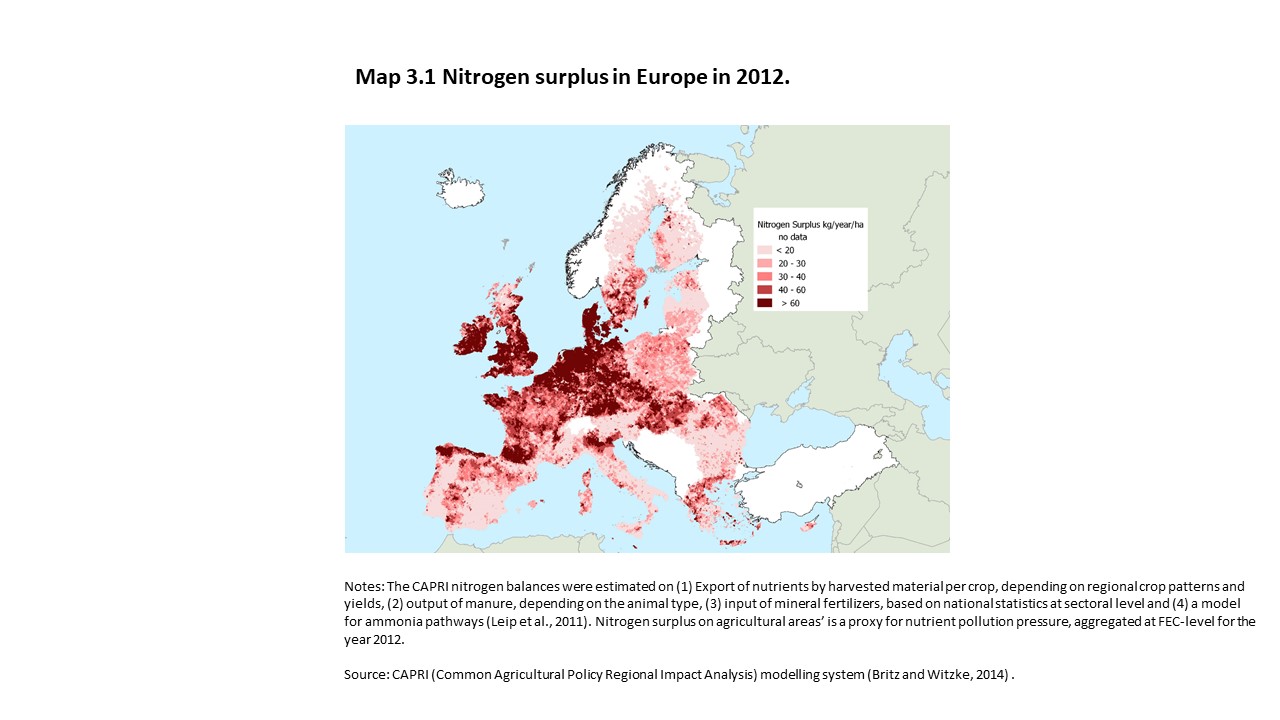
As agricultural production is not evenly distributed and agricultural systems also differ widely across Europe, nutrient inputs are also highly variable in space. Here we use the geographical distribution of nitrogen surplus as a proxy for this variability. Nitrogen surplus exceeding 40 kg per hectar/year and which are associated with the most intensive agricultural production methods are located in Central Europe, Germany and the Netherlands in particular, but also in Denmark, the UK and Ireland, and parts of France, Spain, Italy and Hungary (Map 3.1).
The amount of nutrients that end up in streams and the rate at which this occurs, depends crops, specific application strategies, and on a wealth of local geographical factors, such as soil quality and permeability, water availability, groundwater residence times, catchment topography, presence of natural and constructed buffers and wetlands, and climate. Together these factors determine the catchment nutrient residence time. These factors also determine the specific transformations that take place. One of these, denitrification is particularly important as it returns reactive nitrogen (such as nitrate) to the more stable atmospheric N2, which may account for considerable nitrogen removal. Ultimately, these processes determine the share of nutrients that end up in rivers, lakes, transitional, coastal waters and Europe’s seas.
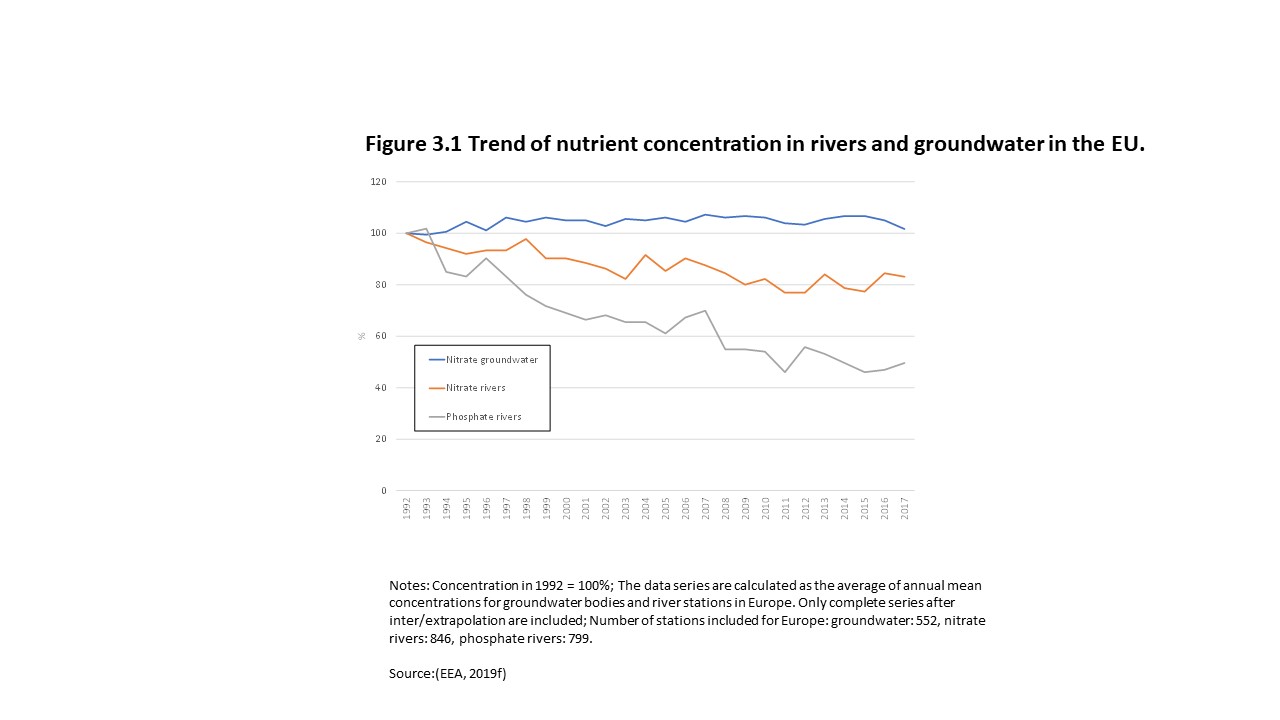
In Europe, significant efforts have been made towards reducing point source emissions, and especially the implementation of urban waste water treatment has led to declining concentrations in rivers of phosphate associated with industrial and urban waste water pollution (EEA, 2019c). In contrast, concentrations of nitrates more closely linked to agricultural diffuse pollution are declining much more slowly in rivers and not at all in groundwater (Figure 3.1).
These trends are also reflected in results of the second river basin management plans compiled under the Water Framework Directive. In them, significant pressures linked to diffuse emissions were identified for 33% surface water and 22% of groundwater bodies in EU and Norway, and the pressures in close to 70% of those waterbodies were specifically linked to agriculture (EEA, 2018f). This assessment is made when surface water bodies fail to achieve good ecological status or when groundwater bodies fail to achieve good chemical status. Groundwater bodies primarily fail to achieve good chemical status due to elevated concentrations of nitrates in groundwater.
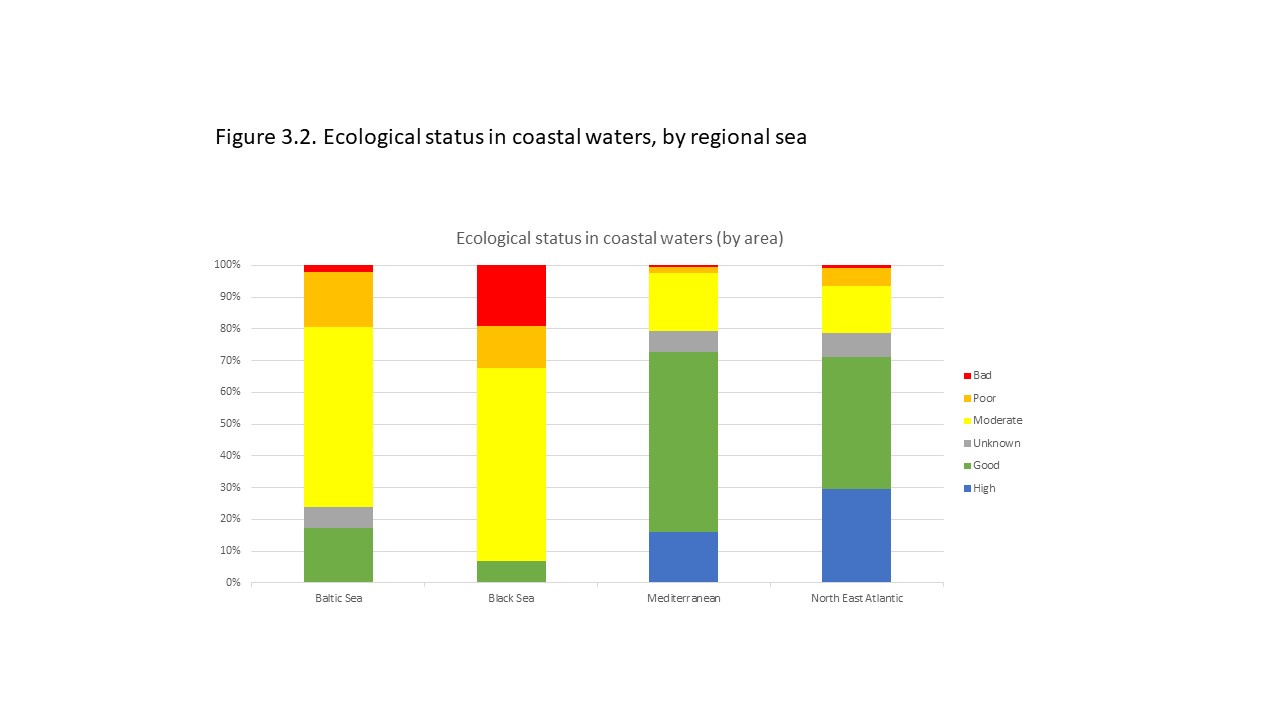
Diffuse pollution from agriculture and the associated eutrophication is a major environmental pressure in Europe’s coastal waters and seas, especially in the Baltic and Black Seas where only 10% and 15% of coastal waters achieve good ecological status (Figure 3.2). A recent assessment of eutrophication in Europe’s seas showed that 99% of the Baltic Sea area, 53% of the Black Sea area, 12% of the Mediterranean area and 7% of the North East Atlantic area were assessed as problem areas with respect to eutrophication (EEA, 2019e). The Baltic and Black Seas are semi enclosed and highly stratified seas with hydrodynamical conditions that hamper water exchange with surrounding water. Both have extensive dead zones as a consequence. The large problems linked to eutrophication in the Baltic Sea has led to international collaboration in context of the Baltic Sea Action Plan, also adopted as a European Regional Strategy (EC, 2009, Box 3.1)
Box 3.1 The Baltic Sea Action Plan
In addition to the obligations linked to the EU Marine Strategy Framework Directive, the Baltic Sea coastal states (which include several EU Member States and Russia) collaborate to specific targets for nutrient emissions as part of the Baltic Sea Action Plan. The Plan was adopted in 2007. It incorporates the latest scientific knowledge and innovative management approaches into strategic policy implementation around the topics of eutrophication, biodiversity, hazardous substances and maritime activities.
Improving the Baltic Sea eutrophication status continues to require reductions in nutrient loads. Nutrient emissions to the Baltic Sea declined by 22% for phosphorus and 25% for nitrogen between 1995 and 2014. Load reductions have primarily been attributed to reductions in point source pollution.
The 2014 assessment indicated that diffuse sources mainly from agricultural activities. constitute the major part, making up 46% of the total riverine nitrogen load and 36% of the total riverine phosphorus load to the Baltic Sea. The variability of utilised agricultural area within the catchment is reflected in the variability in contributions. High impact is found in the Gulf of Riga (57% for nitrogen, and 42% for phosphorus), and for nitrogen also in the Danish Straits (68% for nitrogen), and Kattegat (59% for nitrogen).
While these load reductions are considerable they have not been sufficient to achieve the desired environmental improvement of the sea. This is because negative feedback mechanisms in the sea continue to release phosphorus from sea floor sediments during anoxic conditions, slowing down its environmental improvement. Phosphorus in the sea floor stems from historical anthropogenic releases.
Source: (Sonesten et al., 2018)
3.1.2 Pesticides, metals, and veterinary medicines
The environmental impacts of pesticides and metals are large, and in addition they cause problems for human health through contamination of drinking water and food. Unfortunately, specific environmental impacts are not always well understood.
Soil, with the help of various organisms, filter and buffer contaminants in the environment. Substances that are not readily degradable will eventually leach into surface and groundwaters or be dispersed by wind erosion(Sandin, 2017; Silva et al., 2018).
Pesticides
Active substances used in both plant protection products and biocides are approved at EU level. EU countries authorize those active substances on their territory and ensure compliance with EU rules. Agriculture is the primary user of pesticides, but they are also used in forestry, horticulture, and in gardens (chapter 2).
Pesticides can harm the environment by contaminating soil, surface and groundwater. Aquatic organisms are directly exposed to pesticides resulting via surface run-off or indirectly through trophic chains (Maksymiv, 2015). The number of approved active pesticide substances in Europe is around 500 among them around 25% are considered of low risk (EC, n.d.).
Although pesticides pollution is recognized as a main problem in European countries and many studies have documented the presence of excessive pesticides in the environment, data of European coverage are scarce. . According to data reported for the 2nd RBMP under the WFD the number of water bodies exceeding the environmental quality standard (EQS) for pesticides was relatively low; about 160 different synthetic and naturally occurring substances cause poor chemical status in EU Member States. One third of these substances are pesticides. Only a small portion, .806 out of 111 115 surface water bodies fail good status caused by pesticide substances. For groundwater, 370 out of 13 411 water bodies water bodies exceed the EQS for total pesticides, equivalent to 3% (EEA, 2018d).
Pesticide substance concentrations reported to the WISE Waterbase, suggest that exceedance rates could be higher than captured by the 2nd river basin management plans. In surface waters, exceedance rates caused by herbicides and insecticides are found for 5 – 15% and 3-8% of observations respectively. For groundwater, exceedances occur mainly for herbicides in 7 % of observations and less than 1 % of observations for insecticides. Fungicides seem to be of lower importance (ETC/ICM, fothcoming).
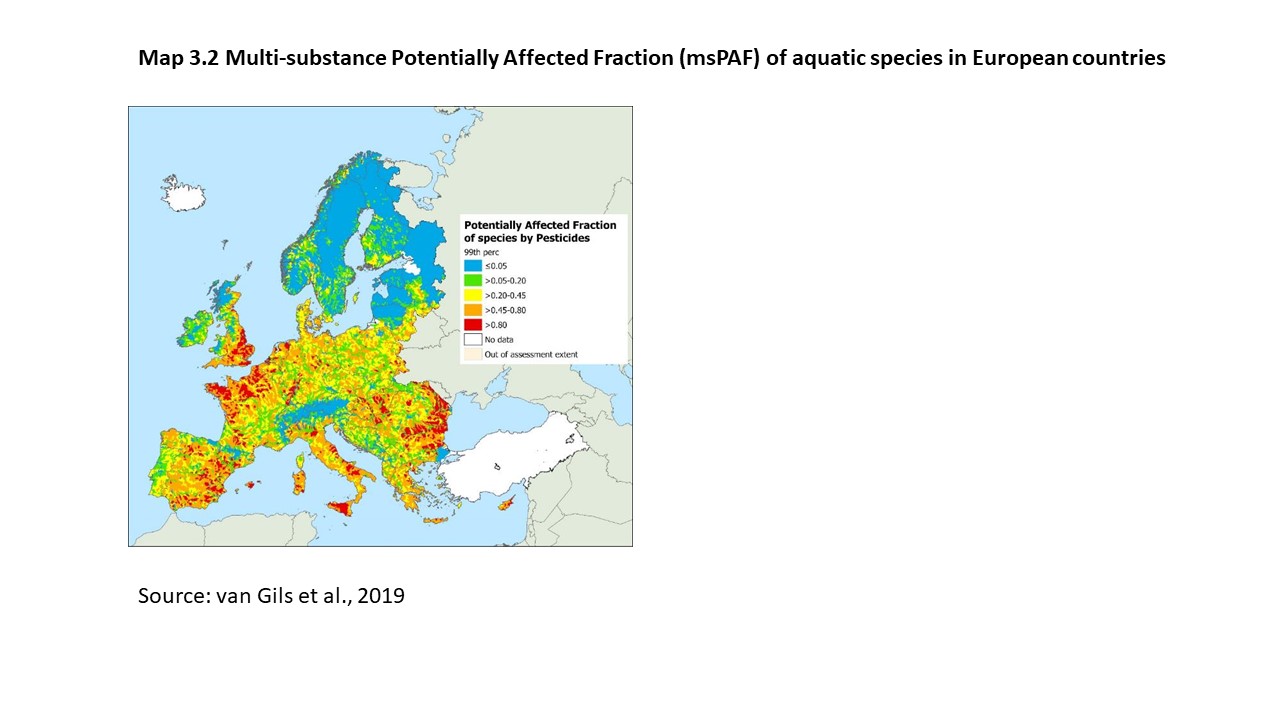
The heterogeneous reporting of pesticides in Europe are heterogeneous on both temporal and spatial scale means that a quantitative assessment of the risk to the environment must be modelled. To quantify the effects of pesticides on the freshwater ecosystems, the chronic multi-substance Potentially Affected Fraction (msPAF) of aquatic species can be used as a proxy for pesticides pressure intensity (Figure 5). The msPAF specifies the potential share of the biological community affected by pesticide toxicity (van Gils et al., 2019) It has been derived from modelling the cumulative impact of individual substances, aggregated according to their specific modes of action. The highest share of potentially affected fraction of aquatic species is found in western part of France, Belgium, the Netherlands, the north-western parts of Germany, western UK, Spain and Italy, Romania and Bulgaria, Malta and Cyprus. Low values of msPAF, are found in the northern parts of Europe and in alpine regions where agriculture is less intense.
Metals
Metals accumulate in and contaminates arable soils. Cadmium, copper, and zinc are among the more common metals. They are linked to different sources of fertilizer.
Cadmium — mainly originating from mineral phosphorus fertilisers — accumulates in 45 % of agricultural soils, mainly in southern Europe where leaching rates are low due to a low precipitation surplus (EEA, 2019g). Cadmium is grouped as a priority hazardous substance in the EQSD, i.e. among the most toxic environmental chemicals. Cadmium is however rarely transferred to water, and is of less concern in water.
Animal manure is the largest source of copper and zinc. The metals are added to animal feed and is introduced into the environment through manure spreading. Because of its bactericidal and fungicidal properties, copper has been widely used as a fungicide spray, especially in vineyards and orchards. Results from the Land Use and Coverage Area Frame Survey (LUCAS) soil sampling 2009-2012 show elevated copper levels in the soils in the olive and wine-producing regions of the Mediterranean (EEA, 2019g). Copper-containing materials are also applied as anti-fouling agents for farm cages and nets (Burridge et al., 2010)
Veterinary medicines
Veterinary medicines reach agricultural soils, surface waters and groundwater directly by grazing animals or aquaculture or indirectly by the use of manure application. The most used veterinary drugs are antimicrobials, antibiotics in particular(Box 3.2). Modern food animal production depends on the use of large amounts of antimicrobials for disease control, and this provides favourable conditions for selection, spread and persistence of antimicrobial‐resistant bacteria and their impacts for biodiversity and human health in the environment (Aarestrup, 2005). Management of these substances is an emerging subject.
Box 3.2 Small stream monitoring on veterinary drugs and pesticides in Europe
Based on a scientific study, pesticides and veterinary drugs were monitored in 29 small streams and 10 countries of the European Union. The results showed, that all the sampled European rivers included in this investigation were contaminated with mixtures of pesticides and, in most of the cases, with several veterinary drugs at the time of sampling, without a clear national or regional pattern. In total, 103 different pesticides, 24 of them banned in the EU, and 21 veterinary drugs were found in the analysed samples.
Source: Casado et al., 2019
3.2 Water abstraction
3.2.1 Background
Hydrological regimes are key in maintaining healthy aquatic habitats and the quality of aquatic ecosystems, and their role in supporting the achievement of environmental objectives is fully recognised in the WFD. Agriculture can have widespread impacts on the hydrological regime of river basins and aquifers, by changing land use and altering natural hydrological flows across the landscape, and by increasing abstraction in surface water and groundwater bodies. In addition, irrigation infrastructure often involves the building of water storage (reservoirs) and water transfers.
This chapter focuses on agricultural abstraction pressures, which can play a significant role in exacerbating minimum flows needed for health stream ecology. Unsustainable levels of abstraction can reduce river flow to levels that are critical for water-borne flora and fauna. Reduced flows result in a host of other impacts, from lower dilution of pollutants, to the disruption of sediment and nutrient transport, and alterations to natural habitats conditions, including wetland and transitional waters (Chapter 3.6).
Abstraction in groundwater poses several threats too. Groundwater is a crucial source of water for nature, especially wetlands and coastal ecosystems, and for water supply, especially for drinking water. Abstraction in groundwater can deplete aquifers and increasing the risk of pollution and saline intrusion. Abstraction in groundwater bodies may not have an immediate impact on surface water bodies, but it may reduce river base flows in the medium term by reducing return flows into surface water bodies.
3.2.2 Current level of agricultural water abstraction
In the 2nd RBMP under the WFD , water abstraction for agriculture is reported as a significant pressure on the water environment in 64% of EU-28 countries (18 out of 28) and 44% of RBDs (85 out of 194). The countries with the highest proportion of surface water bodies significantly impacted by agricultural abstraction are Cyprus, Spain, France, the Netherlands, Bulgaria, Greece, Hungary and Italy. For groundwater bodies, Cyprus, Hungary, Greece, Spain, Malta, Italy and France are the most affected countries.
Agriculture abstracted on average 50 km3 of water between 2008-2017 in the EU-28, which is about 24% of total water abstraction (EEA, 2020a). In the EEA-32, total agricultural abstraction was on average 92 km3 during that period, with Turkey abstracting on average 40 km3 of water every year. Most of the water abstracted by agriculture is consumed by the plant or lost as evapotranspiration, and therefore does not return to the environment (Box 3.4). As a result, agriculture is the largest net water user in Europe, accounting for 59% of net water use in the EU-28 (EEA, 2020a).
Box 3.3 Accounting for water used in irrigation.
Water abstraction refers to the withdrawal of water from a water source e.g. pumping water from groundwater, harvesting water from a spring, extracting water from a river, lake or reservoir. In contrast, water use refers to net water consumption, which is not returned to the environment in the form of return flows or losses due to evapotranspiration.
In agriculture, unintended losses can occur at all parts of the distribution system. For instance, leakage may occur in the canals and pipes bringing water from the abstraction point to the field. In the field, the efficiency of the irrigation methods and technologies or the meteorological conditions at the time of application will influence losses due to infiltration and seepage to groundwater, and evapotranspiration rates. Irrigation management aims to reduce these losses.
In addition, different crops will have different water consumption intensities. For example, cotton crops water need vary between 7000 and 13000 m3/ha while beans water needs are around 3000-5000 m3/ha. Water consumed by the crop will not return to the local environment.
In agriculture, a large share of abstracted water is not returned to the environment as it is consumed by the plant or evaporates into the atmosphere. This contrasts significantly with other large water uses in Europe, such as public water supplies, which return most of the abstracted water as wastewater discharges.
Sources: ESTAT, 2020i; Brouwer and Heibloem, 1986
It is estimated that about 50% of water abstracted for agriculture in the EU-28 between 2008 and 2017 is from groundwater bodies (EEA, 2020a). The other half is divided between reservoirs (27%) and rivers (23%). The share of abstraction between surface water and groundwater differs between countries. Groundwater abstraction for irrigation exceeds 50% of total water abstraction for irrigation in Malta, Lithuania, Denmark, Cyprus, the Netherlands, Germany and Portugal. Some of these countries, such as Cyprus and Malta, have more than 50% of their groundwater body area in bad status.
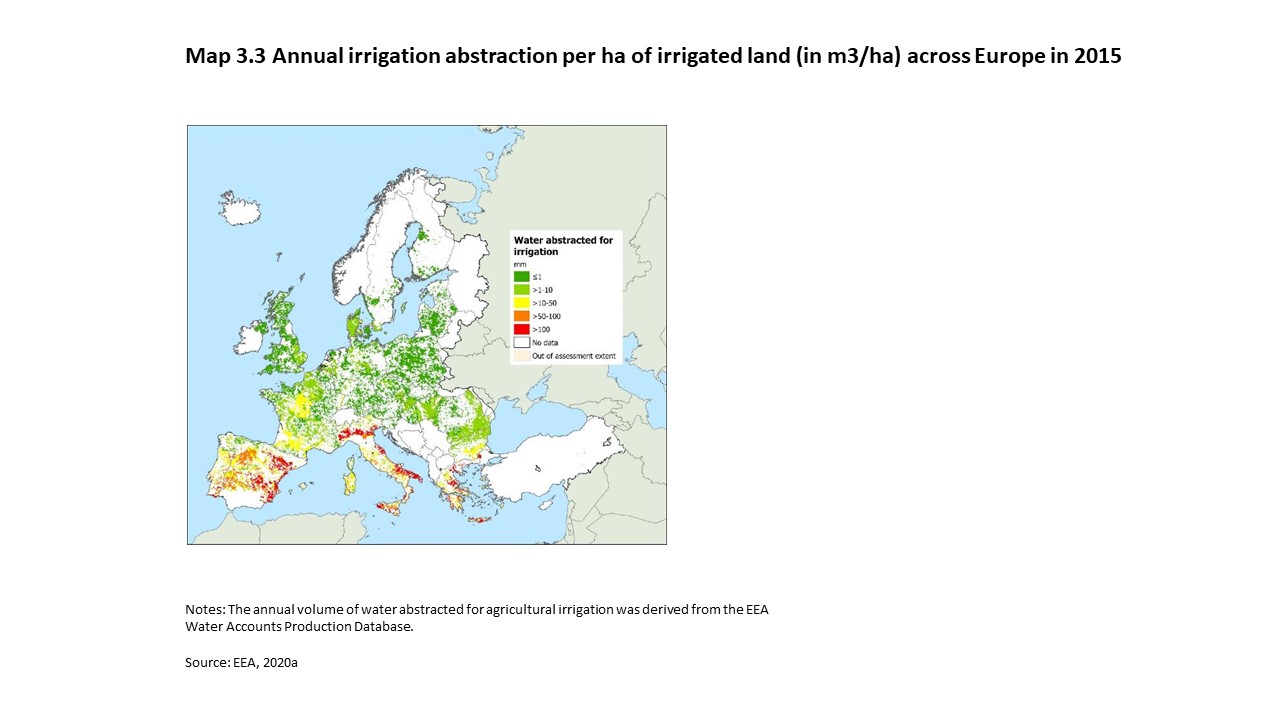
Italy, Spain, Greece and Portugal accounted for 91% of water abstracted for agriculture in the EU-28 between 2008 and 2017 (EEA, 2020a). This is also reflected in an analysis of the spatial distribution of the most intensely irrigated areas (Map 3.3). In those countries irrigation water abstraction levels ranged between 4500-9500 m3/ha in 2015. Other Mediterranean countries, such as Cyprus and Malta, present similar high intensities. Bulgaria has the highest irrigation water abstraction intensity (9000 m3/ha), while high rates are also found in France, Denmark, Lithuania and Romania (2000-3000 m3/ha).
3.2.3 Trends in water abstraction
Long term statistics on agricultural water use are difficult to recreate given the lack of adequate reporting on irrigation water use before the 1990s. Most studies indicate that water abstraction for agriculture has steadily grown in the second half of the 20th century with the expansion of irrigated agriculture (Molden et al., 2007a).
Since 1990, total abstraction from agriculture has reduced in the EU-28, from 80 km3 in 1990 to 53 km3 in 2017 (EEA, 2020a). The largest change in the EU-28 occurred in 1990 with the change of political system in Eastern Europe, where agricultural water abstraction has decreased from from 8 km3 in 1990 to 1 billion km3 in 2017 in Romania and Bulgaria alone.
In total, a fall can also be observed in 16 countries of the EU-28 (EEA, 2020a). Reasons for this evolution are complex and locally specific. In some countries, such as France, it can be associated with the shifts in prices, e.g. favouring less water demanding cereals at the expense of more water demanding maize, as well as stricter abstraction controls imposed by WFD to protect ecosystems during droughts, changes in agricultural policy priorities, or loss of agricultural land to urban area (Martin, 2013).
Some countries have increased agricultural water abstraction such as Belgium, Lithuania and Cyprus. In the EEA-32 countries, Turkey has seen a significant rise in its agricultural abstraction, from 27 billion km3 in 1990 to nearly 46 km3 in (EEA, 2020a).
3.2.4 Unsustainable water abstraction and areas under water stress
The degree of impact of agricultural abstraction on the aquatic ecosystems depends on the volume of water abstracted, the type of resource exploited, the location of the abstraction point, and the timing of the abstraction, in particular with regards to surface water and groundwater levels and climate conditions. The multiplication of agricultural abstraction points can cumulatively lead to a significant impact on the overall water balance of a catchment or an aquifer, and contribute to water scarcity. It can be particularly impactful on the water environment because abstraction occurs during the dry season when crop water demand is at its highest, while river flows are at their lowest.
Water scarcity is a measure of water availability in relation to human demands. It occurs when the demand for water by different economic sectors exceeds water availability. It is not only related to water demands by agriculture, but to the demand of all sectors that rely on water: households, industry, cooling water and agriculture. These activities are unevenly distributed across Europe, and some have more constant demands whereas especially agriculture has very strong seasonal demands.
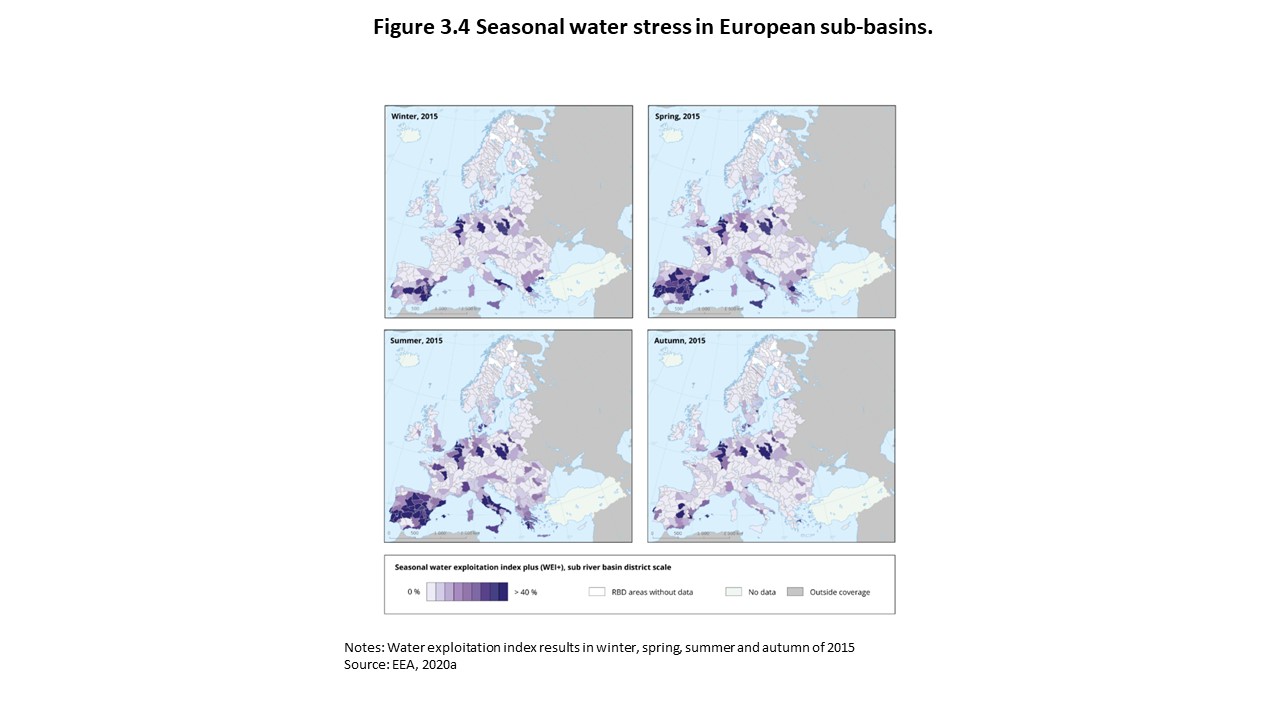
Water stress can be used to assess the degree of water scarcity, and is calculated as the imbalance between renewable water resources and water demand. It is expressed by the water exploitation index (WEI+) as the percentage of total water use from surface and groundwater systems over the renewable freshwater resources for a specific area and time. A WEI+ above 20 % implies that a water resource is under stress, and more than 40 % indicates severe stress and clearly unsustainable use of the resource.
The seasonal variation of WEI+ has been calculated for Europe (Figure 1.4). Water scarcity associated with agricultural activities have a strong seasonal variation especially evident in southern European countries such as Spain, Italy and Greece. Agricultural water use also contributes to water stress in other regions, where irrigation is developed.
Supporting sustainable abstraction in agriculture and restoring hydrological regimes in rivers and groundwater levels are essential to supporting healthy ecology, enhancing natural resilience to drought, and ensuring that rivers continue to support wellbeing and recreation.
3.3 Hydromorphological pressures
3.3.1 Background
Hydromorphological pressures are assessed as part of the Water Framework Directive, requiring Member States to monitor and manage the effects of changes from physical characteristics on surface water body ecology. Hydromorphological pressures are one of the main reasons for failure to reach good ecological status in European water bodies.
Hydromorphology is a term used in river basin management to describe the hydrological (e.g. water flow) and geomorphological processes and characteristics of surface water bodies, which in combination play a key role for aquatic ecosystems, habitats and species. Good hydromorphological functioning, in particular river-floodplain dynamics, is an essential element of ecosystem health and underpins the delivery of many ecosystem services and benefits for society (EPA Catchments Unit, 2016; Houlden, 2018). Especially river-floodplain dynamics are of high relevance for the development of natural hydromorphological conditions (EEA, 2019c). Hydromorphological pressures include physical changes in natural water bodies to control flow, erosion and floods, as well as land reclamation through drainage and river straightening. These pressures are largely responsible for the widespread loss of wetlands that has occurred in past centuries and are linked to many different human activities, including agriculture, urbanisation, energy production and transport.
The physical impact of agriculture on surface water bodies has to a large extent resulted from drainage needed to increase the area of land with conditions appropriate for crop production, and the need to store water for irrigation (Chapter 2.2.3). Impacts include changes in flow, changes to river banks, riparian zones and floodplains, increased sedimentation and disruption of continuity. Flood protection has been installed across Europe, among others to protect agricultural land from damaging floods.
Agricultural activities such as crop cultivation and livestock production impact floodplains and riparian vegetation, when carried out immediately adjacent to the river or in the floodplain. As a result, the edges of many rivers are directly in contact with agriculture and river floodplains have been fragmented and often reduced to narrow strips or isolated trees on the river banks (REFORM wiki, 2015).
Table 3.2 provides an overview of the key hydromorphological pressures and impacts caused by agricultural activities on water bodies and their surrounding floodplains.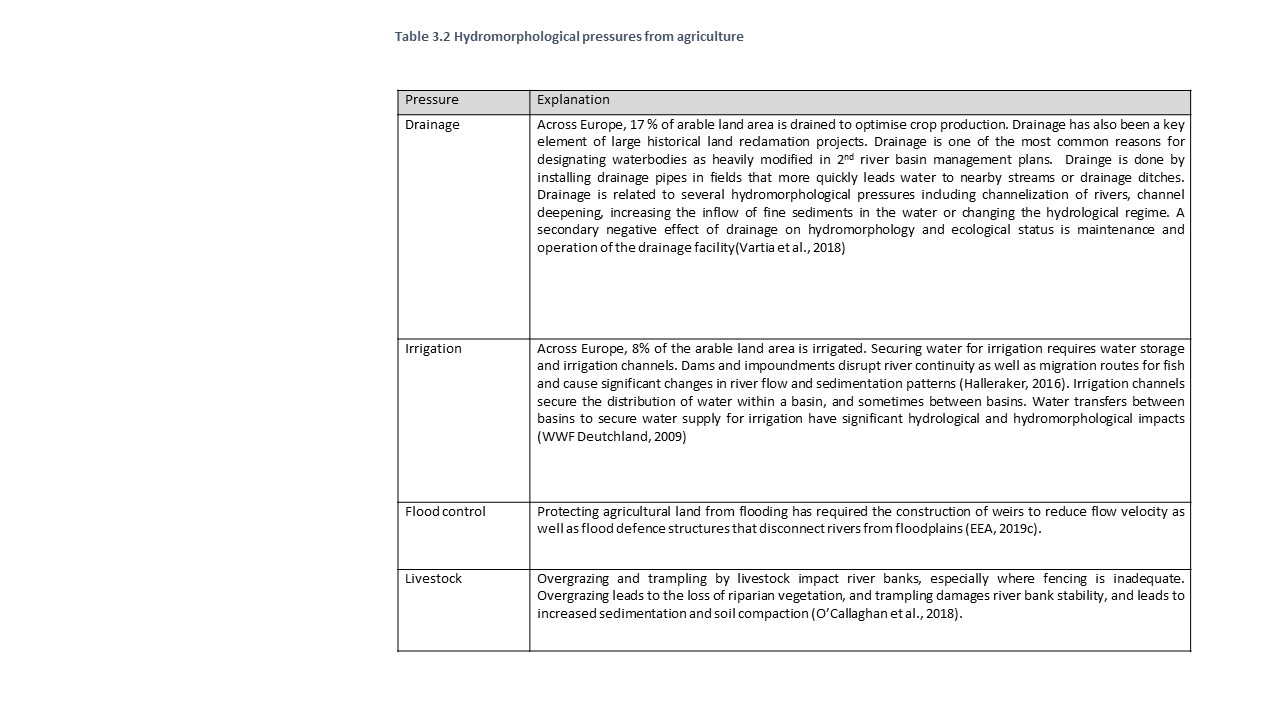
3.3.2 Current status
According to the 2nd river basin management plans (RBMPs), 34% of surface water bodies across the EU are affected by hydromorphological pressures. Hydro-morphological pressures have been identified in almost all Member States, although to a different extent, with some countries having more than 60% of their water bodies affected. In the majority of countries, between 10% and 60% are affected by hydromorphological pressures and only a few countries have reported a share of affected water bodies lower than 10% (EEA, 2018g).
The share of water bodies affected by hydromorphological pressures which are directly linked to agriculture is approximately 7% of total water bodies (EEA, 2018b). The lack of hydromorphological assessment methods and monitoring data appropriate for understanding the nature of hydrological and morphological modifications from agricultural activities, may have led to under estimation of these pressures. Some countries such as Germany, Hungary, Croatia and Spain reported a substantial share of water bodies affected by agricultural hydromorphological pressures, but according to the assessment of the 2nd RBMPs by the European Commission, for most Member States, the identified hydro-morphological pressures have not yet been clearly apportioned to specific sectors (including agriculture) in the WFD reporting (EC, 2019a). Nonetheless, awareness of the importance of hydromorphological pressures and impacts from agriculture is growing.
In addition, drainage for agriculture is the third most common reason for designating water bodies as heavily modified in the EU (having led to the designation of ca. 3,700 out of ca. 18,000 heavily modified water bodies in the 2nd RBMPs), with the highest numbers being designated in Germany and the UK. An additional 1,500 heavily modified water bodies have been designated due to physical modifications of water bodies that serve irrigation, with the highest numbers being designated in Spain, Poland, Italy and Hungary (EEA, 2018a).
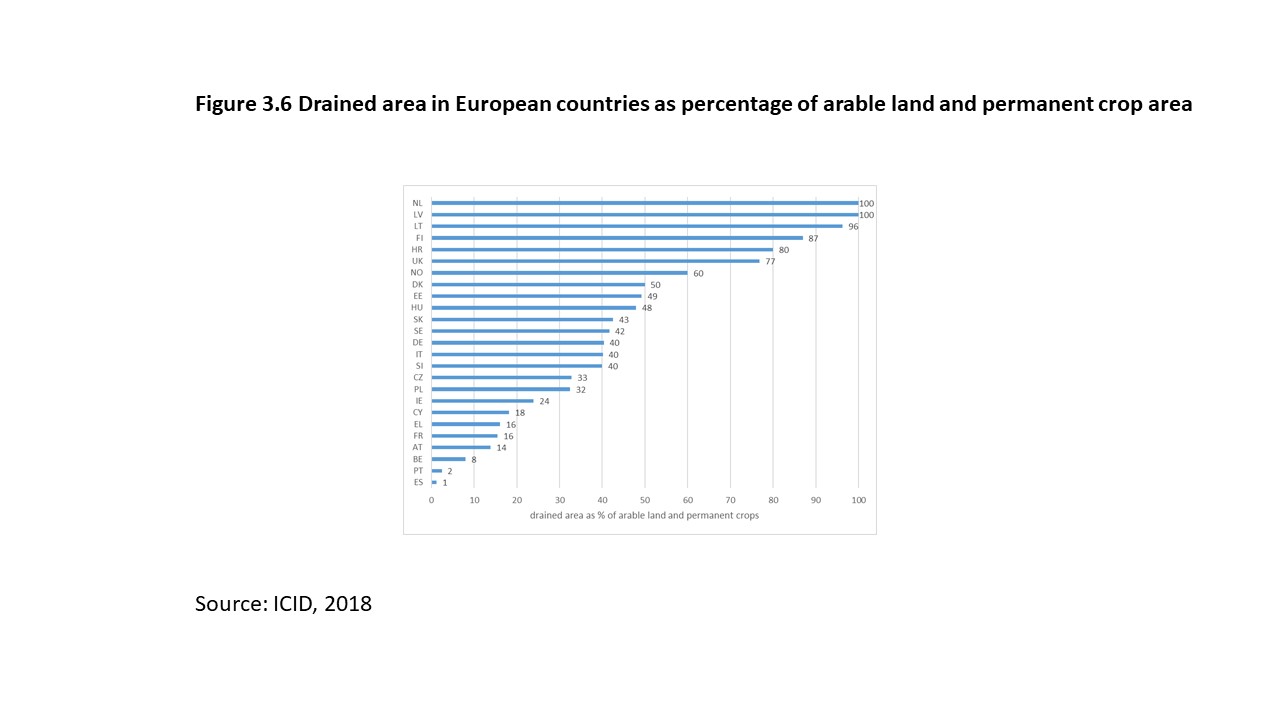
An overview of the proportion of arable land and permanent crops which is drained is shown in Figure 3.6. Drainage occurs in all countries, but with a strong north to south gradient. In the Netherlands, Latvia, Lithuania, and Finland almost all agricultural land is drained (Herzon and Helenius, 2008). In a high number of European countries, more than 40% of farmland is being drained. E.g. in Denmark, 52% of the agricultural area was drained in the 20th century (Møller et al., 2018). Also in other countries with a large area of arable land, the share of drained land is high, e.g. 77% and 40% in the UK and Germany respectively. (see country details in Annex). In southern European countries drainage is lower probably because agriculture in southern Europe is mostly irrigated.
A recent study in Sweden aimed at supporting a national strategy for prioritising measures to improve the water environment in agricultural areas concluded, that a high share of arable land close to water bodies and on their floodplain leads to the impairment of ecologically important structures and functions and degradation of morphology. The result was based on a clustering analysis of sub-basins in Sweden on the basis of agricultural activities. Evidence was provided that sub-basins with a high share of arable land and intensive farming, including livestock, seldom achieve good ecological status while achievement of good ecological status is much more common in sub-basins with a high share of meadows and pastures (Box 3.4)
Box 3.4 Analysis of agricultural impact on hydromorphology in Sweden
In this clustering analysis, 50.800 sub-basins in Sweden were divided into seven groups based on agricultural values. Three of the seven groups (forest, mountainous areas and wet areas) contain three-quarters of all sub-basins but have almost no agriculture. The other four groups are characterized by a high proportion of a certain type of agriculture: intensive farming with special crops, pig production and laying hens (group 2), meadows and pastures (group 3), rural areas with forestry and agriculture (group 4) and intensive farming with cattle and milk production (group 5). Although the total number of sub-basins in groups 2 and 5 constitutes only 2.7% of all Sweden's sub-basins, the majority of Swedish agricultural production is in these sub-basins (77% of all arable land, 91% of land with special crops, 91% of pig livestock and 84% of laying hens in Sweden). The ecological status of water bodies was compared between these different groups.
Source: Swedish Board for Agriculture and Swedish Agency for Marine and Water Management, 2020.
3.2.3 The share of agricultural land in floodplains as proxy indicator
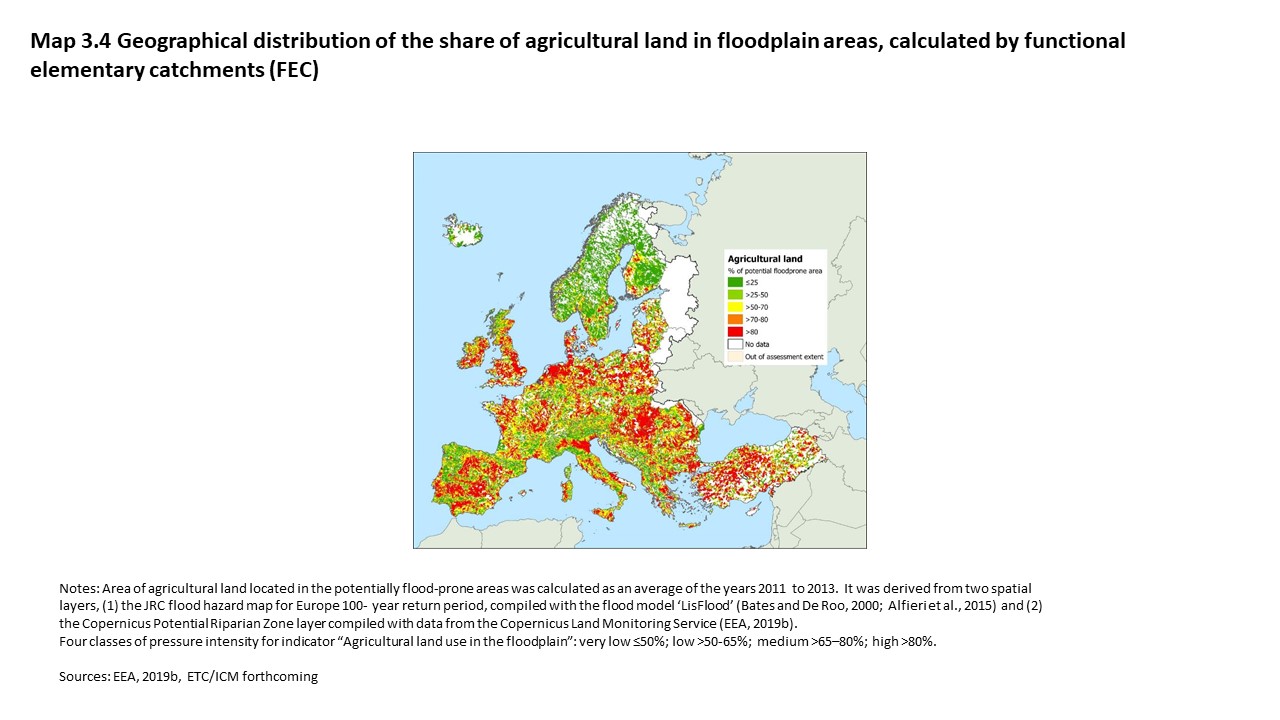
Agriculture is linked with around 42% of land use activities in European floodplains (EEA, 2019c). Given the lack of EU-wide data availability on the full extent of hydromorphological pressures caused by agriculture, the share of agricultural land in floodplains can be used as a proxy indicator for such pressures. This assumes that the larger the share of arable land and permanent crops in the floodplain, the more an area is likely to be affected by hydromorphological pressures from agriculture, but it does not specify which pressures.
Map 3.3 illustrates that in most functional elementary catchments, the share of agriculture land in floodplains is substantial, especially in lowland areas (medium to high intensity of proxy indicator). The share of agricultural land in flood-prone areas is lower in mountainous regions such as large parts of Scandinavia and the Alps (very low to low intensity of proxy indicator).
3.4 Linking pressures and land use systems
For a continental overview of agricultural production and pressures, data on farming systems, agricultural production levels and agricultural pressures were aggregated at the level of more than 30.000 functional elemental catchments in Europe . Four agricultural pressures were considered: nitrogen surplus, pesticide toxicity, water abstraction for irrigation, agricultural land use in the floodplain (Map 3.1, Map 3.2, Map 3.3, and Map 3.4). This allowed for defining 15 large-scale landscape units of similar agricultural land use and pressures, the so-called “Broad European Agricultural Regions” (BEARs; Schürings et al., unpublished) .
The 15 BEARs consider the four major agricultural regions and distinguish between different farming systems (see chapter2.3). They relate to the dominant agricultural system in the catchment and are characterized by mean levels of agricultural pressures and production, summarised across all catchments belonging to a BEAR. The BEARs show distinct coverage and distribution patterns across Europe: The largest BEAR, for instance, comprises 'Extensive grassland area and fallow farmland’, which is assigned to 25% of the catchments dominated by agriculture (Figure 3.7). With 17% of the catchments the BEAR 'Western intensive cropland’ covers the second largest area. All other BEARs comprise less than 10% of catchments each.
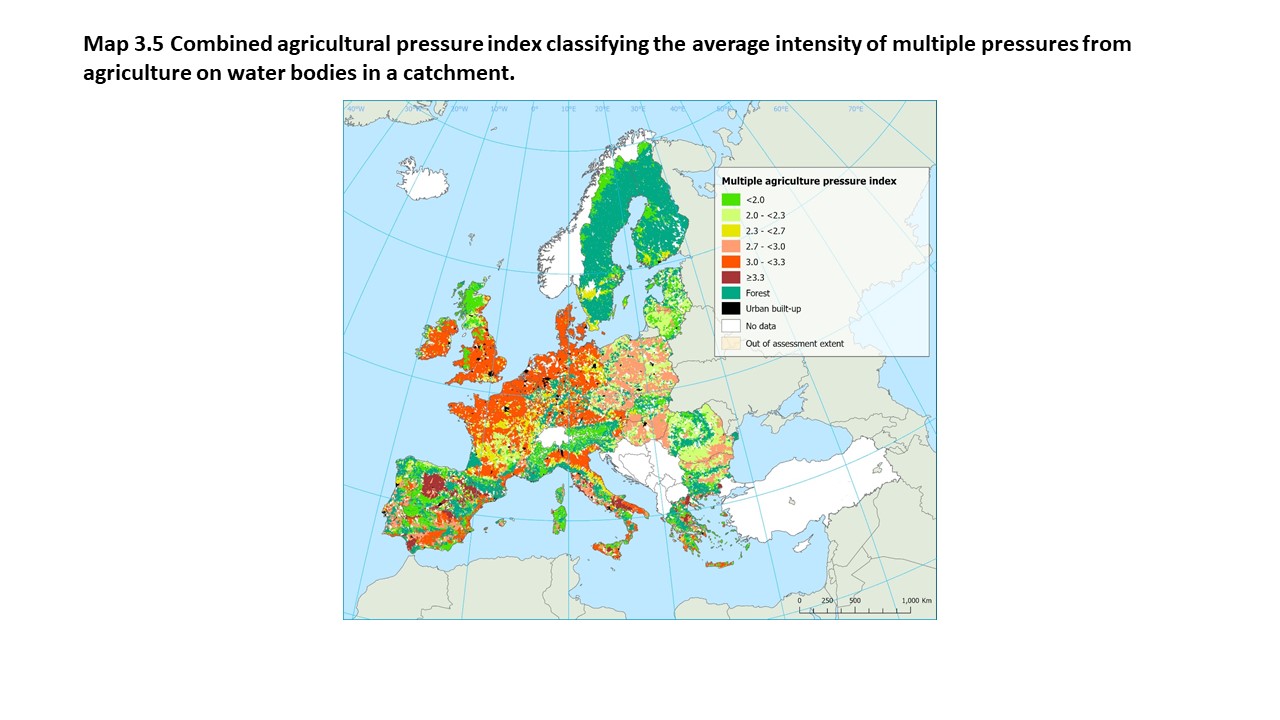
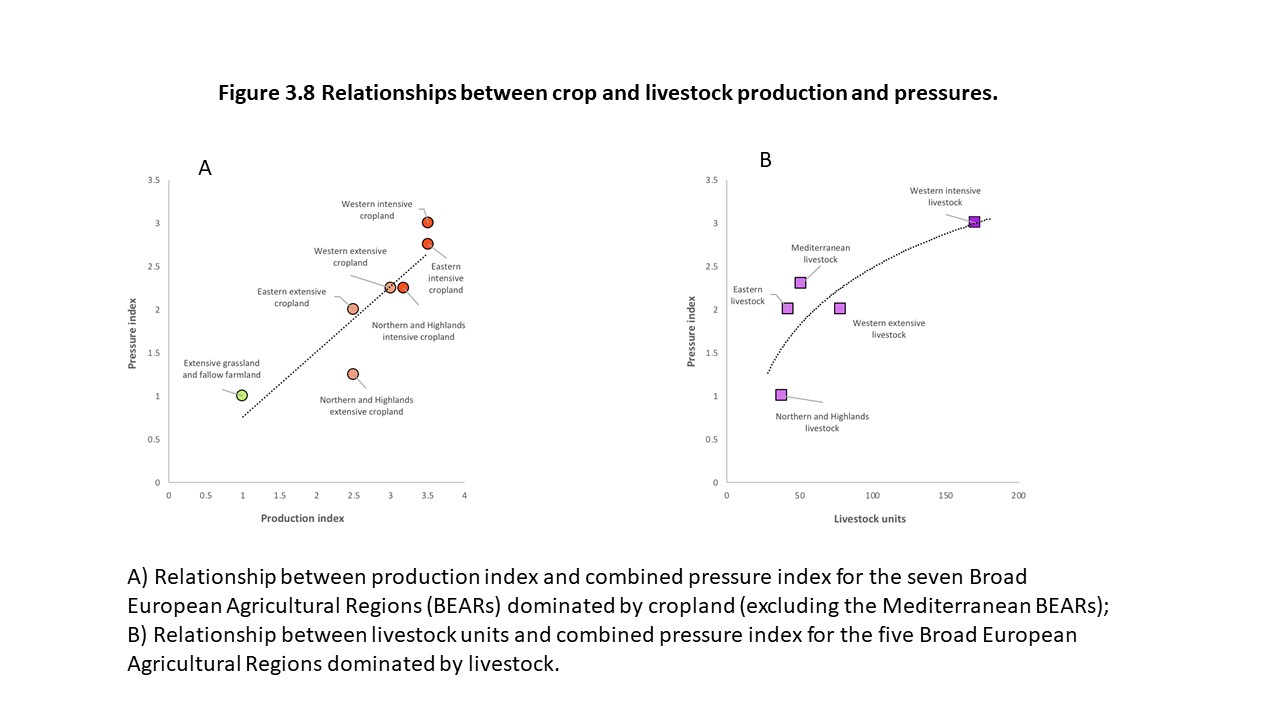
The mean levels of agricultural pressures and production per BEAR allow for calculating cumulative pressure and production indices. For the pressure index, the mean intensities of the four pressures within each BEAR were ranked and their rank-sums were averaged per BEAR. The resulting multiple agricultural pressure index is shown in Map 3.5. For the production index, the mean yields of six common crops within each BEAR were also ranked and their rank-sums were averaged per BEAR. Both indices illustrate positive relationships between agricultural yields and multiple pressures from agriculture, with farming systems of different management intensities well distinguishable across the gradient (Figure 3.8). Similar patterns are discernible for livestock density and multiple pressures across the five livestock-BEARs (Figure 3.8).
3.5 Water, agricultural pressures, and climate change
3.5.1 Impacts of climate change on agricultural pressures on the water environment
Climate change will impact both climatological conditions across Europe (see Introduction) and the productivity of agriculture across Europe (see Chapter 2.1.4). Here, the impacts of climate change on agricultural pressures on the water environment is examined. Complex dynamics are expected between climate conditions, the hydrological cycle and agricultural production. Recent studies indicate that these dynamics will broadly follow different trends between southern and northern Europe. They are examined in turn below.
Southern Europe
Figure 3.9 presents the changes in agricultural pressures on water expected for Southern Europe in the short term, if no transformative adaptation in the agriculture takes place.
Increases in temperature will lead to increased evapotranspiration rates, thereby increasing crop water requirements in Southern Europe (EEA, 2019a). This increased water demand will be amplified by more water and nutrients for the same agricultural area and crop in order to maintain crop productivity. This can be explained by the fact that on one hand more water and nutrients are needed to stimulate the longer growth cycle and additional water is needed to secure uptake of nutrients.
Crops that have been rainfed so far will change to needing more water for irrigation (EEA, 2019a). This additional crop water demands will increase water storage demands, lower eflows, or unsustainable groundwater abstraction (EEA, 2018d) impacting hydromorphology of surface waters and ecological status of surface and groundwater status. Overall, it is important to note that the use conflicts of water within the agricultural sector (between farmers) and between sectors (e.g. shipping, energy) are expected to increase.
On the other side most of the processes responsible for soil degradation, including soil organic matter mineralization and erosion, are enhanced by higher temperature and more intense precipitation (Balkovič et al., 2018). Furthermore, the increased temperature can lead to new/increased pests, demanding more pesticides (Lavalle et al., 2009). As stated above this might increase water pollution leading to not meeting good ecological status or deteriorating status further.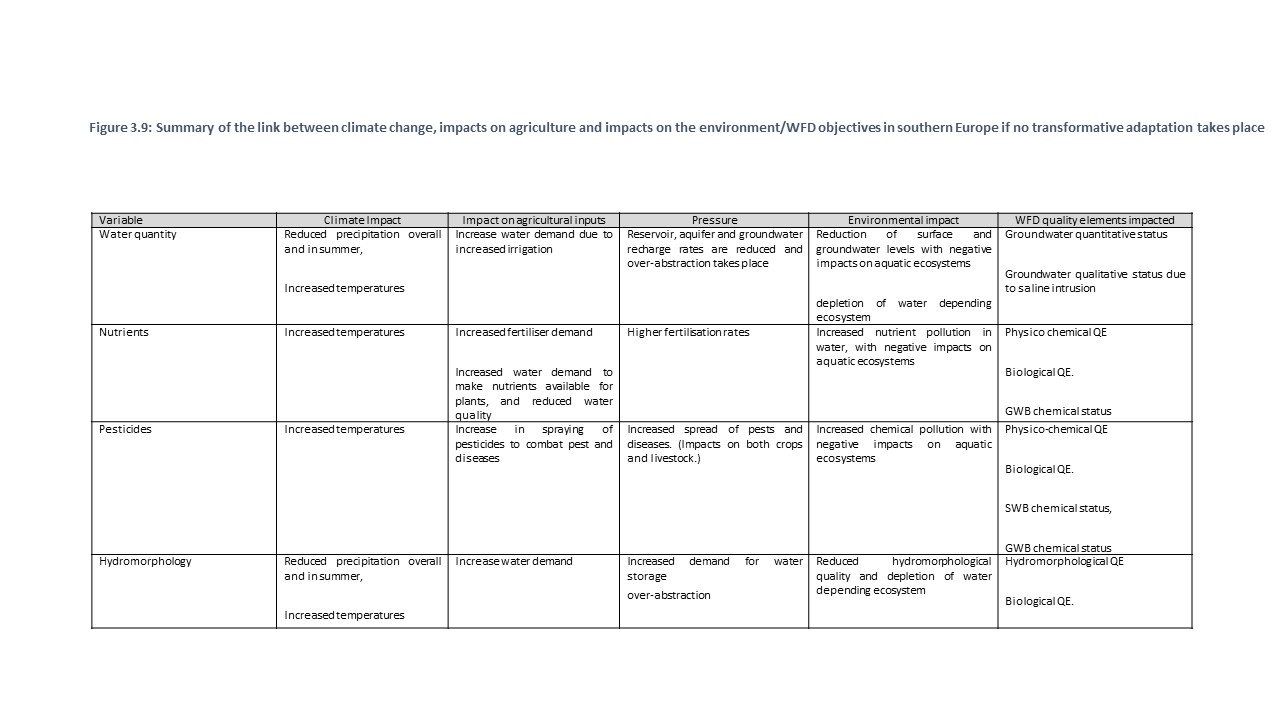
Northern Europe
Figure 3.10 presents the changes in agricultural pressures on water expected for Northern Europe. Climate change is projected to improve the suitability for growing crops in Northern Europe as a result of a lengthened of the growing season and a decreasing of cold effects on growth (EEA, 2019a). The increased growing season for crops and grasslands may boost livestock system production in northern Europe (Rojas-Downing et al., 2017), leading to changes in the distribution of pathogens and pathogen vectors present challenges. The projected increase in rainfall may pose challenges for grazing livestock and grass harvesting owing to the accessibility of land and declining soil fertility through soil compaction. Depending on the areas available, increased livestock might result in areas with high surplus of nitrogen resulting in lower groundwater quality.
Increased precipitation can lead to increased pressure to drain agricultural land and increase conductivity of streams and rivers, increasing hydromorphological pressures, and reducing ecological status (Abdelbaki, 2015). Also increased precipitation and flooding may lead to increased fertiliser and pesticide pollution due to greater run-off, and reduce capacity for winter crops designed to secure continued nutrient uptake and reduce erosion. Furthermore, the increased temperature can lead to new/increased pests, demanding more pesticides (Lavalle et al., 2009). This could decrease ecological status in surface and chemical status in surface and ground waters.
In some areas in northern Europe the increasing drought risks might require that crops that have been rainfed can change to needing water from irrigation (Feyen et al., 2020). This is expected to have negative impacts on ground water bodies.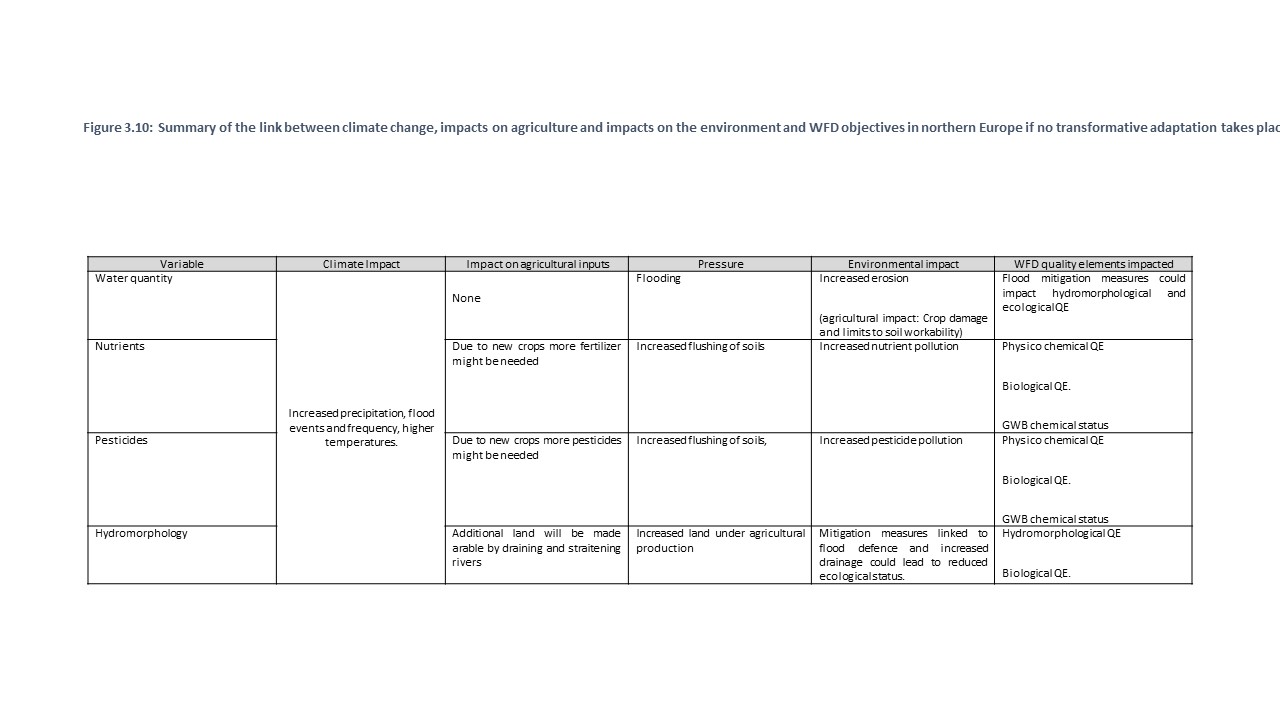
3.5.1 Impacts of climate change on European agriculture and water from a global perspective
Further climate change will affect the distribution of agricultural production on the global level as well and, therefore, food supply and global markets (Porfirio et al., 2018). Even if there are high uncertainties on how global markets will develop there is a common understanding that production patterns will change having also impacts on the EU production (FAO, 2018b).
A cascade of impacts from climate change to agro-ecosystems and crop production, with effects on price, quantity, and quality of the products, and consequently on trade patterns is expected to impact agricultural income in Europe. In the future, the economic value of European farmland may significantly change due to a combination of these cascading impacts. Agriculture intensification could take place in northern and Western Europe, while in southern Europe and especially the Mediterranean a reduction in the relative profitability of agriculture could result in land extensification and abandonment. There will also be areas where the agricultural sector will have losses as the water supply for human consumption will have the highest priority not allowing enough water for irrigation (Godot, 2013), but also to secure e-flows. In such cases, a balance between environmental, social, and economic goals needs to be found (GWP, 2019).
The overall impacts of climate change on European agriculture could produce an important loss for the sector, however with large regional differences. For example, farmers might be adversely affected if a drought damages their crops. They may spend more money due to increasing irrigation costs, drilling new wells, or feeding and providing water for their animals. Industries linked with farming activities, such as companies that make tractors and food, may lose business when drought damages crops or livestock (Cammalleri et al., 2020).
The sector will need to further adapt to these changes to secure sustainable agricultural production. Farm-level adaptation can reduce losses caused by extreme events, but knowledge on all the impacts of climate change on agriculture is still limited, especially when impacts are multiplied or combined with other social-economic consequences of climate change (EEA, 2019a).
EU production could still slightly increase due to the interplay of different market forces. This is because the negative effects in Europe are projected to be lower compared to the other world regions. This provides the EU with a comparative advantage in terms of climate change impacts on agricultural productivity, which could positively affect its competitiveness (Feyen et al., 2020).
On the global level, climate change threatens agricultural production in all parts of the world. Impacts on regional yields can be substantial even in the early decades. The magnitude and exact projected location are nevertheless subject to uncertainty from climate and crop models as well as internal climate variability (Wallach et al., 2015). The long-term yield impacts of climate change more clearly emerge from variability in the middle and end of the 21st century, with considerable variation across regions, and with maize and wheat systems generally more vulnerable than rice and soy (Rosenzweig et al., 2014).
These changes, but also changes in food demand due to a growing global populations and changes in diet are expected to alter the geographic extent of major farm systems, shift trade flows, and drive major investment