
Post a comment on the text below
Figure 2a. Groundwater level changes in European countries over the period 2000-2019
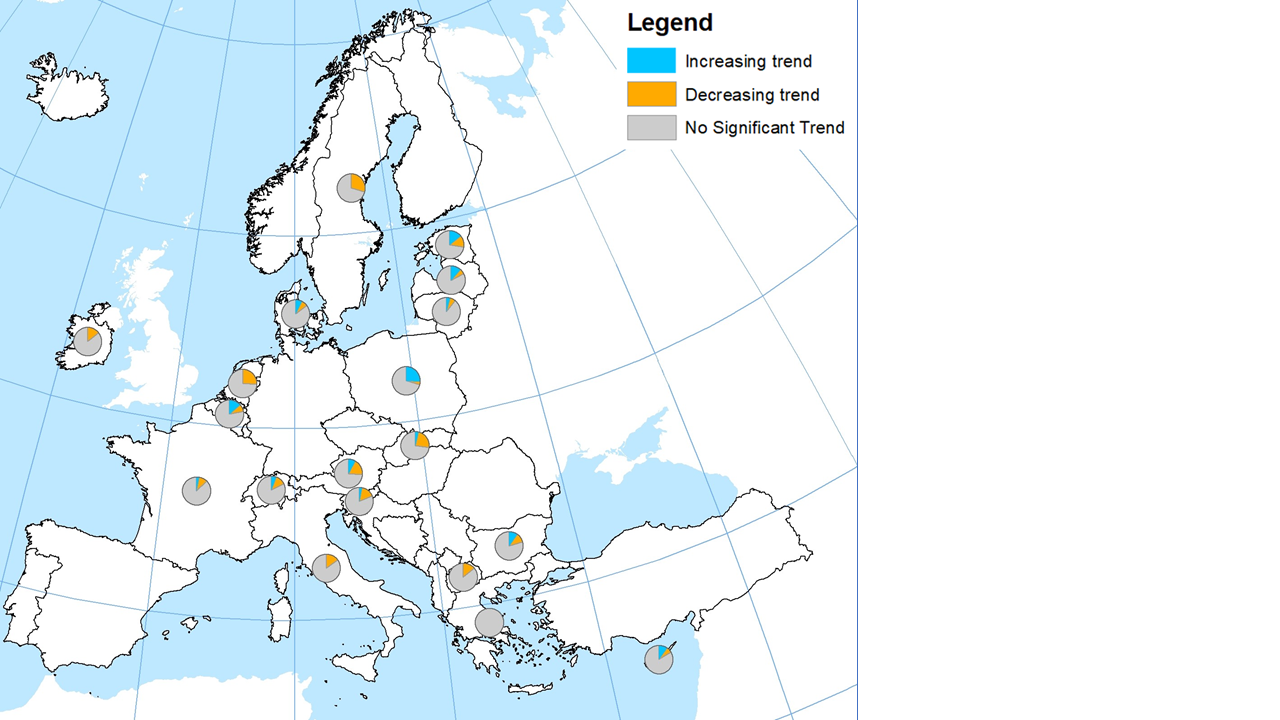
Note: Numbers in brackets in the text of this note indicate the number of monitoring stations where data are available for trend analysis. Geographical coverage (UN M49 standard): Eastern Europe – Bulgaria (116), Poland (792), Slovakia (26); Northern Europe: Denmark (524), Estonia (212), Ireland (7), Lithuania (47), Latvia (268), Sweden (64); Southern Europe: Cyprus (31), Greece (1), Italy (301), North Macedonia (7), Slovenia (32); Western Europe: Austria (114), Belgium (90), Switzerland (34), France (1214), Netherlands (27). Decreasing groundwater level trends (orange) range between - 0.01 metres per year and more than - 2 metres per year; Increasing groundwater levels trends (blue) range between +0.01 metres per year and more than +2 metres per year.
You cannot post comments to this consultation because you are not authenticated. Please log in.
Previous comments
Comment from AT
Pie charts give good overview. But... see comments above:
Thank you for your comment.
For the first part, please refer to response provided above.
The number of sites are added in the note section of the figure. In addition, Greece was removed from the indicator assessment (see resonse to previous comment)
POLAND
It should be recalculated with using the same units.
Thank you for your comment. Please refer to response provided above.