
Navigation
Notifications
Post a comment on the text below
Figure 2b. Groundwater level changes at monitoring locations in European countries over the period 2000-2019
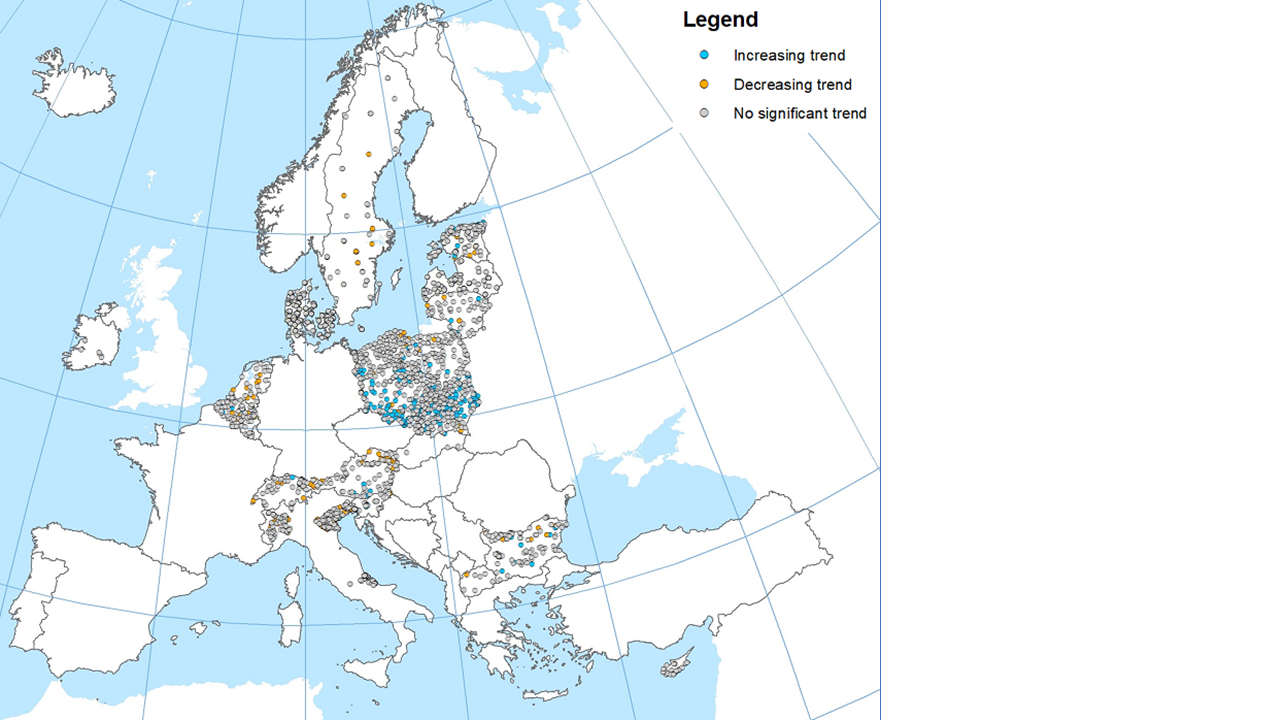
Note: Decreasing groundwater level trends (orange) range between -0.01 metres per year and more than -2 metres per year; Increasing groundwater levels trends (blue) range between +0.01 metres per year and more than +2 metres per year.
You cannot post comments to this consultation because you are not authenticated. Please log in.
Previous comments
Comment from AT
see comments above.
What about France?
Thank you for your comment. Please refer to response provided above.
Monitoring stations in France have a the confidentiality remark in the WISE database. For station with such confidentiality remark, locations, groundwater level data, and groundwater level trends will not be shown in maps. However, these monitoring locations are used at aggregated level assessments and visualisations. This information is added to the “supporting information” (methodology).
POLAND
It should be recalculated with using the same units.
Thank you for your comment. “m + sea level” means “meter below sea level”. We adjeusted this text to example graphs of the pop-up window to “(m)”, which is more commonly used in literature.