
Post a comment on the text below
Figure 2 (main view). Affordability of water supply and sanitation services (relative to other household needs) over the period 2005-2019. [indicative data view for medium income households in Lithuania].
NOTE: Final scale and structure of illustrating the information on affordability will be decided at the later stages in accordance with capability of EEA IT infrastrucure
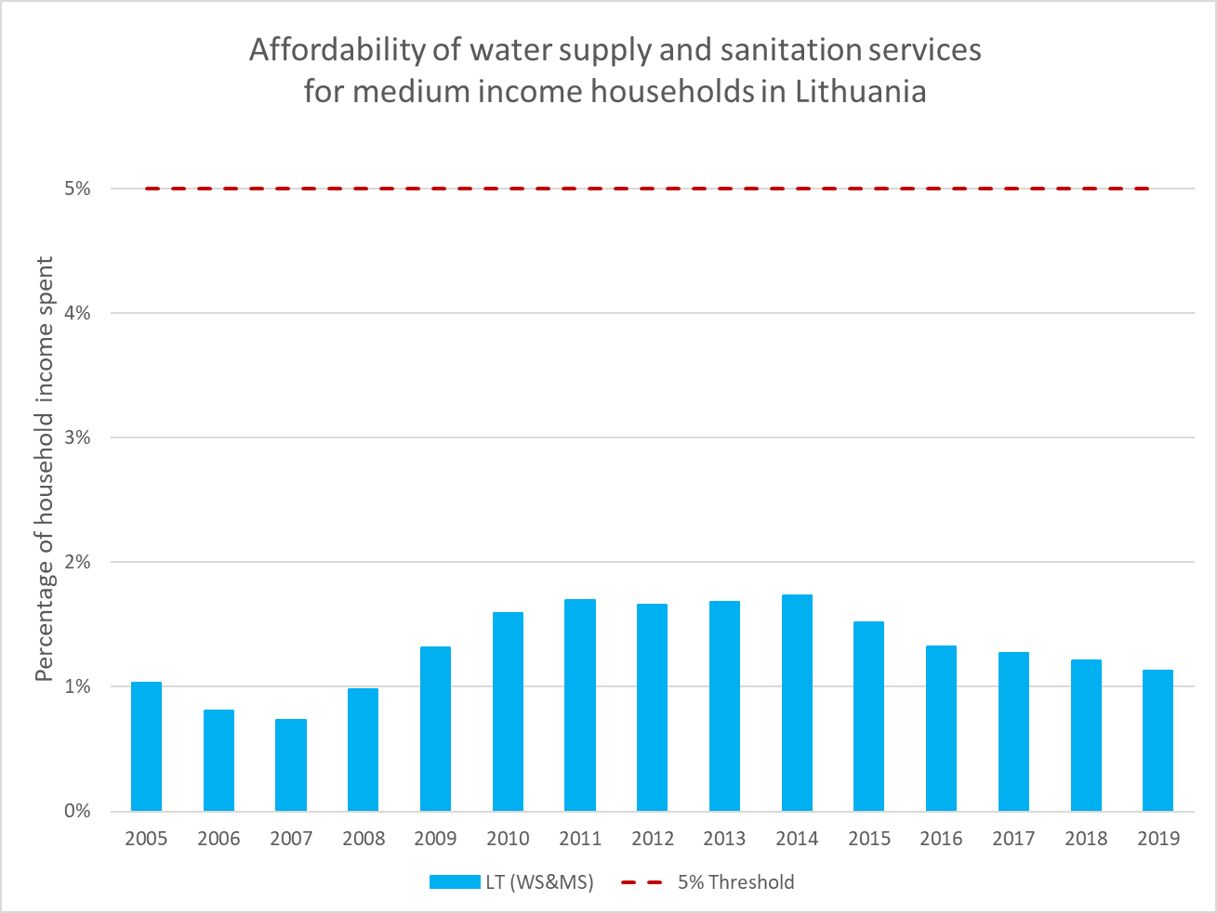
Data source: Eurostat (Final consumption expenditure of households by consumption purpose (COICOP 3 digit) [NAMA_10_CO3_P3__custom_1306597]; Number of private households by household composition, number of children and age of youngest child [lfst_hhnhtych]; Average household size - EU-SILC survey [ilc_lvph01]; Mean and median income by household type - EU-SILC and ECHP surveys [ilc_di04]; and Distribution of income by quantiles - EU-SILC and ECHP surveys [ilc_di01].
You cannot post comments to this consultation because you are not authenticated. Please log in.
Previous comments
I've had a look at the Excel table. I don't understand how this affordability indicator has been calculated. Could this be explained more clearly in the text?
In the coming weeks, we will share with you the original file in which all calculation can be followed transparently.
How does the graph fit to the statement on the first page … it’s a high share of ….
Would be good to explain WS&MS in the Legend (LT (WS&MS)