
Navigation
Notifications
Post a comment on the text below
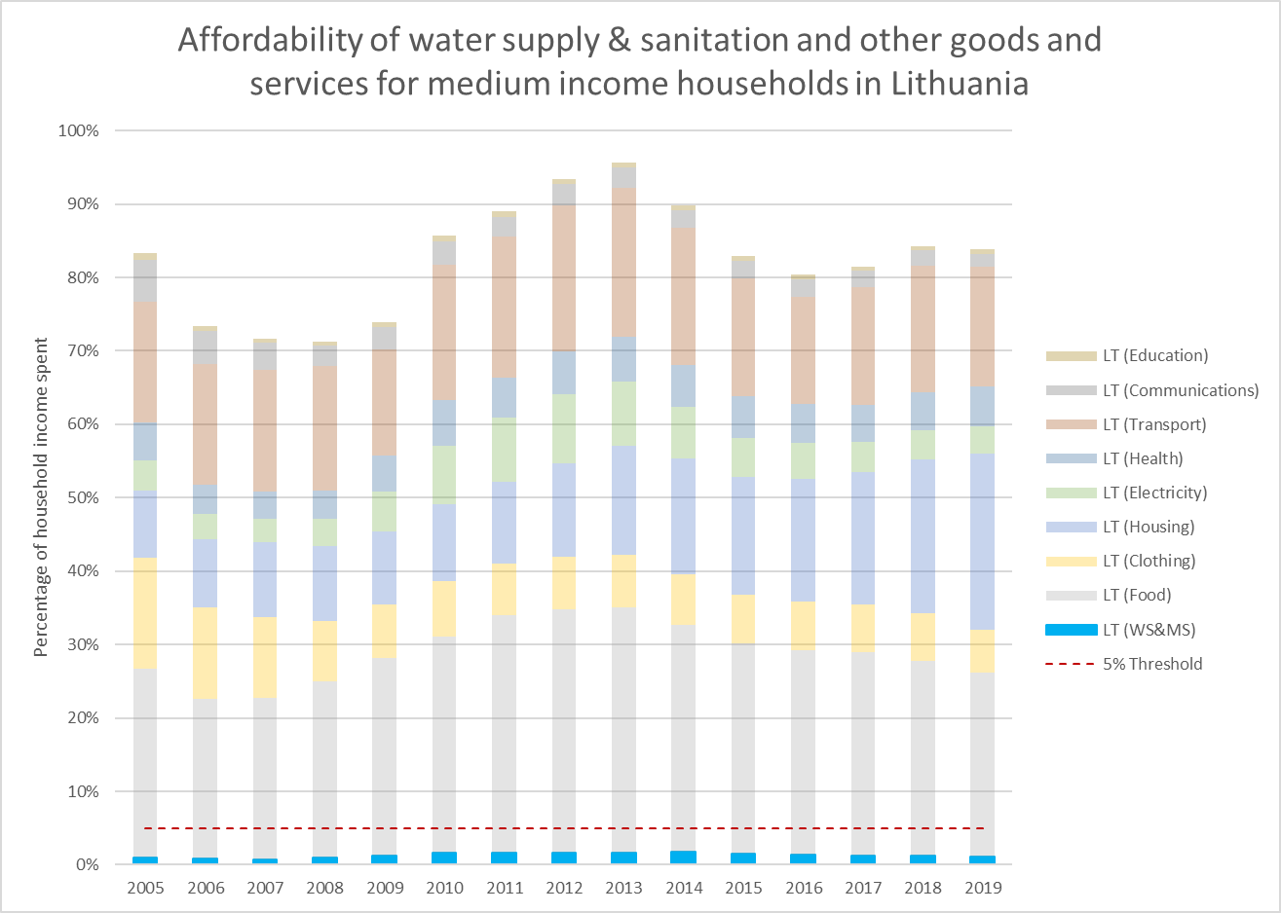
Additional tab- for a view of the relative burden of water services on household income against other household needs
You cannot post comments to this consultation because you are not authenticated. Please log in.
Previous comments
As stated in the beginning of this document: Data are incomparable across countries. So we are looking here at numbers that are completely incoparable. But by puting them in one graph, it is suggested that they are comparable, and also people looking at this report and this graph will tend to compare accross countries. Be clear what we are looking at and whether we can compare those data or not. If the data are incomparable, then one should not put them in a way that invites people to compare them...
We show one MS across time; not multiple MS in the same graph. So we tries to technically avoid this direct cross-comparison. However, we acknowledge the natural perception of the end user on this chart. Nevertheless, as outcomes of the EIONET consultation, EEA has decided to omit the affordability component of the indicator
fifth percentile income data?