
Navigation
Notifications
Post a comment on the text below
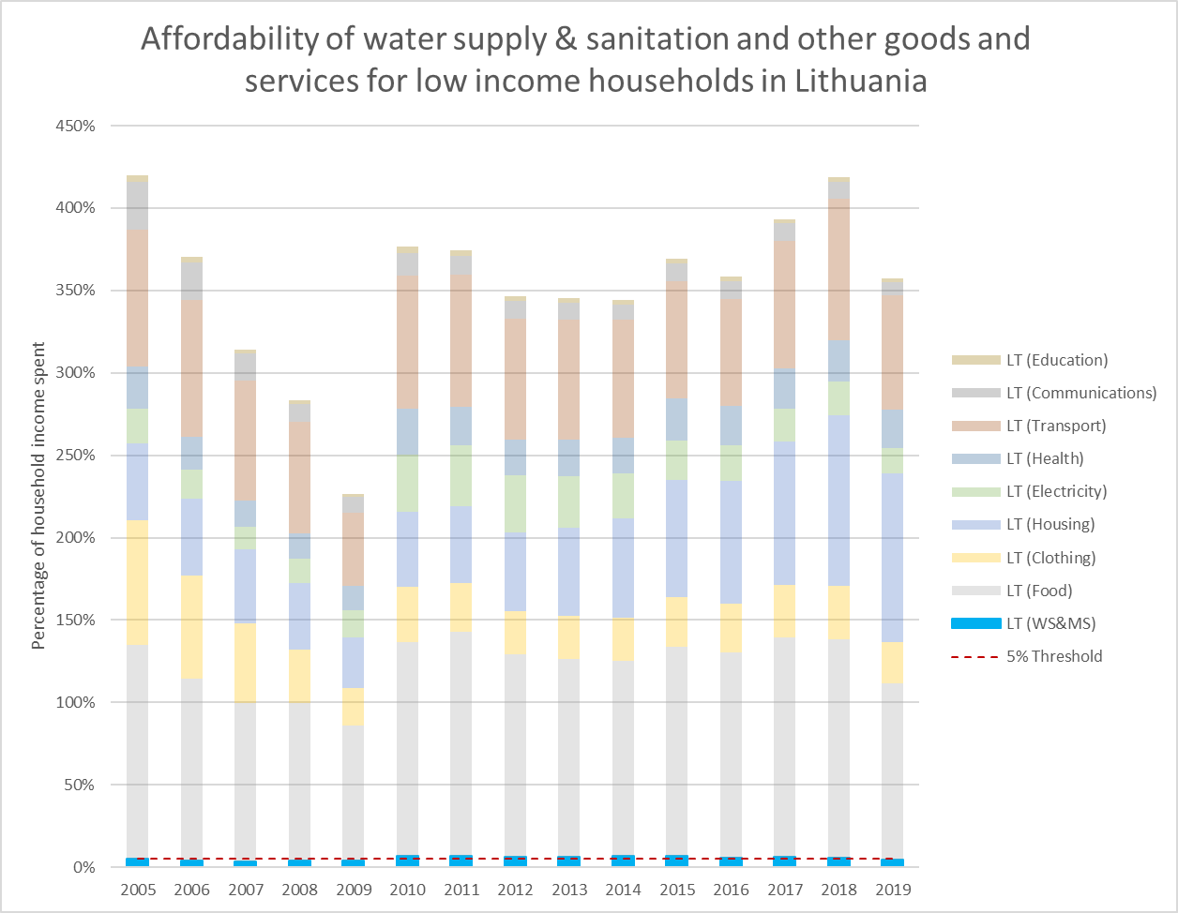
Additional tab- relative burden of water services on household income against other household needs
You cannot post comments to this consultation because you are not authenticated. Please log in.
Previous comments
The y-axis says that a low income household in Lithuania spends about 4-times of its income on household needs? How does that work?
Sorry I do not understand the description of the methodology in chapter to understand why the % (in y-axis) can be larger than 100%. Maybe an example in chapter 2 would be great.
This is explained in the Accuracy and Uncertainty section. The only available dataset on household expenditure is for average households and not for low-income ones. The data is aggregated from surveys and averaged, so it is not the actual expenditure of each single household in the country. However, the technical team considered it useful to indicate how far that segment of society is from being able to afford the standard of life (in terms of expenditure) of average households.