
Table of contents
1 - Indicator text and figures
Summary
Nutrient conditions in European surface waters have improved in recent decades. The average nitrate and phosphate concentrations in rivers and total phosphorus concentration in lakes have decreased. The decrease in nutrient concentrations is likely related to improvements in waste water treatment, the reduction of phosphorus in detergents and measures reducing agricultural inputs. There is a tendency for concentrations to level off in recent years, especially for rivers. There has been no overall decrease in the nitrate concentration in groundwater.
Additional information, figure 1
The geographical coverage is the 38 EEA member countries, but only complete time series are included in the analysis. The selected time series are aggregated to European level by averaging across all sites for each year.
Two time series are shown – a longer time series representing fewer water bodies and a shorter time series representing more water bodies.
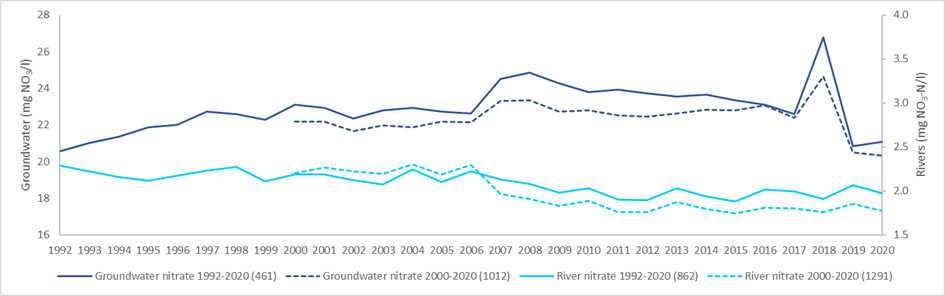
Upper chart:
Nitrate in groundwater: The number of groundwater bodies included per country is given in parenthesis:
1992-2020: Europe (461), Austria (13), Belgium (24), Bulgaria (25), Denmark (1), Estonia (16), Finland** (7), France (247), Germany (66), Ireland (50), Portugal (2), Slovakia (4), Slovenia (5), Spain (1).
2000-2020: Europe (1012), Austria (14), Belgium (37), Bulgaria (40), Cyprus (6), Czechia (64), Denmark (4), Estonia (18), Finland** (8), France (437), Germany (175), Ireland (66), Italy (10), Latvia (15), Malta (2), Portugal (10), Serbia (21), Slovakia (16), Slovenia (6), Spain (26), Switzerland (37).
Nitrate in rivers: The number of river monitoring sites included per country is given in parenthesis:
1992-2020: Europe (862), Albania (3), Austria (39), Belgium (26), Czechia (22), Denmark* (37), Estonia (34), Finland** (61), France** (184), Germany (119), Ireland** (4), Latvia (13), Lithuania (22), Poland (13), Slovakia (8), Slovenia (7), Spain** (153), Sweden* (111), Switzerland (6).
2000-2020: Europe (1291), Albania (7), Austria (41), Belgium (34), Cyprus (14), Czechia (22), Denmark* (38), Estonia (36), Finland** (70), France** (241), Germany (122), Iceland (1), Ireland** (50), Italy (25), Latvia (16), Lithuania (22), North Macedonia (18), Poland (16), Romania (89), Serbia (34), Slovakia (8), Slovenia (8), Spain** (250), Sweden* (113), Switzerland (16).
(* = all data total oxidised nitrogen, ** = some data total oxidised nitrogen)"
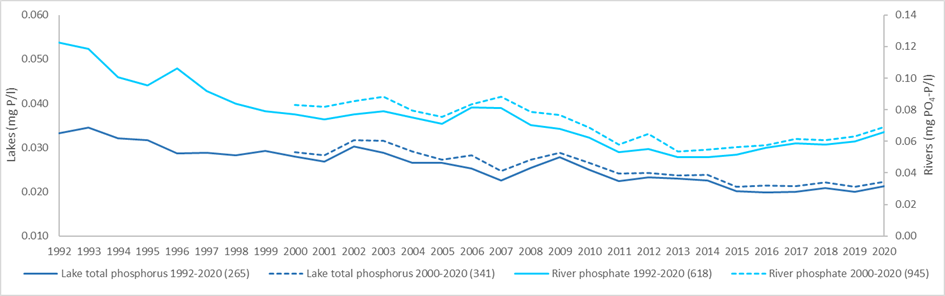
Lower chart:
Phosphate in rivers: The number of river monitoring sites included per country is given in parenthesis:
1992-2020: Europe (618), Austria (27), Belgium (24), Bulgaria (32), Czechia (10), Denmark (39), Estonia (35), Finland (60), France (166), Ireland (4), Latvia (13), Lithuania (22), Norway (21), Slovakia (6), Slovenia (9), Spain (33), Sweden (111), Switzerland (6).
2000-2020: Europe (945), Albania (3), Austria (41), Belgium (28), Bulgaria (53), Croatia (23), Czechia (10), Denmark (40), Estonia (37), Finland (67), France (240), Iceland (1), Ireland (11), Italy (18), Latvia (16), Lithuania (22), Norway (21), Romania (88), Serbia (34), Slovakia (6), Slovenia (10), Spain (47), Sweden (113), Switzerland (16).
Total phosphorus in lakes: The number of lake monitoring sites included per country is given in parenthesis:
1992-2020: Europe (265), Austria (5), Denmark (5), Estonia (7), Finland (144), Germany (2), Lithuania (2), Netherlands (6), Norway (2), Slovenia (2), Sweden (90).
2000-2020: Europe (341), Austria (27), Belgium (1), Bulgaria (1), Croatia (3), Denmark (5), Estonia (8), Finland (168), France (1), Germany (6), Lithuania (3), Netherlands (6), Norway (3), Poland (9), Serbia (3), Slovenia (3), Sweden (95).
-
DK - Nitrate in groundwater. We cannn't understand that there only is 1 groundwater body with data for the period 1992-2020 and 4 for groundwater body with data for the period 2000-2020.
Looking at the reporting to the nitrate directive we have about 400 groundwater monitoring stations that have been active since c. 1990. These data have been reported over the years.
We can address two issues that can cause problems for the time series:
- there have been more generations of broundwater bodies - new at each six years reporting period of the WFD
- At the latest reporting of monitoring stations, the station identifier is sligthly changes from the format DKxxx-xxxx-0[1-9] to DKxxx-xxxx-[1-9].
Thus with this in mind there should still be more stations that the very few ones you get.
Please, contact us, so that we can sort this out.
Assessment
Nitrate in groundwater
The average nitrate concentration in European groundwater has been stable since 1992. The shorter, but more representative time series from 2000 follows the longer one closely, but the concentration level is slightly lower. The lack of a marked trend at European level does not imply limited changes in groundwater nitrate concentrations overall, but rather that the number of groundwater bodies (GWBs) with increasing and decreasing trends is similar.
Nitrate in rivers
The average river nitrate concentration in Europe decreased steadily over the period 1992-2009 but has levelled off since then. The shorter time series is parallel to the longer one, but the concentration level is lower from 2007 onwards. Agriculture remains the main contributor to nitrogen pollution, but the EU Nitrates Directive and national measures have contributed lower concentrations. However, the apparent stabilisation in recent years may call for further measures to be taken.
See chart for nitrate in groundwater and rivers here.
Phosphate in rivers
The average phosphate concentration in European rivers more than halved over the period 1992-2012. The marked decline is also evident for the shorter time series, but the average concentration is somewhat higher when using this larger set of sites. Concentrations tend to level off and even increase at the end of the period. The decrease in river phosphate can be related to measures introduced by national and European legislations, e.g. the Urban Waste Water Treatment Directive. Also, the change to phosphate-free detergents has contributed to lower phosphate concentrations.
Total phosphorus in lakes
There has been a gradual reduction in average total phosphorus concentrations in European lakes since 1992. The concentration level is higher for the shorter, more representative time series. As the treatment of urban waste water has improved, the amount of phosphorus in detergents has been reduced, and many waste water outlets have been diverted away from lakes, phosphorus from point sources has become less significant. However, diffuse runoff from agricultural land continues to be a major phosphorus source in European lakes. Moreover, phosphorus stored in sediment can keep lake concentrations high despite a reduction in inputs.
See chart for phosphorus in rivers and lakes here.
Notes, figure 2:
Kosovo* refers to Kosovo under UNSC Resolution 1244/99.
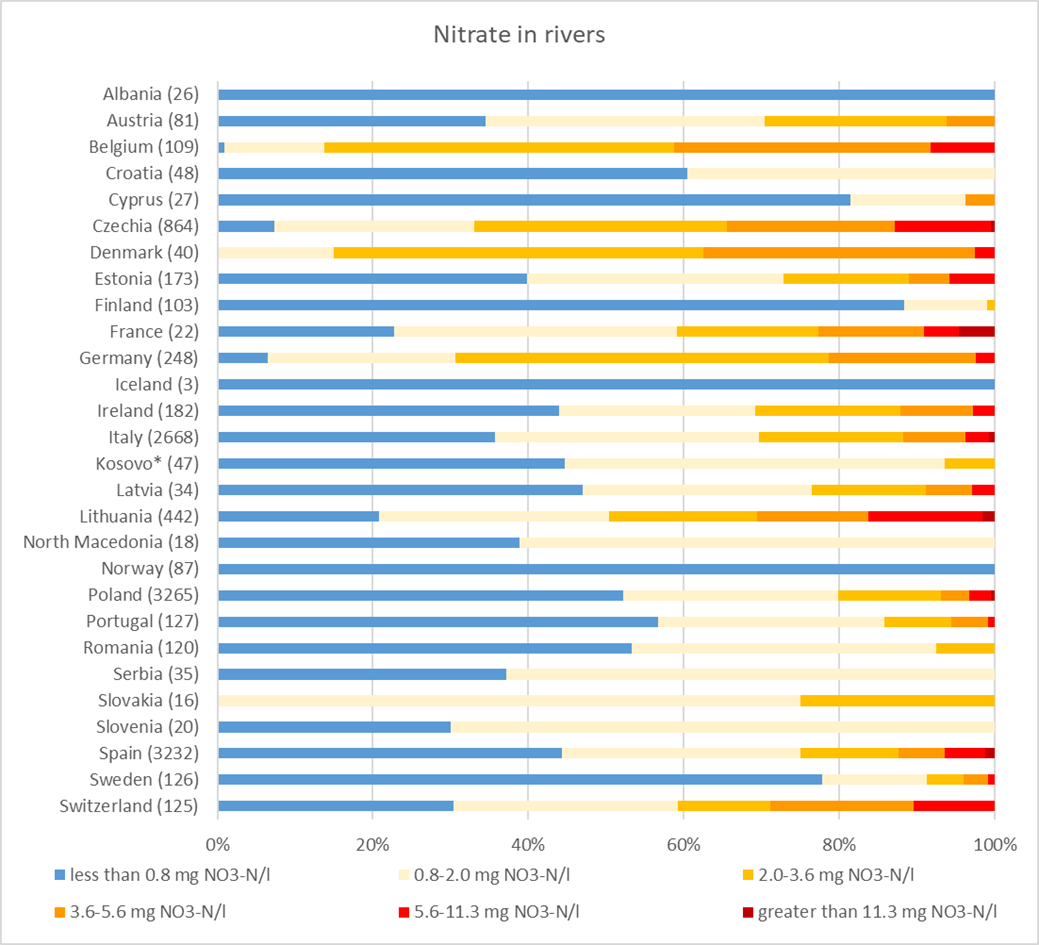
The current concentration per river site is calculated as the average of available annual mean concentrations for the years 2018-2020. Concentrations are in mg nitrate-nitrogen per litre (mg NO3-N/l).
The river sites are assigned to different concentration classes to visualise the distribution of data in the dataset. 11.3 mg NO3-N/l corresponds to the maximum allowable concentration for nitrate of 50 mg/l in the Drinking Water Directive (2020/2184). The number of river sites per country is given in parenthesis.
-
PT - In the document it is not clear how the classes in figure 2 were established.
For a quicker analysis the units should be the same of the Directives, i.e. Nitrates Directive in mg/l NO3.
Disaggregate level assessment
Rivers that drain land with intense agriculture or a high population density generally have the highest nitrate concentrations. In the period 2018-2020 (link to chart from 2021 indicator assessment), Czechia and Lithuania had the largest proportion of river sites with average nitrate concentrations exceeding 5.6 mg NO3-N/l (13% and 16%, respectively). Moreover, Belgium, Denmark, and Switzerland had a high proportion (more than 25%) of sites with concentrations exceeding 3.6 mg NO3-N/l.
There has been a decrease in river nitrate concentrations at 47% of the monitoring sites since 1992, and an increase at 16% of the sites (Figure 1). Czechia, Denmark, Germany and Slovakia had the highest proportion of significantly decreasing trends (63-100%). France, Ireland, Spain and Switzerland had similar proportions of significantly increasing and decreasing trends, while Estonia had the highest proportion of significantly increasing trends (44%). An overall decline, although slowing in recent years, is observed for Austria, Belgium, Czechia, Denmark, Germany, Serbia and Sweden, contributing to the pattern seen in the European time series.
-
PT- It is not clear from the text where the thresholds 5.6 mg NO3-N/l and 3.6 mg NO3-N/l come from.
PT - Nitrates in groundwater 1992-2020: We don't understand why there is only two GWB for PT. At the "20220815_present_state_2022_v1_CSI020" file you used 75 GWB.
Nitrates in groundwater 2000-2020: We don't understand why you included only 10 GWB. At the "20220815_present_state_2022_v1_CSI020" file you used 75 GWB.
Regarding nitrate in rivers Portugal reported data for the period 2010-2020.
It is considered that there should be reference to the Member States that reported data even with shorter series.
Regarding total phosphorus in lakes Portugal reported data for the period 2010-2020.
We would like to highlight that in mainland of Portugal there are no lakes but reservoirs. Consequently the water quality is different.