
Post a comment on the text below
Based on E-PRTR data, one possible assessment is shown in Figure 4.4. Because of the high aggregation (e.g. mean value of each years, measurement of effluent concentration etc.) loads of Diuron gives hardly any trend over the time period from 10 years. In Belgium, loads under consideration of the used data, are much higher than in the other selected countries. Additionally, one should have in mind, that emissions from diffuse sources and smaller facilities are not counted in E-PRTR.
Figure 4.4 Trend of Diuron loads (kg/a) from waste water treatment plants in EU Member States
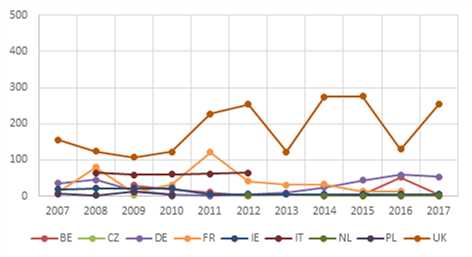
Note: Example of total discharges into water by countries over 10 years (based on raw data)
Source: E-PRTR v.16 (https://prtr.eea.europa.eu/)
You cannot post comments to this consultation because you are not authenticated. Please log in.
Previous comments
kg/a - what does this mean?
Perhaps explain why the load is so high in Belgium relative to other MS?