Table of contents
4. Status of information on pesticides
4.1. Assessments and results of quantitative data sources
4.1.1. Waterbase - Water quality
4.1.1.1. Pesticides in surface waters
Based on the above explained methods (see section 3.1.1.), Table 4.1 shows the specific substances reported under Waterbase – Water Quality with the highest rate of exceedances ordered in usage groups. The EQS for each substance used for the calculation of the exceedance rate are listed in Annex 6.
The total number of records within the group of herbicides in the time period 2007 – 2017 is 157 341, and the substance with the most exceedance rate is Glyphosate (15.6%) even though the number of records is relatively low (6 257). With some 20 000 records, Trifluralin and Diuron, which are listed as a priority substance under WFD, show less exceedance rates with 2.2 and 1.0%. Four substances show exceedance rate >5% (Table 4.1).
Insecticides include a total of 69 different substances. The number of records of the listed 17 substances with the highest exceedance rate is 116 358 (out of some 500 000 records), whereas Heptachlor and alpha-Endosulfan have the highest records in the given time period. Nine substances show exceedance rates >10% (Malathion, Heptachlor, Dichlorvos, Heptachlor epoxide, Imidacloprid, Cypermethrin, Fenitrothion, Parathion, Dicofol). 16 out of 69 substances show an exceedance rate of >5%.
Only 19 substances are listed under the usage group of fungicides with an overall number of records in time period 2007 – 2017 of 59,295. The mean exceedance rate of all 19 fungicides is low with 0.2% and only the substances Hexachlorobenzene and Metalaxyl have exceedance rates of more than 1%.
Table 4.1 Number of reported substances with the most reported rate of exceedances in surface waters, grouped by usage in the time period 2007 – 2017
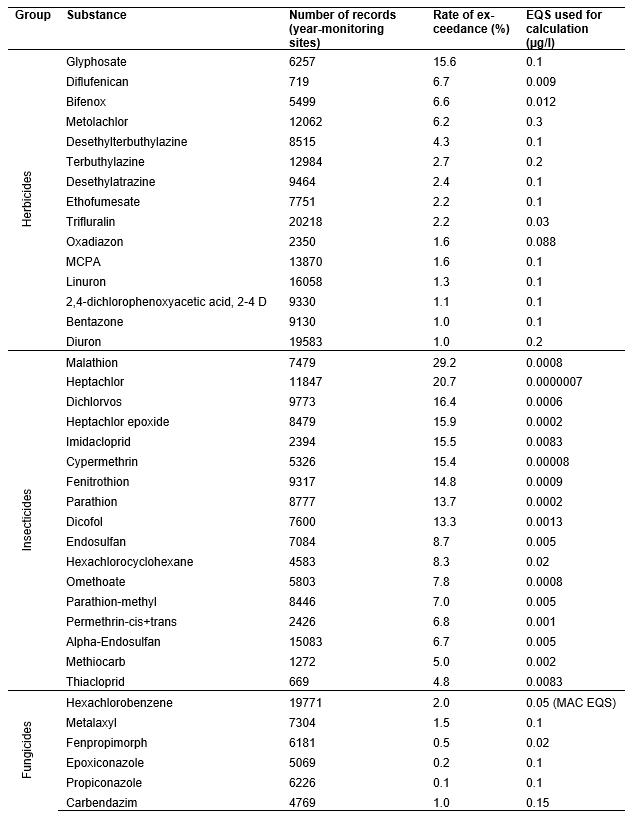
Note: The number of records for one substance is an aggregate of samples taken at one site, in one year. MAC = Maximum.
Figure 4.1 shows the rate of exceedance over the time period from 2007 to 2017 of the three groups insecticides, herbicides and fungicides. This assessment is based on the number of monitoring sites, because the effects of these three groups hamper three different aquatic organism groups. For this reason, the exceedance per year and sampling site is crucial for the assessment.
The results show highest rates of exceedances from 2007 to 2012 with a peak in 2012 by insecticides. In 2012, at some 50% of all sampled monitoring sites, exceedances seem to occur. After 2012, rate of exceedance of insecticides decreased significantly to 5% of all monitoring sites in 2017. The reason might be a bias of values lower the levels of detection (LOQ). These LOQ’s were not reported from many sites, substances or countries. So we had to detect values lower than LOQ from checks of the data (e.g. many aggregated data sets, in which we found that minimum and maximum had the same values, told us that all values were below LOQ and LOQ was reported as minimum and maximum). It might be that the rules of these checks did not catch all these values lower LOQ.
In 2009 the EQS of priority substances came into force, among them several very low EQS values for insecticides listed as priority substances. The COM decision on technical specifications for chemical analysis and monitoring set LOQ’s for the analysis method at one third of the EQS values (EC, 2009a). This requirement led to development of improved analytical methods and lower LOQ’s. It is supposed that exceedance rates during the years following 2012, when Member States were monitoring for the River Basin Management Plan reporting in 2016, might be more reliable as they would be less biased by values below the LoQ. Assessments for some insecticides with very low EQS values should therefore be on data from after 2012. The same effect might be true for fungicides. They show the lowest exceedance rates over the whole time period and since 2013, the rate of exceedance decreased to less than 1% per year. Fungicides are seldom seen as a water quality problem.
Exceedance rates of substances used as herbicides also varied over the years, but a break or linear increasing or decreasing trend is not visible. Because most herbicides have usually higher EQS in the range of the drinking water standard and a much longer analysis history, the above mentioned effect of LOQ’s are rather seldom. Since 2014 herbicides show exceedances at more monitoring stations than insecticides.
The issue of analysis results below LoQ, LoQ below EQS and missing LoQ reportings needs more investigation. It should be mentioned, that the exceedance rates of the three groups are assigned to a relatively low number of substances. This follows the fact, that usually one substance is responsible for the toxicological effect.
Figure 4.1 Rate of exceedances of the three usage groups of pesticides from 2007 to 2017 in surface waters
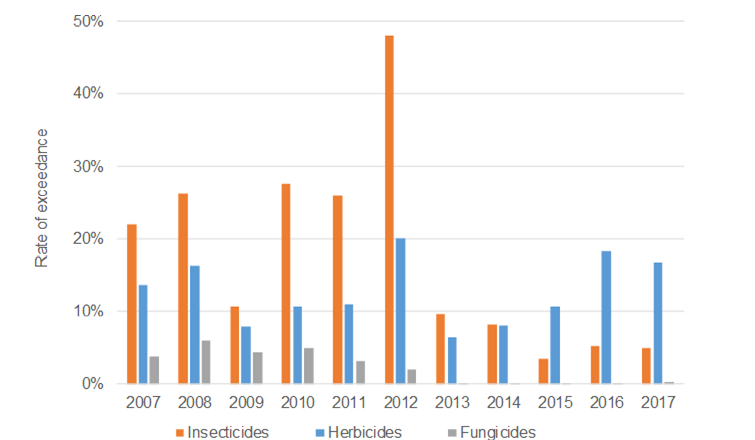
Figure 4.2 shows the result based on the grouping according to Mode of Actions (MoA). Based on the available data and the methods for the pesticide selection, only the two groups of substances showed many EQS exceedances: neurotoxic and photosynthesis inhibitors. Because neurotoxic substances are used as insecticides, and photosynthesis inhibiting pesticides are herbicides, results of MoA grouping of pesticides show nearly same amounts of exceedances as presented on pesticide usages. Also, the above discussed problenms are valid of values lower than LoQ as reason for probably uncertain exceedances before 2012 for neurotoxic insecticides.
Figure 4.2 Rate of exceedances per monitoring site; MoA grouping of pesticides from 2007 to 2017 in surface waters
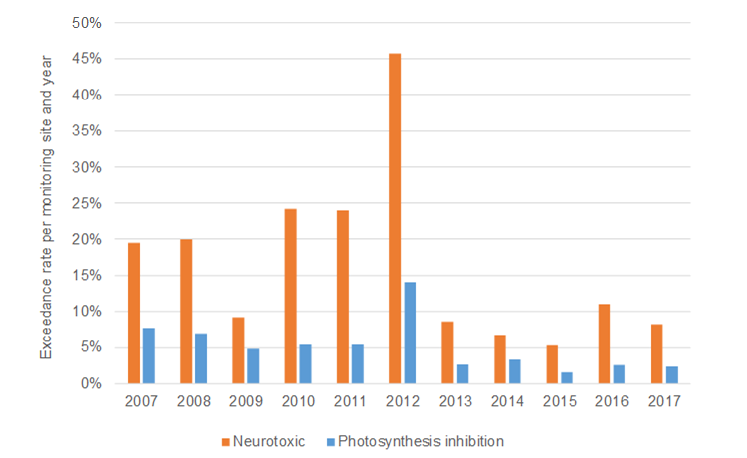
Note: Based on data from WISE 4 in the time period 2007 – 2017 and the grouping, only information on neurotoxic and photosynthesis inhibition substances are available.
4.1.1.2. Pesticides in groundwater
Table 4.2 shows in analogy to the results of pesticide substances in surface waters (section 4.1.1.1), the number of substances and their exceedance rate for groundwater.
The total number of records within the group of herbicides in the time period 2007 – 2017 is some 1,400,000, and the substances with the most exceedance rate are Deisopropyldeethylatrazine (4.9%), Desethylatrazine (3.49%) and 2,6-dichlorobenzamide (3.10%). Only five substances show exceedance rate >1% (out of 75).
Reported insecticides include a total of 61 different substances. The total number of records of the 61 substances in the time period 2007 - 2017 is 850,327, and some 219,000 records of the 11 listed insecticides in Table 4.2. Here, only two substances – Demethon-S-methyl and 1,2-dichloroethane – have exceedance rates > 2%. The exceedance rate of all other substances is less than 1%.
None of the selected substances assigned to the group of fungicides show exceedance rates > 1%. In the time period 2007 – 2017, 113,688 records were reported from the 11 selected fungicides.
Table 4.2 Number of reported substances with the most reported rate of exceedances in groundwater, grouped by usage in the time period 2007 – 2017
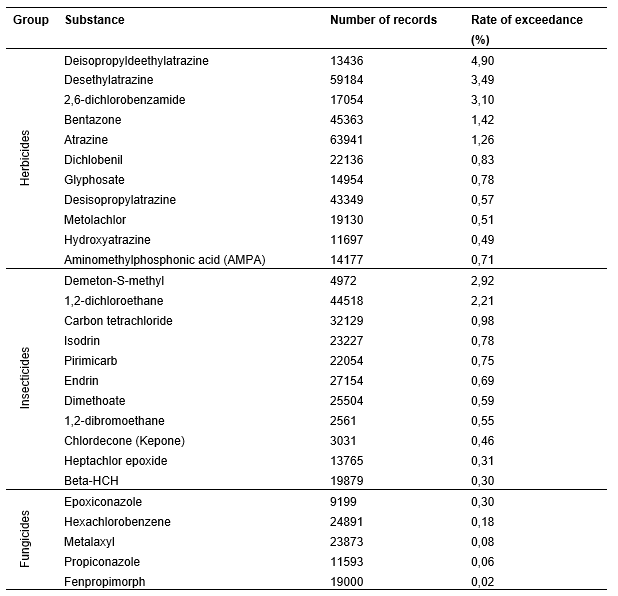
Notes: The used groundwater quality standard for all substances was 0.1 µg/l. The number of records is an aggregate of samples taken at one site, for one substance, in one year; typically composed of (more) disaggregated but also aggregated reported records.
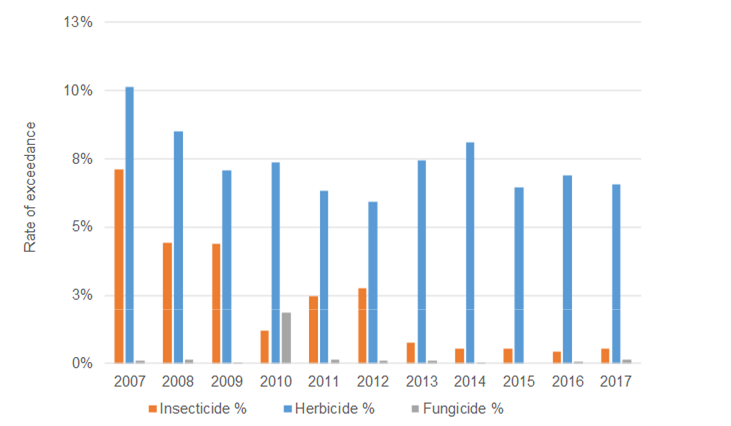
Figure 4.3 shows the rate of exceedance over the time period from 2007 to 2017 of the three groups insecticides, herbicides and fungicides in groundwater monitoring stations. The results show by far highest rates of exceedances of herbicides with a probably slightly decreasing trend from 8-10% in 2007-2009 to 7–8 % in 2015 - 2017. The exceedance rates at monitoring stations occurs also for insecticides, but this might have the same LoQ-based reasons as discussed for surface waters. The rate starts with 2-7.5% until 2012 and decrease to 0.5% after 2012. Fungicides show, like the results in surface waters, the lowest exceedance rates over the whole time period with a small peak in 2010 (which cannot be interpreted in detail). Overall, the exceedance rates at groundwater monitoring stations are much lower than exceedance rates in surface waters.
Figure 4.3 Rate of exceedances of the three usage groups of pesticides from 2007 to 2017 in groundwater
In groundwater, the assesment according to MoA grouping is not relevant, because groundwater assessment is not based on the effects to aquatic organisms but the EQS is derived from protection of drinking water from all pesticides.
4.1.2. E-PRTR
Table 4.3 shows the pesticide load in 2017 reported under the E-PRTR for pesticides. As shown in the table, Simazine is by far the substance with the highest load, due a facility in Spain which is emitting 99,5 % of the Simazine pollution. Diuron is the second most emitted pesticide under PRTR which is widely in use.
Table 4.3 Total pesticide load to water reported under E-PRTR in 2017
(n.d. = no data or information available)
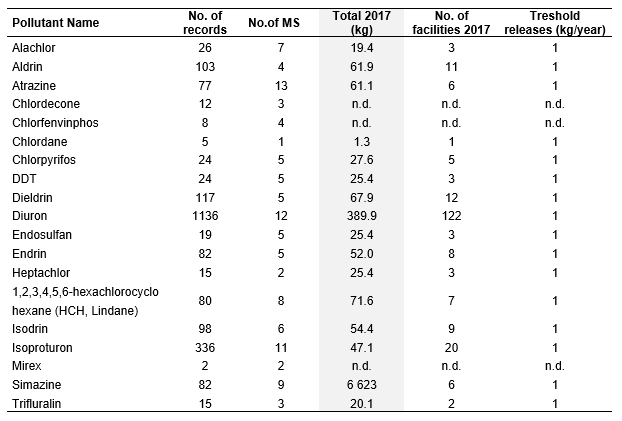
Source: E-PRTR .16, published in 2019 including 2017 data
Most of the E-PRTR pesticides are not in use anymore: Simazine, DDT, Lindane, Mirex, Aldrin, Dieldrin, Endrin and Isodrin are banned under the Stockholm POP convention, Isoproturon was banned in 2016, respectively. Still in use, but also restricted are Chlordane and Diuron, respectively. Additionally, a substance banned as pesticide might be still used as a biocide, if the approval of the biocide usage group is not finalised, in which this substance is included in one of the products.
Based on E-PRTR data, one possible assessment is shown in Figure 4.4. Because of the high aggregation (e.g. mean value of each years, measurement of effluent concentration etc.) loads of Diuron gives hardly any trend over the time period from 10 years. In Belgium, loads under consideration of the used data, are much higher than in the other selected countries. Additionally, one should have in mind, that emissions from diffuse sources and smaller facilities are not counted in E-PRTR.
Figure 4.4 Trend of Diuron loads (kg/a) from waste water treatment plants in EU Member States
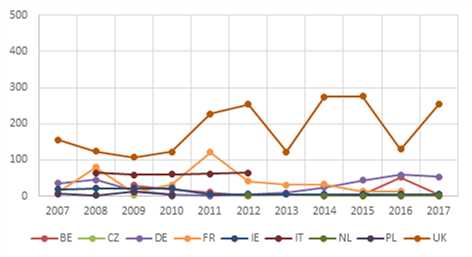
Note: Example of total discharges into water by countries over 10 years (based on raw data)
Source: E-PRTR v.16 (https://prtr.eea.europa.eu/)
4.1.3. Waterbase - Emissions
As already described in section 3.1.2.2, only few Member States reported pesticide emissions under the Waterbase - Emissions database.
Two countries (Belgium and the Netherlands) reported an estimate of pesticide releases from agriculture. This estimate is based on the national model NMI3 for the Netherlands and the WEISS model developed and used in Belgium. The model NMI 3 is based on the development of emission factors using different pathways and the sales data of pesticides. It is described in the national emission register [1]. The WEISS model was developed under the WEISS project and combines data on pesticide use, crop distribution and pathway factors [2].
[1] http://www.emissieregistratie.nl/erpubliek/documenten/Water/Factsheets/Nederlands/Emissies%20landbouwbestrijdingsmiddelen.pdf, cit. 28.7.2019
Figure 4.5 shows an example of the Waterbase - Emissions data for pesticides. According to this database, the amount of pesticides doesn’t show any trend over the last 10 years. It needs to be noted, that Waterbase - Emissions is not a mandatory reporting but at present provides the most valuable database for emissions from diffuse sources.
Figure 4.5 Trend of pesticide releases from agriculture (kg/year) in RBD Maas and Schelde (Belgium) reported under WISE 1 (kg/year)
Source: https://www.eea.europa.eu/data-and-maps/data/waterbase-emissions-7, cit. 19.6.2019.
4.2. Assessments and results of qualitative data sources
4.2.1. Water Framework Directive
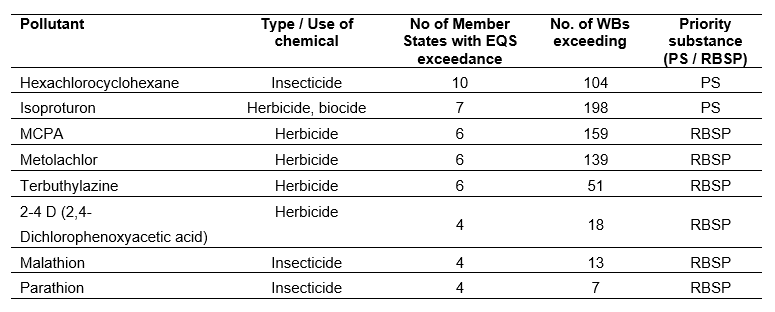
According to the implementation of the WFD, 621 surface water bodies are still failing to achieve good chemical status in the second RBMPs due to pesticides, of which most of them are Isoproturon (198), MCPA (159) and Metolachlor (139) (Table 4.4). 571 water bodies improved from failing to achieve good chemical status in the first RBMP as a result of these substances meeting the relevant standards (EEA 2018).
Table 4.4 List of pesticides most frequently exceeding EQS in surface water bodies in the EU 25 (out of 111 105 water bodies)
Source: EEA ( 2018)
Table 4.5 shows the number of groundwater bodies failing to achieve good chemical status due to pesticides within the 2nd RBMP 2016.
Based on the 2016 WFD reporting, nearly 80% of all groundwater bodies in Luxembourg are significantly affected by herbicides, and some 50% in Czech Republic; Some 24% of all groundwater bodies in Belgium and 17% in France are affected by pesticides from agriculture. These amounts are far higher than in all other Member States.
Table 4.5 Share of groundwater bodies failing to achieve good chemical status due to pesticides and biocides (%)
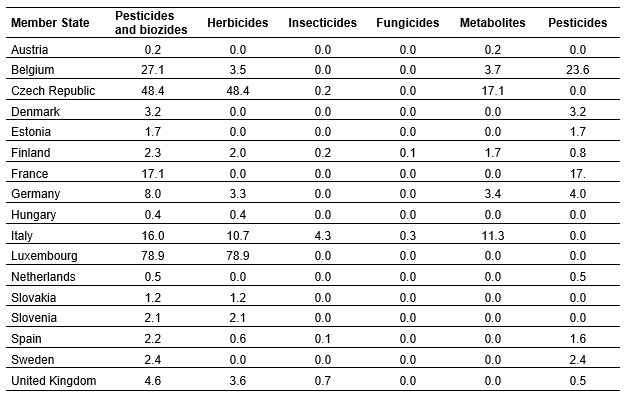
Note: ‘Pesticides’ (last column of the table) are not the sum of the afore mentioned specific substance groups. These are substances reported under code EEA_34-01-5 = active substances in pesticides, including their relevant metabolites, degradation and reaction products.
Source: EEA ( 2018b)
Based on the published data of the WFD (EEA 2018), most reported substances caused a failure to achieve good chemical status in groundwater were pesticides. AMPA, MCPA and Glyphosate were mainly reported as substances listed under the RBSP causing failure to achieve good ecological status in surface waters. Among these, Glyphosate and its metabolite AMPA were reported only from one Member State. The priority substance Tributyltin, a biocide mainly used to combat marine biofouling, affected the most surface water bodies (some 700).
4.2.2. Drinking Water Directive
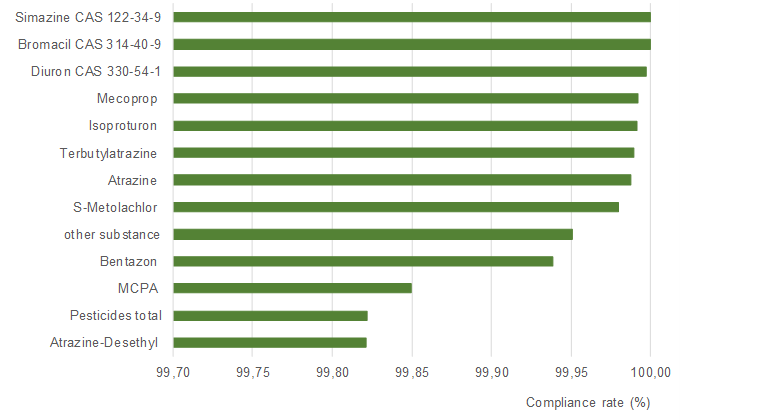
Based on data of the last reporting period between 2014 to 2016 under the Drinking Water Directive, Figure 4.6 shows the compliance rate of pesticide monitoring. The compliance rate was calculated based on number of samples between 2014 and 2016 in all Water Supply Zones and the number of samples non-compliance (exceedance of threshold).
Based on this, the compliance rate with the list of pesticides (see section 3.2.2) is high and varies between 99.82 up to 100%. In contrast to other environmental reporting requirements, compliance requirements for drinking water are measured in tap water.