
Table of contents
2. Country profile (pilot)
Rainfall, melted snow and inflow of fresh surface water and groundwater from neighbouring countries increase volume of fresh surface water and groundwater in a country, whereas a part of the freshwater evaporates from open water surfaces and the soil or transpires from crops and other vegetation. The balance of these processes leads to the annual renewal of the fresh surface water and groundwater in a country.
FIGURE 1.1 Annual volume of renewable fresh surface water and groundwater between [TV1.1] 2000 and [TV1.2] 2021 in [TV1.3] EU-27 (in million m3).

Between [TV1.1] 2000 and [TV1.2] 2021, the volume of the renewable fresh surface water and groundwater in [TV1.3] Xxxxx was estimated at [TV1.4] 100,754 million m3 on average. The lowest volume was observed in [TV1.5] 2011 ([TV1.6] 55,572 million m3) and the highest in [TV1.7] 2000 ([TV1.8] 183,837 million m3).
The average volume of renewable fresh surface water and groundwater during [TV1.9] 2016-2021 was [TV1.10] lower / higher / the same compared to [TV1.11] 2000-2005.
FIGURE 1.2 Average volume of renewable fresh surface water and groundwater per person in [TV1.3] tXxxxx compared to the EU-27 ([TV1.1] 2000 - [TV1.2] 2021 average; in m3 per person).
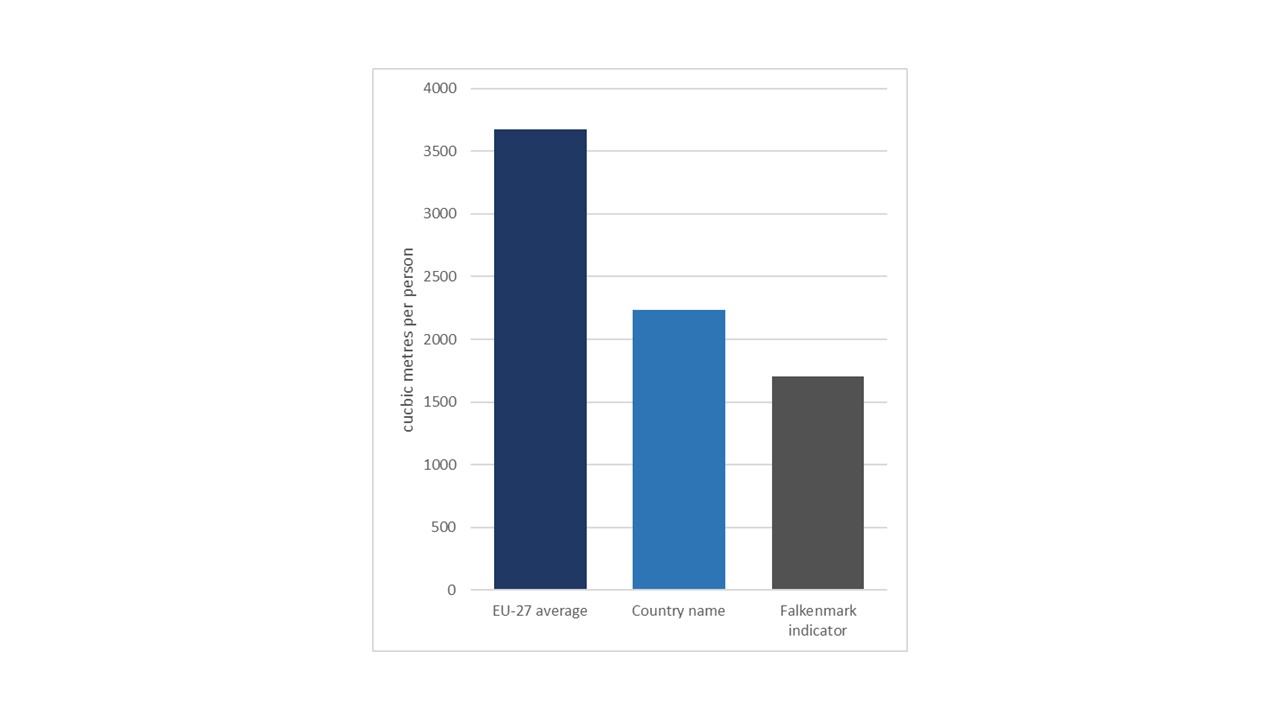
Taking into account the population of [TV1.3] the EU-27, the average volume of renewable fresh surface water and groundwater is [TV1.12] below / above / the same as the long-term EU average between [TV1.1] 2000 and [TV1.2] 2021.
It is noted that climatic, landscape and geological characteristics may cause significant differences in the regional or local availability of fresh surface water and groundwater, compared to the country average.
PANEL 2 - Development of abstraction from fresh surface water and groundwater
Society and economy depend largely on the abstraction of fresh surface water and groundwater from the environment to meet their needs.

Between [TV2.1] 2000 and [TV2.2] 2019, the total abstraction of fresh surface water and groundwater in [TV2.3] the EU-27 [TV2.4] remained the same / decreased from [TV2.4.1] 235,167 to [TV2.4.2] 176,515 million m3 / increased from 36,455 to 30,359 million m3 /
- The abstraction of fresh surface water [TV2.5] remained the same / decreased from [TV2.5.1] 192,281 to [TV2.5.2] 133,095 million m3 / increased from 30,456 to 24,028 million m3.
- The abstraction of fresh groundwater [TV2.6] remained the same / decreased from 5,989 to 6,331 million m3 / increased from [TV2.6.1] 42,885 to [TV2.6.2] 43,420 million m3.
PANEL 3- Development of abstraction from fresh surface water and groundwater by each economic sector
Decreasing the abstraction of fresh surface water and groundwater from the environment can help to reduce the risk of water scarcity. It also helps to be better prepared against droughts and their potential consequences on society and economy.
FIGURE 3.1 Volume of fresh surface water and groundwater abstracted by each economic sector (in million m3).
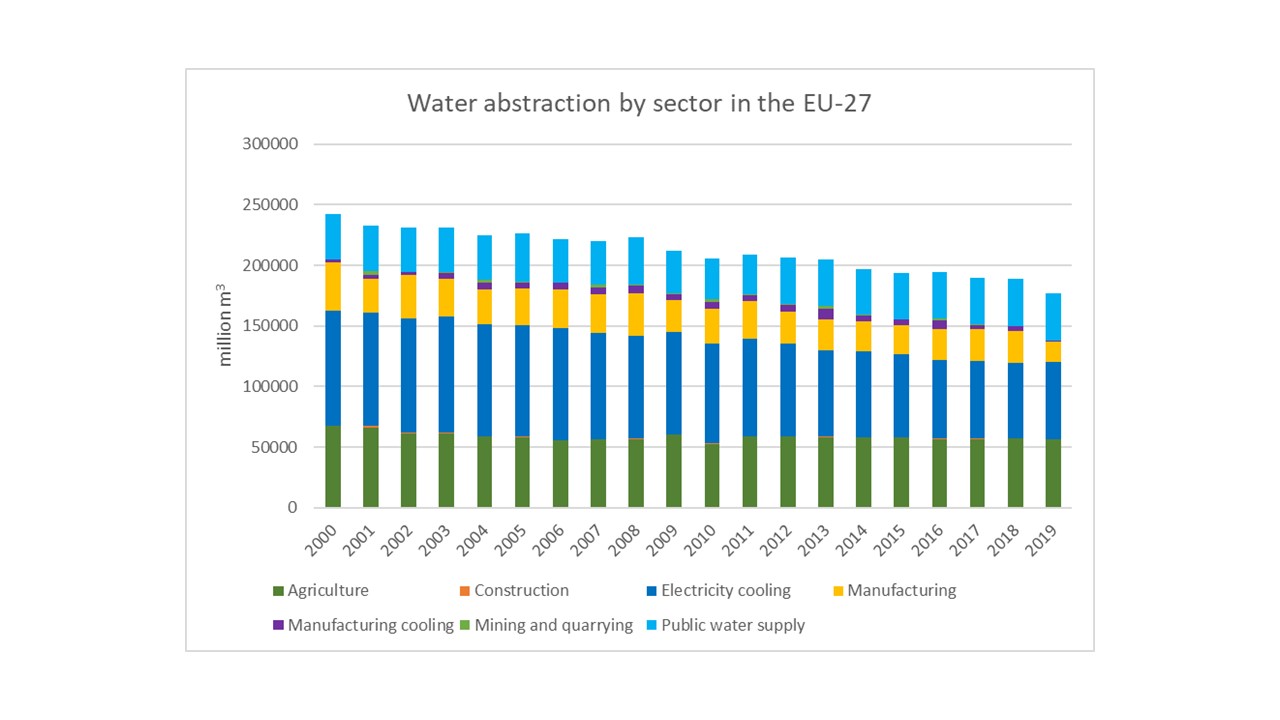
Between [TV3.1] 2000 and [TV3.2] 2019, the total abstraction of fresh surface water and groundwater in [TV3.3] Xxxxx [TV3.4] decreased / increased / remained the same.
The abstraction of fresh surface water and groundwater decreased in [TV3.5] agriculture, electricity cooling, manufacturing, public water supply and increased in [TV3.6] : .
[If the value of 2000 and/or the value of 2020 are 0, then write at the bottom:]
Insufficient data are available for [TV3.7] construction, manufacturing cooling, mining and quarrying.
PANEL 4 - Development of leakages and other water losses
Decreasing the leakages and other water losses (e.g. evaporation and transpiration) during water transport may help to reduce the water abstracted from the environment, save water for productive activities and lower the costs for water treatment and supply.
Between [TV4.1] 2000 and [TV4.2] 2021, leakages and other water losses during water transport in [TV4.3] the EU-27 [TV4.4] decreased / increased / remained the same.
FIGURE 5.1 Water consumed in the country, as a percentage (%) of the annual volume of renewable fresh surface water and groundwater[1].

[1] The water consumed in the country, expressed as a percentage (%) of the annual volume of renewable fresh surface water and groundwater is an indicator for measuring water scarcity, which is known as Water Exploitation Index plus (WEI+). For further read see: “Water scarcity conditions in Europe (Water exploitation index plus)”.
The annual level of water scarcity [TV5.1] decreased / increased /remained the same in [TV5.2] Xxxxx between [TV5.3] 2000 and [TV5.4] 2019, based on the water consumed in the country, as a percentage of the annual volume of renewable fresh surface water and groundwater.
Furthermore, the level of water scarcity of year 2000 was exceeded [TV5.5] xx times in [TV5.6] xx years.
[TV5.7] Xxxxx has not been exposed to water scarcity condition between [TV5.8] 2000 and [TV5.8] 2019.
PANEL 6 - Supply of reclaimed water, desalinated water or other non-freshwater resources
Increasing the supply of reclaimed water from urban waste water or desalinated water or other non-freshwater resources (e.g. brackish surface water and groundwater) may relieve the pressure on fresh surface water and groundwater, reduce water scarcity, and diversify the sources of water supply in the case of droughts[1].
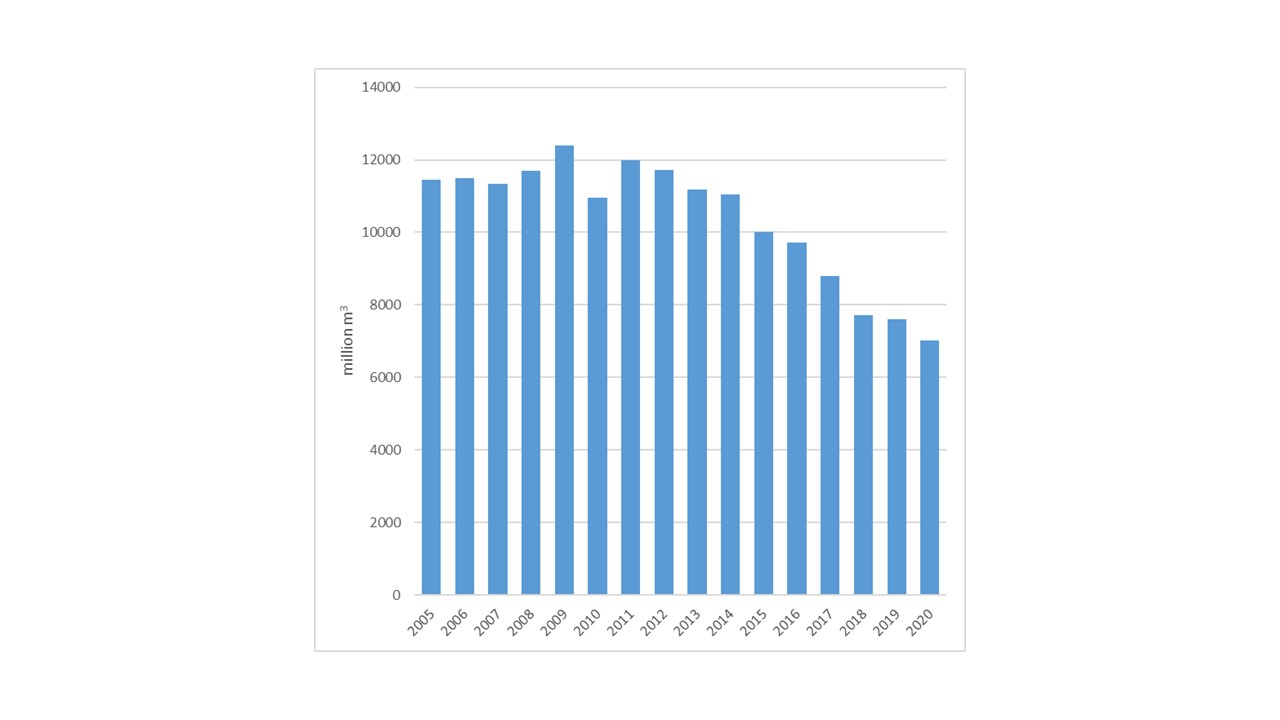
FIGURE 6.1 Volume of reclaimed water, desalinated water or other non-freshwater resources supplied (in million m3).

[1] However, it is noted that potential health risks and environmental impacts must be safely managed and tackled, taking into account EU and national legislation.
In [TV6.1] EU-27:
- [TV6.2] water is reclaimed from urban waste water / water is not reclaimed from urban waste water
- [TV6.3] desalination takes place / desalination does not take place
- [TV6.4] other non-freshwater resources are used / other non-freshwater resources are not used
- [TV6.5] data is not available
PANEL 7 - Average price of key water services and recovery of their financial costs
The Article 9 of the Water Framework Directive requires that EU Member States apply water-pricing policies based on user and polluter pays principle, providing adequate incentives for efficient water use and, thus, contributing to the achievement of the Directive’s environmental objectives. Furthermore, water-pricing is a key instrument to arrive at an adequate contribution from the various water use sectors (disaggregated into at least households, agriculture and industry) to the recovery of the costs of the various water services.
MAP 7.1 Percentage of financial cost recovery at river basin district level [TV7.1] Xxxxx in the 2nd RBMPs (2009-2015).

[NOTE: A map viewer will display three categories of service prices and their financial cost recovery rates at RBD level i.e.
- Households which is consisting of overall water supply for drinking water and/or sanitation services
- Agriculture which includes also water supply for irrigation
- Industry covers water use in industrial production and energy generation as well.
The above map just illustrates financial cost recovery rate of water supply services for households by randomly assigned threshold values]
[1] It is noted that prices may differ between water services due to differences in the level of required treatment, the amount of energy use for transport, treatment and distribution of water, the type of water source and the distance from it, etc.
