
Post a comment on the text below
Although a large proportion of water bodies are not classified for each single quality element (grey bars in figure 2.4), more than two-thirds of all water bodies are classified with at least one biological quality element. The most frequently classified biological quality elements for rivers are benthic invertebrates, phytobenthos/other aquatic flora/macrophytes and fish, phytoplankton for lakes and phytoplankton and benthic invertebrates for transitional and coastal waters.
The ecological status for individual quality elements is generally much better than the overall ecological status. For rivers, for example, 50-70 % of the classified water bodies have high or good status for several biological quality elements, while the overall ecological status is only high or good for less than 40 % of the river water bodies. For the physico-chemical and hydromorphological quality elements generally more than two-thirds of the water bodies have at least good ecological status.
Figure 2.4. Ecological status of biological quality and supporting elements in rivers, lakes, transitional and coastal waters.
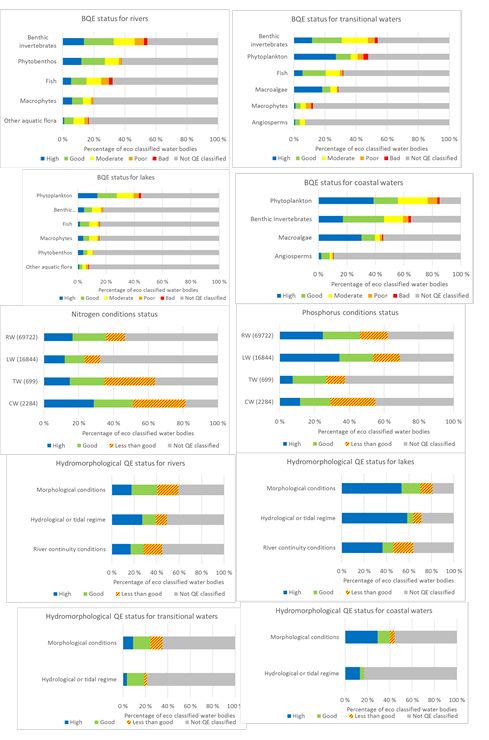
Notes: Ecological status for biological quality and supporting elements in water bodies classified for overall ecological status (100%). The grey part shows water bodies not classified for that particular quality element.
EEA is exploring possibilities to present aquatic flora correctly – some Member States report “Other aquatic flora” while other Member States have reported the aquatic flora sub-indicators.
Source: Preliminary results from WISE-SoW database including data from 22 Member States (excluding Austria, Denmark, Greece, Ireland and Malta). See Link for results including 25 Member States.
You cannot post comments to this consultation because you are not authenticated. Please log in.
Previous comments
First sentence:
"Although a large proportion of water bodies are not classified for each single quality element..."
please delete "are" and replace by "is"
"The ecological status for individual quality elements is generally much better than the overall ecological status" - this sentence contains to our opinion a very important message - you might add this message to the key messages in chapter 6?
Figure 2.4:
1. Figure 2.4 titel: Ecological status & potential of... (in many diagrams in the above text "status and potential" is noted, but here only status ?)
2. The legends in the diagrams of Figure 2.4 contain the description "Not QE classified" for the grey bars. Probably it will be better to replace "Not QE classified" by "Not classified".
3. In the diagrams for nitrogen conditions and phosphorous conditions an explanantion is needed what "RW", "LW", "TW" and "CW" means.
"The ecological status for individual quality elements is generally much better than the overall ecological status." should be replaced as follows "The status classification for individual quality elements is generally much better than the overall ecological status classification."
BE-FLA (RV): p. 25 §2 The most frequently classified biological quality elements for rivers are benthic invertebrates, phytobenthos/other aquatic flora/macrophytes and fish, phytoplankton for lakes and phytoplankton and benthic invertebrates for transitional and coastal waters.
1) Redraft sentence: Rivers: …; Lakes: …; TC: …
2) Any conclusions to be drawn for this chapter?
BE-FLA (RV): p. 25 §3 The ecological status for individual quality elements is generally much better than the overall ecological status. For rivers, for example, 50-70 % of the classified water bodies have high or good status for several biological quality elements, while the overall ecological status is only high or good for less than 40 % of the river water bodies. For the physico-chemical and hydromorphological quality elements generally more than two-thirds of the water bodies have at least good ecological status.
“generally”? Is the opposite possible, considering OOAO?
Correction:
“The ecological status for individual quality elements is generally much better than the overall ecological status. For rivers, for example, 50-70 % of the classified water bodies have high or good status for several biological quality elements, while the overall ecological status is only high or good for less than 40 % of the river water bodies. For the physico-chemical and hydromorphological quality elements generally more than two-thirds of the water bodies have at least good ecological status.”
BE-FLA (VVDL): p. 25 §3
Possible solution to overcome the problem of the variety of the number of quality elements used for the assessment of the status is to make 2 separate evaluations:
One based on the results of the operational monitoring (for which only results for the biological quality elements that are subject to the pressures causing a risk for failure to achieve good status)
BE-FLA (RV): p. 26, Fig 2.4
1)Proposal to re-arrange figures:
BQE Rivers / HM Rivers
BQE Lakes / HM Lakes
BQE TW / HM TW
BQE CW / HM CW
N / P
2) Add numbers to labels
It is noted that Denmark is not included. Data has to our knowledge been uploaded via the WISE database and we would therefore appreciate if the figure could be updated for the final report.
BE-FLA (RV): p. 25 Although a large proportion of water bodies are not classified for each single quality element (grey bars in figure 2.4), more than two-thirds of all water bodies are classified with at least one biological quality element. The most frequently classified biological quality elements for rivers are benthic invertebrates, phytobenthos/other aquatic flora/macrophytes and fish, phytoplankton for lakes and phytoplankton and benthic invertebrates for transitional and coastal waters.
The ecological status for individual quality elements is generally much better than the overall ecological status. For rivers, for example, 50-70 % of the classified water bodies have high or good status for several biological quality elements, while the overall ecological status is only high or good for less than 40 % of the river water bodies. For the physico-chemical and hydromorphological quality elements generally more than two-thirds of the water bodies have at least good ecological status.
Any conclusions to be drawn for this chapter?
Ecological status of biological quality and supporting elements in rivers, lakes, transitional and coastal waters.
Ecological status of hydromorphology should not be reported the same way as other quality elements. As discussed in the hydromorphology -expert workshop in November 2017, the assessment of hydromorphology -pressures and their way of use differ remarkably. In many Member States hydromorphology -pressures are divided into different classes without any link to ecological status classes. In some MS, hydromorphology classes have been tried to link to ecological status classes. In specific, hydromorphology classes have been used as supporting (indicating) in additional to classifying biological criteria. The WFD classification spectrum involves only high/good.
(AT) 2nd para, 2nd sentence: 'The most frequently classified biological quality elements for rivers are benthic invertebrates, phytobenthos/other aquatic flora ...'
Not clear what is meant with this term. Is not included in list of BQEs above.
(AT) Figure 2.4: 'Ecological status of biological quality elements and supporting elements in rivers, lakes, transitional and coastal waters'
Other aquatic flora? Explanation is needed how status was assessed for supporting elements.
Results of risk assessment? Whats about the RBSP?
The graphical visualization of some of the diagrams presented in the Annex „Wise-SoW graphs 2018-01-23” is inaccurate, namely:
The graphical visualization of the above mentioned diagrams does not correspond to the text of the report and does not provide a realistic assessment by QE status and by country.
In the diagrams QE status, by quality element and country and QE status, by quality element, category and country the percentage distribution between different classes of status has been calculated on the basis of number of water bodies for which assessment of status is reported , i.e. the number of water bodies for which “unknown status” of the respective QE is reported are not taken into account. Diagrams for a certain class however depict on the axis X “water bodies” and on axis Y “% of total”. This interpretation can lead to significant distortion of the visual information for the respective countries. For example, in the diagram QE status, by quality element, category and country a 100 % “less than good” status is presented for Bulgaria determined on the basis of a single WB for which status was reported (out of a total of 955 water bodies).
At the same time, in the overview diagrams in the report Figure 2.4 ( Chapter 2.3) the percentage distribution of status within the respective classes takes into account the percentage of water bodies “Not QE Classified” as well. Visualization in the diagram Surface water bodies: QE status, by category in the graphical annexes to the report is accurate, since water bodies with unknown status are correctly included in the diagram.
Based on the above observations, the Bulgarian proposal we would like to convey is:
Text under figure 2.4, 'source': This is referred to in other places as well (sometimes 23 instead of 22 MS are mentioned); this comment thus applies to those parts of the text as well. It would seem some MS, as mentioned here, were not considered in the report or/and figures prepared. However, they are then referred to in the main text (eg Austria) suggesting they were considered. Also the link then takes you to the data for 25 MS for example. Will this and other figures and text be updated in the final report? That would be useful.