
Table of contents
1) Indicator text and figures
Summary
Pesticides[1] were assessed against effect or quality thresholds between 2013 and 2020. One or more pesticides was detected above its effect threshold at 15-26% of all surface water monitoring sites each year. Exceedances were mainly caused by the insecticide imidacloprid in surface waters, and the herbicides MCPA, metolachlor and metazachlor. Exceedances of one or more pesticides were detected at between 4% and 10% of groundwater monitoring sites, mainly by atrazine and its metabolites. No trends can be derived at this time and between-year changes may not be significant.
[1] Pesticides include both active substances from plant protection products and biocides as well as their relevant metabolites.
-
Please, tell the reader which pesticides and metabolites you use for the indicator and which you not use e.g., by linking to some lists. The reader, not working in details with pesticides will not be aware of that some metabolites are classified as non-relevant. If you take Denmark, we report in the yearly national groundwater monitoring program (https://www.geus.dk/vandressourcer/overvaagningsprogrammer/grundvandsovervaagning) that about 30% of the groundwater monitoring sites exceed thresholds, but your table in Figure 2 states that it is 4%. This huge difference is mainly caused by the non-relevant metabolites, which is part of the Danish monitoring program. As an example taken from the latest report the exceeding for monitoring sites analysed in 2020 were for CAS_6339-19-1, Chloridazon desphenyl 17% , CAS_3984-14-3, N,N-dimethylsulfamide 6%, CAS_2008-58-4, 2,6-dichlorobenzamide 6 %, and CAS_288-88-0, and 1H-1,2,4-Triazole 9%. In Denmark also the non-relevant metabolites are evaluated with quality standard of 0.1 µg/L.
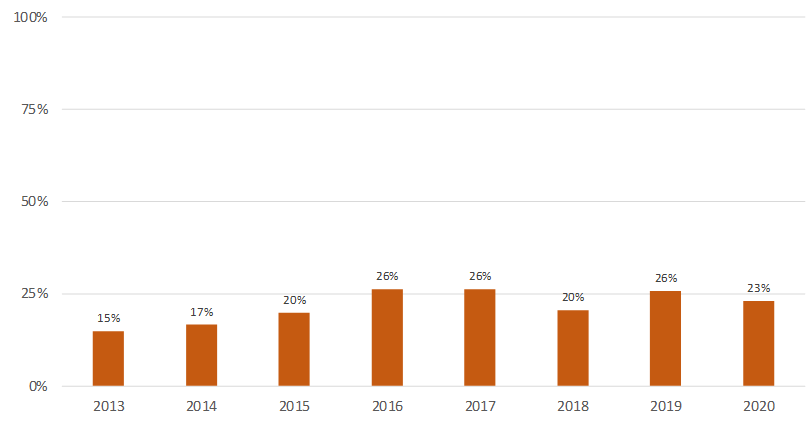
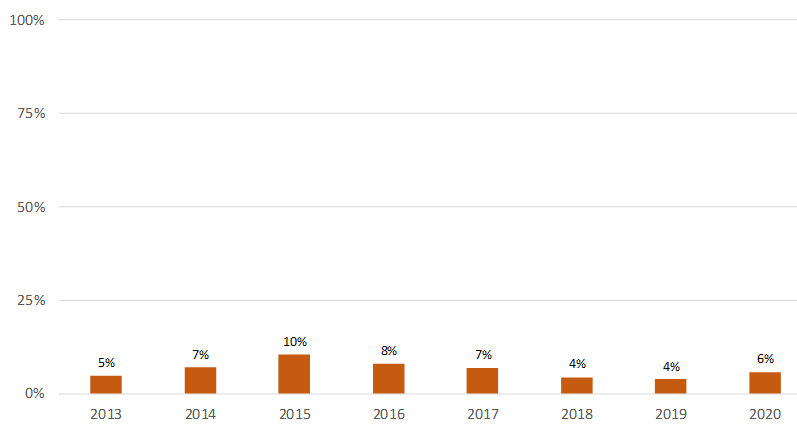
Figure 1. Percentage of reported monitoring sites with pesticides exceeding thresholds per year in a) surface waters and b) groundwater in Europe weighted by country area.
a)
b)
-
it would be useful to add some error bars on this chart
-
PT: In order to make the chart easier to read, it should be colour-coded.
-
AT
Both figures are misleading as they suggest that this is a presentation of a temporal development over the time period. But, there is an imbalance as regards the number of pesticides monitored , the monitoring frequency and there is no consistency in terms of monitoring sites over the whole time period per country. The comparison over time does not indicate, whether the total amount of pesticide exceedances increases or decreases. Please see further comments in Section 3.
-
Totally agree with Andreas :
No information (even in methodology and final annex) about evolution of :
- Number of pesticides monitored per country
- Number of monitoring sites (often the sites with problems stops be monitored, especially in case of tap water)
- LoQ
Changes in methodology of reporting since 2015 (majority aggregated data before and disaggregated since) could influence lot this evolution, as starting with reporting of new countries, add of new monitoring sites (1/3 more), double of annual records and of number of reported pesticides over the period, etc. all these variables impact the final proportions…
Important point : the majority of observed values are under the LoQ. And this LoQ is decreasing over the period (improvement of analytical methods), so influencing in the same way annuals means and therefore also the reported monitoring sites with pesticides exceeding thresholds per year.
Pesticides can contaminate surface waters and groundwater and if their concentrations are above critical thresholds, they can be harmful to the environment.
The European Green Deal (EC 2019) sets targets to reduce the use of and risks from chemical pesticides by 50% by 2030 in the zero pollution action plan (EC 2021), farm to fork strategy (EC, 2020b) and biodiversity strategy (EC, 2020a), with a focus on protecting ecosystems and improving biodiversity.
The Water Framework Directive (WFD) (EU 2000) sets environmental quality standards for pesticides in surface water. To assess the chemical status of groundwater, a precautionary quality standard of 0.1µg/L is set for pesticides according to the Groundwater Directive (EU 2006), reflecting the desire to keep pesticide concentrations in groundwater at low levels.
Figure 1 shows that in 15% to 26% of all surface water monitoring sites, one or more pesticides were detected above effect threshold each year between 2013 and 2020. Exceedances of one or more pesticides were detected at between 4% and 10% of groundwater monitoring sites.
Pesticides most often causing exceedance in surface waters are the insecticide imidacloprid, and the herbicides MCPA, metolachlor and metazachlor, all of which were approved for use in plant protection products during the monitoring period, though some are no longer approved. In groundwater, the herbicide atrazine and its metabolites cause most exceedances. Atrazine was not approved for use in plant protection products during the monitoring period. Despite restrictions on atrazine since 2007, it continues to be found in groundwater because it is very persistent.
-
"Figure 1 shows that in 15% to 26% of all surface water monitoring sites, one or more pesticides were detected above effect threshold each year between 2013 and 2020."
To avoid some misunderstanding/confusion, that sentence could be modified as "Figure 1 shows that, each year between 2013 and 2020, one or more pesticides are detected above effect threshold in 15% to 26% of surface water monitoring sites."
-
It would be very beneficial to see the whole list of pesticides causing exceedences in surface waters and groundwater (if it is not an excessively long list)
It is not yet possible to determine a trend in Figure 1. Losses from the application of pesticides may vary considerably between years, depending upon, for example, crop type and the weather, while the frequency of monitoring of pesticides in surface waters can be limited to one year out of three. Changes to the approval status of pesticides influence their use and presence in water, which can also lead to difficulties in interpreting trends over time. For these reasons, changes between years may not be significant. It is anticipated that a trend will become apparent in the next few years.
-
"It is not yet possible to determine a trend in Figure 1...because...the frequency of monitoring of pesticides in surface waters can be limited to one year out of three"
1 ) How many countries present a frequency of monitoring only 1 year out of 3 ?
2 ) Why do not determine trend on a regular 3 years spaced regular time serie ?
-
AT
No, in case the data collection does not change in order to have more comparable database, a trend as regards the risk from chemical pesticides will not be evaluable. Not yet and not in future.
I would find it very helpful to read few sentences about the recent results of the WFD reporting on pesticides (e.g. number of water bodies in poor status due to pesticides….) maybe comparing 2 RBMP cycles?
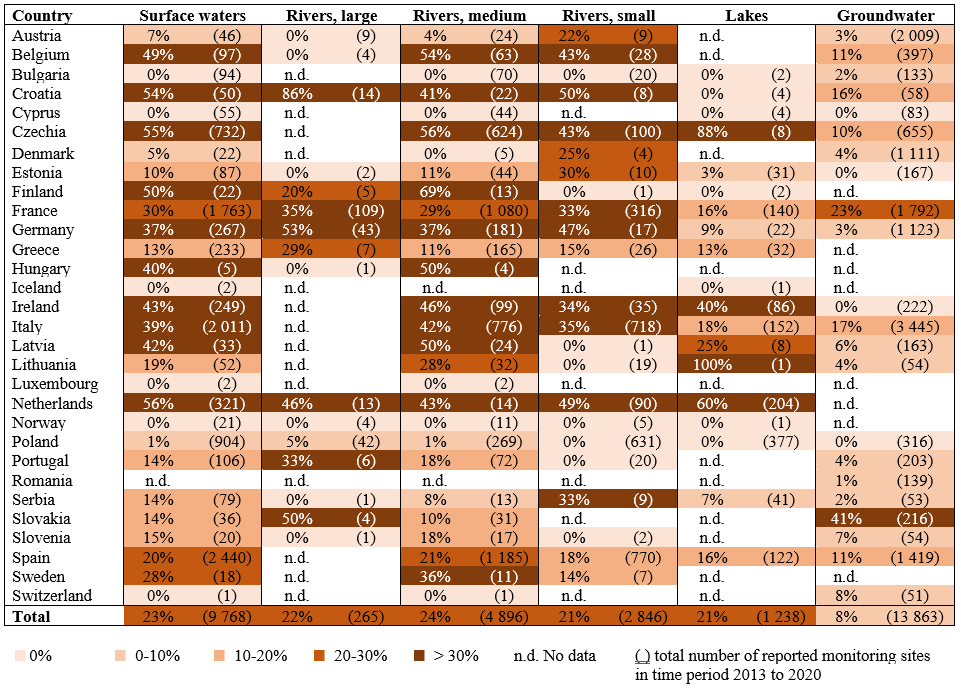
Figure 2. Percentage of reported monitoring sites with pesticides exceeding thresholds in surface waters, different sized rivers, lakes and groundwater in European countries in time period 2013 – 2020
-
It could be useful to add a caption to explain how the number of sites or rates are computed : for France case, there is 109 +1080 + 316 + 140 = 1645 sites , but the table indicates a total of 1763
-
Malta has been omitted from this table, when monitoring for pesticides in this reporting period 2013 to 2020 has occurred and no pesticides were detected in groundwater.
-
If available, additional information could be given for the type of groundwater monitoring sites i.e. monitoring well/spring
-
At least it needs to add the number of monitored pesticides.
-
Switzerland:
We are also not able to reconstruct the total number of reported monitoring sites for groundwater. The number do not correspond the data shown e.g. on the dashboard “Exceedances by Country by Year”.
Could you please provide more information on the methodology?
Between 2013 and 2020, pesticides were reported from a total of 9,768 monitoring sites for surface waters and 13,863 sites for groundwater. The number of monitoring sites reporting data for surface waters varies by country from less than 10 sites (Hungary, Iceland, Luxembourg, Switzerland) to more than 1,000 sites (France, Italy, Spain). There is similar variation in groundwater monitoring sites: numbers range from 54 sites in Lithuania to more than 3,000 sites in Italy (and more than 1,000 sites in Austria, Denmark, France, Germany, Spain).
-
It may be relevant to add another weight to take into account the length of the list of monitored pesticides; the weighted mean by the area is not sufficent to avoid some bia in this data set (the number of monitored pesticides is not proportionnal to the country area)
COUNTRIES | AREA (km2) | MONITORED PESTICIDES
Switzerland | 41 285 | < 10
Csezia | 78 871 | > 100
Norway | 385 207 | < 10 -
Some countries are reporting and monitoring only tap water monitoring points, what can't be compared with general survey. Tap water sites are selectioned for that issue, more protected, and therefore less polluted in each country. Thus the precision on the type of survey should by useful.
The number of pesticides reported in surface waters ranges from fewer than 10 substances (Iceland, Luxembourg, Norway, Switzerland) to more than 100 substances (Czechia, France, Germany, Italy, Netherlands, Spain). For groundwater, the lowest number of pesticides was reported from Austria (6) and the highest number from France (215).
Exceedance rates of more than 30% were reported in 16 out of 29 countries for surface waters and in one out of 22 countries for groundwater. High exceedance rates were mainly reported at monitoring sites in small and medium-sized rivers.
-
AT GW: the reporting was limited to selected, most relevant pesticides
-
In the points below, I briefly summarize our expert comments regarding the comparability of the developed indicator on pesticides.
1) Our first observation is that while some countries reported only a few monitoring sites detecting pesticides (in the case of Hungary this number is 5), in the case of other countries this number can be hundreds or even thousands. This can be an obstacle to a professional comparison.
2) The next issue is the threshold: in the case of some pesticides, they are according to the well-known list 33/45, while in the case of others - as it is written - they are according to the RBSP. In the case of the latter, when comparing the results of RBMP2, approx. there were differences of two orders of magnitude between the data of the member states, we still remember it well.
3) We see the third problem in the extent of the exceedance: it does not matter to what extent the limit value is exceeded by the value measured at the given monitoring site. It might be useful to investigate further how many times the limit value is exceeded, and accordingly some categories could be established for it: e.g. creating double, triple, five-fold, ten-fold, or even larger exceedance intervals.
It would probably require a much more complex indicator to be free from the distortion factors listed above and to be truly suitable for comparison. However, we find it most important that a common threshold value be used, e.g. the EU level average of the RBSP thresholds used in the RBMP. In addition, of course, "the number of exceedances in relation to all tested pesticides" is also an important factor.
-
There is clear correlation between the number of pesticides monitored and the exceedance rates. Countries should be compared only on the base of the same list of pesticides (gw). How it's possible to compare the countries where zero pesticides were monitored with others monitoring more than 200 substances??
AT
Please start with a sentence telling the reader the aim of the indicator, what should it show. The current situation of pesticide pollution? In Europe? In the countries? The temporal development? In Europe? In the countries? Considering all pesticides ? or only a selection?
With this methodology trends can also not be identified in the future years because of the missing consistency of the considered data. (see additional comments later on).