
Table of contents
3. Data and information sources
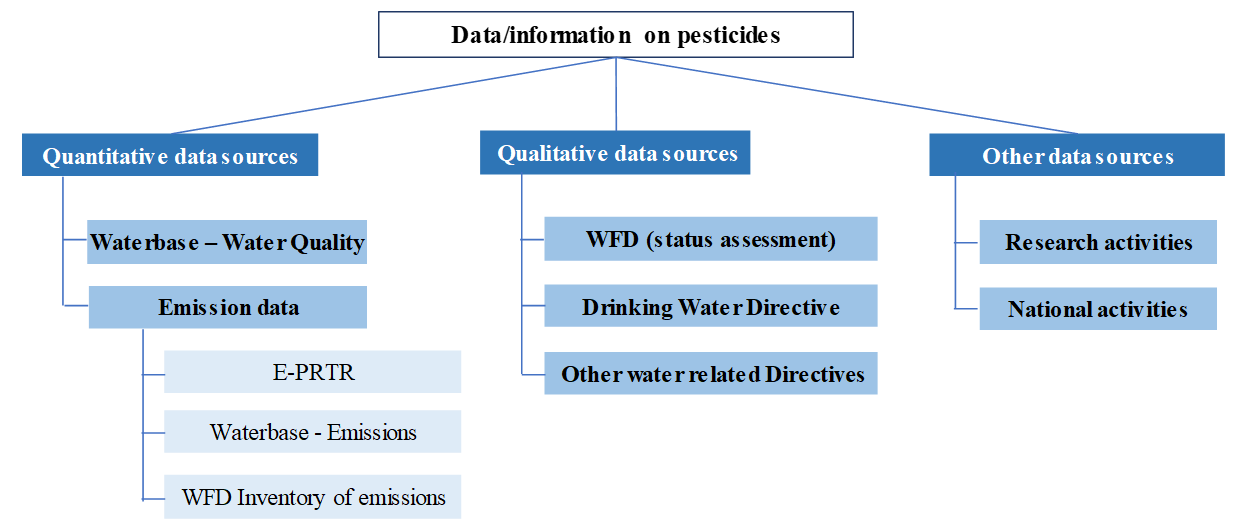
This section gives an overview of quantitative and qualitative data sources as well as other data overviews tackling the issue of pesticides, which were used for the technical report (Figure 3.1). These data and information sources were analysed in accordance to the availability of sufficient information on pesticides. The data assessments are presented in section 4 – status of information on pesticides.
Figure 3.1 Data- and information sources on pesticides, used in this report
3.1 Quantitative data sources
3.1.1. Waterbase - Water quality
Waterbase – Water Quality [1] is a database containing water quality data in rivers, lakes and groundwater. The basic records reported into the database are disaggregated water quality data on the observed values, representing one sampling at specific monitoring site and day for a specific parameter. As of 2015, reporting disaggregated records is preferred, while in the preceding period, more data was reported as annual records – i.e. annual statistics for each monitoring site and substance. The updated versions of the database are published annually, with the version used in this report covering the data up to 2017.
The pesticide data of Waterbase – Water Quality have been reported by 34 countries of Europe, representing the monitoring network of Member States of the EU as well as other EIONET reporting countries.
[1] The version of 2019, published on April 2019 and used for this report, is available at https://www.eea.europa.eu/data-and-maps/data/waterbase-water-quality-2.
The data on hazardous substances in water (including pesticides) from the Waterbase - Water Quality database were systematically assessed in the ETC/ICM technical report on Hazardous Substances in European Waters from (ETC/ICM 2015), covering the data for the period 2002-2011. The report summarises the state and availability of the data and provides a useful display of the large dataset, but cannot be regarded as an assessment of the situation between the reporting countries. It was concluded that despite the quality check procedures in place, some data were still questionable owing mainly to issues such as unclear reporting of limit of detection (LOD) or limit of quantification (LOQ).
This report gives an updated assessment of the Waterbase – Water Quality data, also using a new approach in data selection and processing, explained in the following subsection.
3.1.1.1. Selection of reference pesticides
The report focuses on pesticides, which represent a current water pollution and are still being discharged through use. The selection of pesticides for evaluation was limited to substances that were reported in the period under review 2007 -2017, because temporal coverage of pesticides data starts increasing after 1990 and, in terms of available records per year, more notably increases after 2006, with the largest number of records available for 2013 and 2014. Furthermore, the following criteria were used for the selection of substances: (i) approved and approval expired during the investigation period 2007 – 2017; (ii) measured in three or more Member States; (iii) mainly used for agriculture (pesticides).
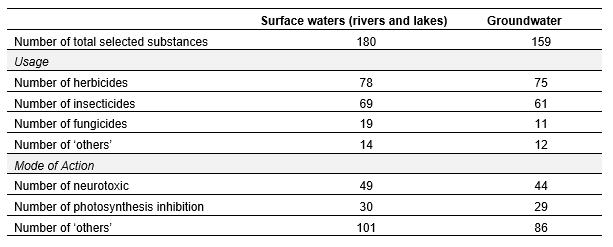
For building up the basis for an assessment, the list of substances was analysed in respect of different parameters. For this, each pesticide was checked in the Pesticides Properties Database (PPDP) (Lewis, et al., 2016). The outcome was a list with 180 pesticides including columns for chemical identifiers, their usage, the information about being it a parent substance or transformation product and their mode of action (MoA) to the pest organism (see Annex 5 and Annex 6). Based on this list, different assessments were made which are further shown in the paragraphs below and which are the basis for the development of a pesticide indicator to ease the river basin specific or site-specific monitoring and regulation of hot spots of contamination by a mixture of pesticides.
Only three main usage groups could be identified: herbicides (78 distinct pesticides), insecticides (72 distinct pesticides) and fungicides (23 distinct pesticides). The rest of substances were either transformation products/ metabolites (three) or could not be assigned to a specific usage or were multi-use pesticides.
In the PPDB database most of the pesticides are clearly assigned to a specific MoA. As the number of different MoA is very diverse it was decided to further simplify the grouping for easier analysis in this technical report. Thus, all substances which, for example, in one way or another modified nerve signalling or muscle activity (GABA receptors, AChE inhibitors or else) were allocated to the group of ‘neurotoxic compounds’. Similarly, all herbicides which inhibited photosynthesis – even if the exact position of the inhibition might be PS II or protoporphyrinogen oxidase inhibition or another mechanism - were assigned to the group of ‘photosynthesis inhibition’.
Based on the explained selection criteria, Table 3.1 shows an overview of the available data in the time period 2007 – 2017, which were used for the specific assessments. Overall, 180 substances were selected.
Table 3.1 Overview of selected substances and groups of available data reported under Waterbase – Water Quality on pesticides in time period 2007 - 2017
-
HU:
The list of data sources is complete, but there can be quite a big difference between the countries concerning the amount of uploaded data. For Hungary only the disaggregated data of first WFD cycle (2008-2012) was uploaded in WISE up to now. The concrete pesticide compounds reported to WISE by Hungary reflects to the priority list of EU for this time period, which is much less than 180 and 159 compounds that was included in the Technical Report.
3.1.1.2. Target setting
Target setting for substances was identified by comparing their occurrence with environmental quality standards, groundwater quality standards and detection limits. The used targets of the pesticides are listed in Annex 6. For this, the following sources were considered:
Surface waters
- Environmental Quality Standards (EQS) of the pesticides listed under the priority substances of the WFD; AA-EQS (annual average EQS) which are protective against chronic toxicity and MAC EQS (maximum acceptable concentration EQS) which should protect against acute toxicity.
- The maximum acceptable detection limit, according to the Watch List under Commission Implementing Decision (EU) 2015/495 and Commission Implementing Decision (EU) 2018/840.
- Environmental Quality Standards (EQS) of the pesticides listed under the River Basin Specific Pollutants (RBSP); if available: AA-EQS and MAC EQS. The EQS value for RBSPs can vary between Member States (MS). For the assessments based on Waterbase – Water Quality data (see section 1.1.1), the lowest reported EQS for a substance was used. When three or more countries regulated a substance, it was handled as relevant and included into the surface water assessment.
-
What about including RACs (acute and chronic Regulatory Acceptable Concentrations) so that more or less all pesticides could have an effect-related threshold, not only those listed under some priority list?
-
3rd bullet, 2nd sentence: This does not make sense, as some member states (e.g. Italy) used for most substance the drinking water guidance value of 0.1 µg/L as EQS for surface water, without any justification. Therefore, only ecotox-based EQSs should be included in this process.
3rd bullet, last sentence: what is the justification to consider them relevant?
Groundwater
- Groundwater Quality Standard of 0.1µg/l in accordance with the Directive 2006/118/EC (and referred to WFD) for each active substance in pesticides, including their relevant metabolites, degradation and reaction products.
EQS set at European level, groundwater pollutant threshold values and watch list detection limits were used to identify the reported measurements or monitoring stations with exceedances.
In Annex 6, more detail is provided on the AA-EQS and MAC EQS values used.
-
It would be interesting, for future assessments, to include also the threshold value of 0.5 µg/L for the total sum of all the substances (a.s. and/or metabolites) detected in a sample.
3.1.1.3. Extraction of the reference dataset on pesticides
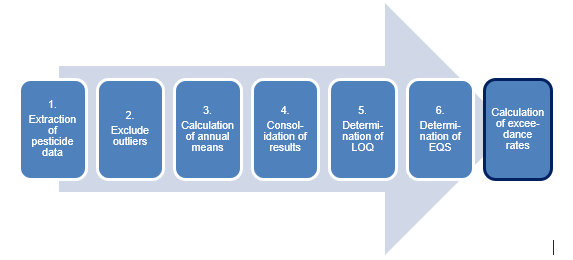
The dataset used in this report was extracted from Waterbase – Water Quality database with the following procedure (Figure 3.2).
Figure 3.2 Procedure to extract reference dataset on pesticides
1.
Extraction of disaggregated [1] and aggregated [2] data records on pesticides defined in section 1.1.1 (above), for the period 2007–2017, excluding records flagged for low reliability [3] but including any records that may be outliers.
[1] See definition of the disaggregated data at http://dd.eionet.europa.eu/tables/9153.
[2] See definition of the aggregated data at http://dd.eionet.europa.eu/tables/9323.
[3] This indicates existing observations for which the user should also be aware of the low quality assigned. For example, the combination of data in the record (such as non-default unit of measurement) raises ambiguity which could not be cleared out with the reporting country at the time, indicating that the observed value may be wrong.
-
Explanation needs to be added as to what an outlier is.
2.
For both, aggregated and disaggregated data, calculate 95th percentile of values by monitoring site and substance; then exclude any records that are more than 1000-fold above the calculated 95th percentile of the corresponding monitoring site and substance. This should exclude errors arising from incorrect units.
-
Exceedances should generally be analysed in more detail, not just when >1000-fold. For example: clarification is needed whether all the exceedances result from a specific point in time or a specific site?
3.
Calculation of annual arithmetic means from disaggregated data – for one substance at one monitoring site. When a measurement is flagged as below LOQ, half of the LOQ was used for calculating annual mean (see Box 1 for more information on LOQ).
Note that for groundwater data, there can be more than one monitoring site at a groundwater body, and no spatial aggregations are made. Instead here, each location was treated as an independent monitoring site.
-
Aritmetic mean calculations are made at monitoring point level or groundwater body level?
-
How was spatial pseudoreplication treated? The assumption of independency for sites along a stream network might not be the best choice.
-
It would be helpful to elaborate a little bit what is meant by "monitoring site".
4.
Consolidation of data reported as aggregated and disaggregated to a consolidated table of annual records. If a country reported both aggregated and disaggregated records for a substance at a monitoring site for the same year, records derived from disaggregated data have the priority.
5.
Determination of LOQ for each annual record;
- known LOQ: in Waterbase – Water Quality, the LOQ of the analytical method used is requested to be reported with each single or annual record (for the latter, the highest LOQ in a series of measurements within a year should be reported, although typically the same analytical method is used at the site throughout the year);
- unknown LOQ but flagged as “below LOQ”: some records in the database are only flagged as “below LOQ”; for these, the actual LOQ is uncertain, but the fact that they are below means their EQS or threshold value exceedance can be determined (see next point);
- no data or flags regarding the LOQ are available for a record at all.
6.
Determination of EQS or threshold value exceedance for each annual record:
- for records with no data or flags regarding the LOQ, no EQS exceedance or threshold value was determined; this yields 68,764 groundwater annual records (1.89% of all groundwater records in the reference dataset) for which threshold value cannot be determined, and 24,682 surface water annual records (0.68% of all surface water records in the reference dataset) for which EQS exceedance cannot be determined;
- exceedances in groundwater: if the mean calculated value is above LOQ and greater than the groundwater quality standard of 0.1 μg/l;
- exceedances in surface waters:
- the calculated annual mean value is above LOQ and greater than the AA-EQS;
- the calculated annual maximum is above LOQ and greater than the maximum allowed concentration MAC EQS.
The data on 180 distinct pesticides were extracted with such process, collected at a total of 16,886 groundwater monitoring sites and 9,495 surface water [1] monitoring sites (accounting for 3.63 million annual records altogether). The list of pesticides by water category, the number of records, and the number of monitoring sites at which the substance was monitored, as well as the time period, is available in Annex 1 for groundwater and for surface waters in Annex 2. Figure 3.3 illustrates the number of pesticide-monitoring sites per year.
[1]Water categories of “groundwater” and “surface water” (the latter including both river and lake monitoring sites) are defined for the purpose of this report.
-
HU:
The procedure of target setting (EQS), and obtaining the finally evaluated dataset is accepted and agreed.
Box 1 Definition and explanation of LOQ
Limit of Quantitation (LOQ) as well as limit of detection (LOD) are terms used to describe the smallest concentration of a measurand that can be reliably measured by an analytical procedure (Armbruster, and Pry, 2008).
- LOD (Limit of detection): Analyte was found in the sample (content which can be distinguished from the blank test sample in which the analyte is absent).
- LOQ (Limit of quantification): Analyte content which can be determined with a certain level of precision.
Within Waterbase – Water Quality, countries are recommended to report LOQ for each substance. Reporting of LOQ has not always carried out for example in case where in a country different methods with different LOQ for one substance were used.
LOQ becomes important, when higher than the environmental quality standard (EQS). In such cases it could not be decided, if the standard is met. For this report we have counted them as ‘standard is met’. In a second step, we have the aim to summarise these records as ‘unclear, if EQS is met’. This can be done, if our statistical checks have unravelled all values below LOQ.
-
typo "measurand"
-
Not very clear. The LOQs higher than the EQS is indeed a problem. How to tackle them can be explained in more detail.
Figure 3.3 Number of pesticide monitoring sites by year for groundwater and surface water
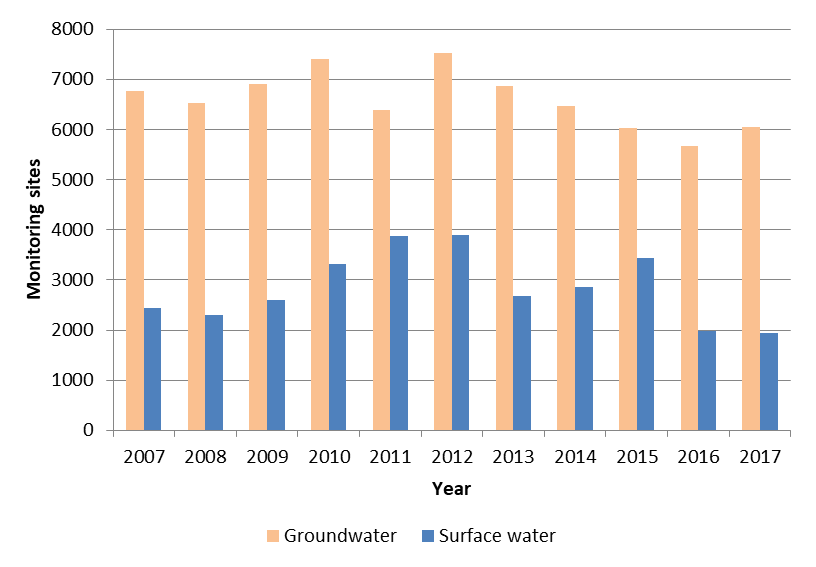
Source: WISE SoE – Water Quality database, version April 2019.
-
(Austria): Number of pesticide monitoring sites by year for groundwater and surface water - found where? In Europe?
Figure 3.4 illustrates spatial coverage of available data on pesticide monitoring reported under Waterbase – Water Quality in the time period 2007 to 2017 for each country in relation to the arable land ratio. The arable land ratio was calculated based on the country area and the arable land area in this country.
According to the arable land ratio, Denmark and Hungary are the countries with more than 50% of arable land. Poland has 43%, and Germany, Czechia, Slovakia, Hungary, Romania, Serbia, Bulgaria and Lithuania with an amount between 30 and 40% arable land cover. Arable land includes intensively used, usually ploughed land. This includes non-irrigated arable land, permanently irrigated land and rice fields. Agriculture additionally uses permanent cropped land, pastures and heterogeneous areas [1].
The reported number of monitoring sites differs between countries. Whereas Austria (16), Cyprus (10), Malta (89), Ireland (16) and Iceland (47) reported more than 10 monitoring sites per hectare arable land in the time period 2007 to 2017, the mean of reported monitoring sites for all other countries is 2.2. A list of available data on arable land use ratio, monitoring sites as well as number of reported pesticides is given in Annex 3.
[1] CORINE land cover land use definitions: https://land.copernicus.eu/eagle/files/eagle-related-projects/pt_clc-conversion-to-fao-lccs3_dec2010
-
The arable land defintion used excludes permanent crops e.g. vineyards and orchards, where PPPs are used relatively intensively. So, I dont think this is a useful parameter.
-
I don't quite get the usefulness of calculating the arable land ratio. In the end the spatial coverage is well represented by the number of monitoring sites per area of arable land, irrespectively of the proportion of arable land to total area.
-
HU:
There is an error on page 18, in the text about arable land ratio, Hungary is mentioned twice, first above 50%, later between 30 and 40%.
In the next paragraph the number the density of the monitoring network is expressed site per hectare, reporting incredibly high numbers from 10 to 47. In the legend of the next figure the density is given as site per 100 km2, which seems reasonable contrary to the per hectare unit.
Figure 3.4 Number of reported monitoring sites on pesticides per 100 km2 arable land in European countries in the time period 2007 to 2017
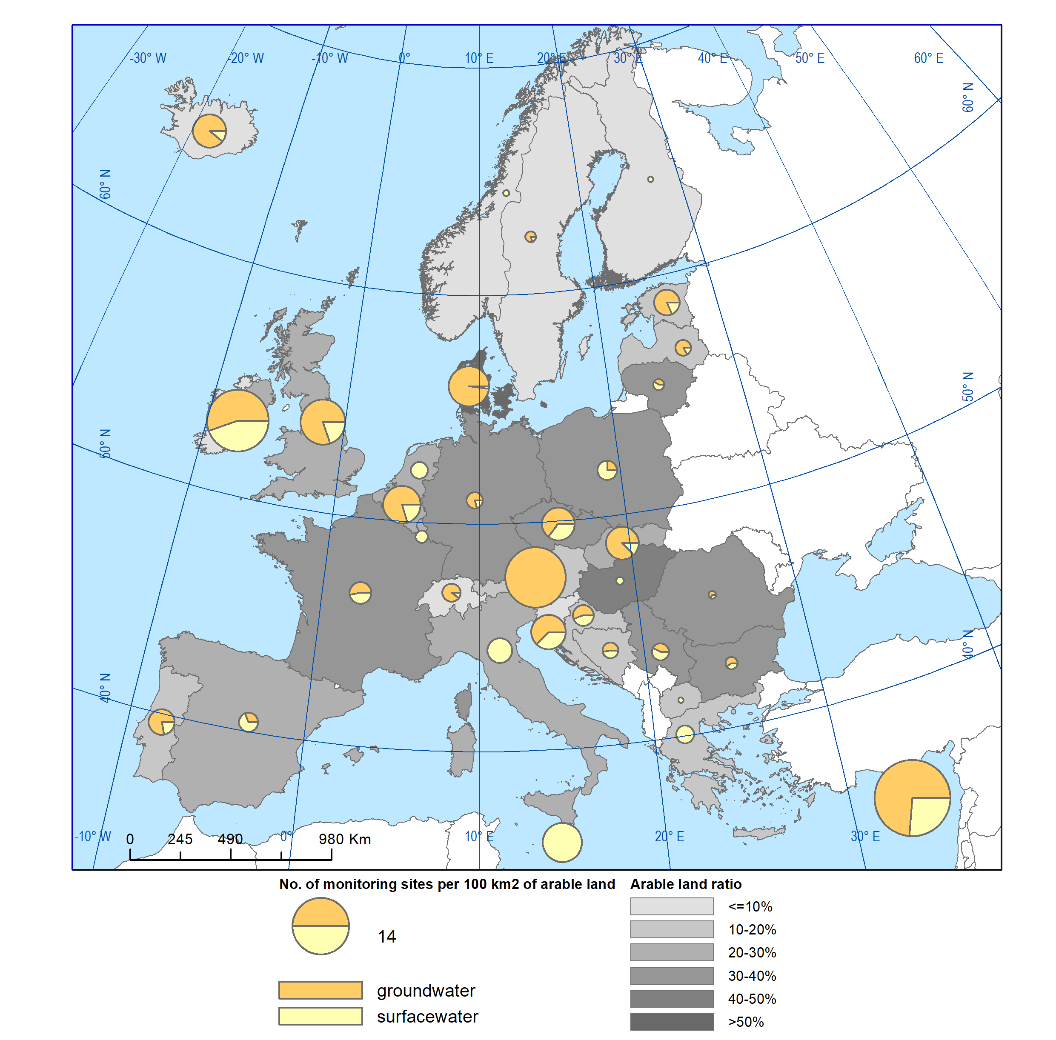
Source: WISE SoE – Water Quality database, version April 2019; Eurostat and Corine Land Cover data on arable land ratio.
-
(Austria): Pie chart: although it is true that almost all sites in AT are groundwater sites, there are still few surface water sites and this could be highlighted in the pie by a thin line like for DK.
Figure 3.5 shows the number of monitored pesticides for each country in the time period 2007 to 2017. The number of reported pesticide substances varies between 1 (Norway and North Macedonia) and 319 (France). Overall, there is neither correlation between the reported monitoring sites under consideration of the amount of arable land, nor the number of reported monitoring sites and reported monitored pesticide substances.
Figure 3.5 Number of reported monitored pesticides in European countries in the period 2007 to 2017
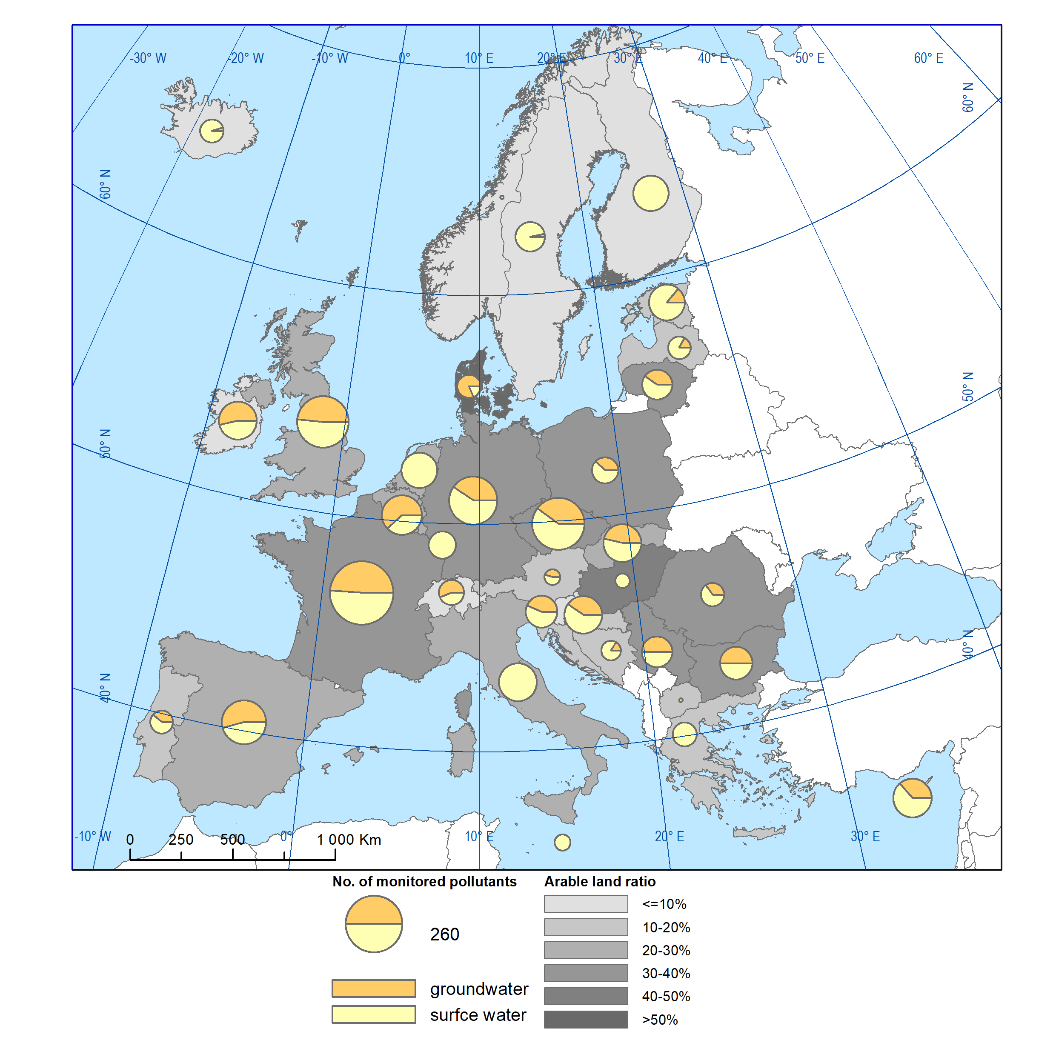
Source: WISE SoE – Water Quality database, version April 2019; Eurostat and Corine Land Cover data on arable land ratio.
Figure 3.6 illustrates 15 pesticides with the largest number of monitoring sites for groundwater and surface water, respectively. For groundwater, atrazine, simazine, desethylatrazine, diuron, and bentazone are the five most often reported pesticides in the dataset. In surface waters, 11 substances were reported as monitored at more than 6 000 monitoring sites.
Figure 3.6 Number of monitoring sites for the pesticides with the most frequently reported number of monitoring sites in groundwater and surface waters
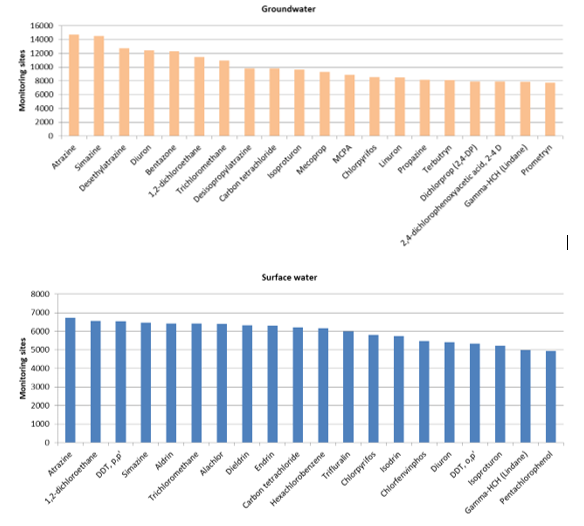
Source: WISE SoE – Water Quality database, version April 2019.
-
I don't quite understand the title of this figure. Is this the numbe rof monitoring sites at which these individual pesticides were detected?
-
See previous comment under 3.1.1.1 - most of these substnaces are no longer authorised for use in the EU
-
Fig 3.6 shows organics that are not pesticides: 1,2-dichloroethane, trichloroethane, carbon tetrachloride
-
some of the AS shown are banned since many years in teh EU (atrazine, DDt, etc), however they are persistent in the enviroment and therefore obviously they will continue to appear in samples. This would need to be explained somehow (at least adding footnotes).
Please consider checking teh whole report according to this observation. Thank you
3.1.2. Emission data
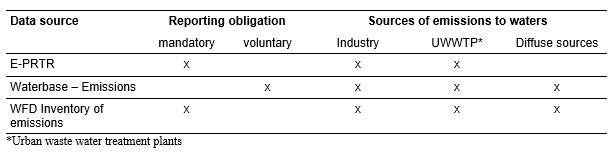
Table 3.2 shows an overview of the emission data with European coverage on pesticide loads considered in this report. The data comprise different reporting obligations and consider partly different sources of emissions to waters.
Table 3.2 Overview of used emission data
3.1.2.1. E-PRTR
E-PRTR – the European pollutant transfer and release register(EU, 2006b) is a European-wide register of pollutant releases to air, water, and on land. It covers 33 countries (EU28, Iceland, Liechtenstein, Norway, Serbia and Switzerland) since 2007. Some records are also available for 2001 and 2004 based on former EPER database (EPER - European Pollutant Emission Register) was established in 2000. It was replaced by current E-PRTR in 2006. Emissions from both point and diffuse sources are collected, but no information on pesticides from diffuse agricultural sources is available. Countries report facilities with economic activity listed in Annex I of the Directive and substance loads from point sources above threshold values given in Annex II of the Directive. All facilities under activity 4.d Chemical installations for the production on an industrial scale of basic plant health products and of biocides should be included, other facilities should report discharging into water if it exceeds the given limit (1 kg per year for most of the pesticides). The database contains annual releases (kg per year) per facility.
-
Many of the PPPs marketed and used in the EU are made abroad, and similarly many PPPs made in Europe are exported to non-EU countries for use. So, the relevancce of manufacturers is not clear.
I do not know of any EU data on this topic of manufacturing PPPs
-
(Austria): Maybe it would be good to not only put abbreviations in the chapter header. Better write: "E-PRTR - European pollutant transfer and release register"
Main pesticide discharge from facilities is not caused by those manufacturing pesticides but from urban wastewater treatment plants, which receive inputs from a range of sources (see section 2.4). It needs to be stated, that within the E-PRTR, that only the discharge of large facilities needs to be reported (e.g. waste water treatment plants above 100 000 population equivalents), and not all of them reported pesticides in their effluent.
Table 3.3 shows the list of pesticide emissions to water, the number of records (emission load from one facility within one year for given pollutant – e.g. if the emission load from two facilities is reported every year for ten years, it will result in twenty records, and the number of countries, in which these releases were reported under E-PRTR. Furthermore, information on monitoring time period, if the specific substance is still approved (Yes or No), and the count of monitored facilities are listed.
Table 3.3 Pesticide emissions to water reported under E-PRTR
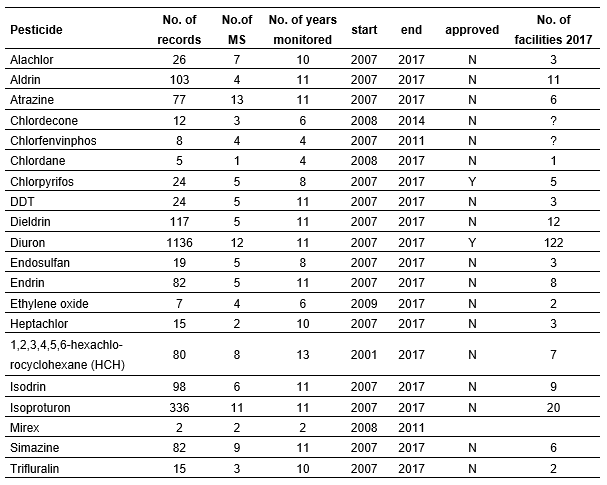
Note: 4.(d) means facilities including chemical installations for the production on an industrial scale of basic plant health products and of biocides; Water includes marine waters as well as freshwater (surface waters and groundwater).
Source: https://prtr.eea.europa.eu/#/home (EEA 2019)
-
Comment: Final check will be needed prior to publication - chlorpyrifos is recently non-approved.
-
This table and various other points in the document: Atrazine and/or metabolite and Simazine are shown although it is stated that the active substances in the report were selected from the Waterbase – Water Quality which were “approved and approval expired during the investigation period 2007 – 2017”. Both are non-approved for a longer time and do not match the definition.
Figure 3.7 shows the facilities with pesticide production and the pesticide discharge from these facilities in the time period 2007 to 2017.
Figure 3.7 Facilities with production of pesticides (PRTR activity 4.d) as main or other activity (left) and facilities discharging pesticides into water in the years 2007-2017 (right)
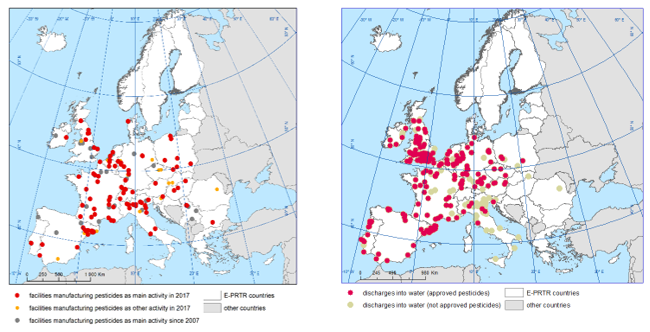
Note: E-PRTR countries = countries reported data under E-PRTR. The points only show facilities, where discharge of pesticides was reported and not the amount of discharge from these facilities.
Source: https://prtr.eea.europa.eu/, (EEA 2019)
-
(Austria): The sentence above figure 3.7 should be corrected as Figure 3.7 shows all facilities which produce pesticides AND all facilities which have pesticide discharges and not only those facilities which produce pesticides.
At least the header of Figure 3.7 says so.
Table 3.4 shows the number of facilities, which reported pesticide discharge in 2017. In contrast to 38 other facilities, 185 wastewater treatment plants are listed with discharge of pesticides into waters.
Table 3.4 Number and type of facilities reported under E-PRTR discharging pesticides into water in 2017
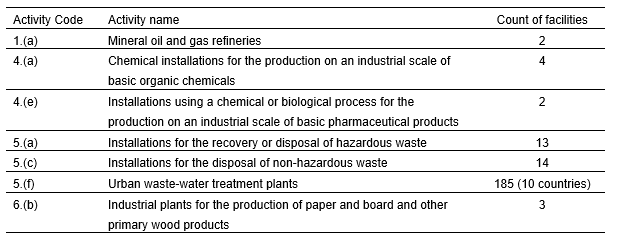
Source: https://prtr.eea.europa.eu/, (EEA 2019)
3.1.2.2. Waterbase - Emissions
Under the reporting obligation of WISE SoE – Emissions (WISE 1), EEA countries report every two to three years, and they provide the loads per year for specific substances on country, river basin, or subunit level. For the reporting, the emission load can be assigned to different types of sources. The countries can report emissions from point sources every year, and every three years from diffuse sources. The reporting has been carried out by 19 countries, but only some of them reported pesticide loads. If so, pesticide loads were mainly reported by industrial and urban waste water treatment plants (Table 3.5).
Table 3.5 Pesticide emissions reported under Waterbase - Emissions in the time period 2008 to 2017
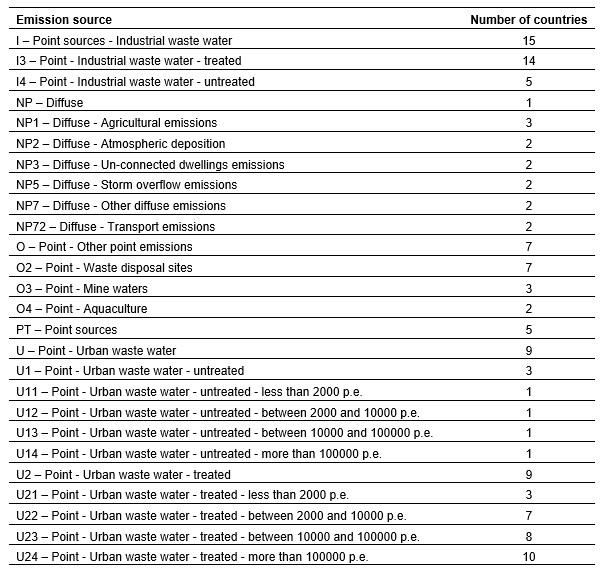
Source: https://www.eea.europa.eu/data-and-maps/data/waterbase-emissions-7
-
How are diffuse source loads estimated in the different countries? I find it odd that there is no reporting of this (unless I've missed it).
3.1.2.3. WFD Inventory of emissions
Limited information on pesticides was reported by the first inventory of emissions according to the EQSD (EU, 2008), and reported in the 2nd river basin management plans of the WFD, and only a low number of member States reported pollutant release from agriculture or riverine load (Table 3.6).
Table 3.6 Overview of pesticides of the WFD Inventory of emissions according to the WFD 2016 reporting
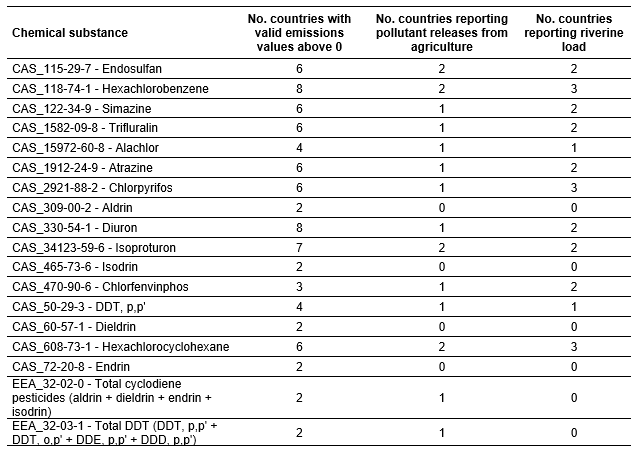
Source: ETC 2018 [1]
[1] WFD-dataset review, background document, Prepared by ETC/ICM-Deltares in 2018
-
I am a bit confused. Some of the substances in the list have been banned for decades in EU. How come countries still reports them as pollutant releases from agriculture? Are these considered legacy pollutants? If so, how are "emissions" defined?
3.2 Qualitative data sources
3.2.1. Water Framework Directive
Pesticides in waters are covered by several parts of the reporting:
- Surface water body: Priority Substances (PS) for the assessment of chemical status, and River Basin Specific Pollutants (RBSP) for the assessment of ecological status.
- Groundwater body: Groundwater pollutants for the assessment of chemical status
WFD Inventory of emissions: Emissions to water under consideration of different sources (see section 3.1.1).
3.2.2. Drinking Water Directive
The Drinking Water Directive (DWD) sets a concentration limit of 0.1 μg/l for individual pesticides, and of 0.5 µg/l for the total sum of pesticides. Because pesticides are present on a regular basis and in low concentrations, exposure to these chemicals is generally chronic. The health risk is difficult to assess, because data on acceptable doses for chronic exposure are scarce and the low concentrations involved are difficult to monitor (European Environment Agency 2016).
Under the Drinking Water Directive countries report every three years on the quality of drinking water. The data are localised at ‘Water supply zones’, which are the places where the water is used with no information on where it comes from. Exceedances of selected pollutants from drinking water standards are reported. Last reporting in 2018 cover years 2014-2016, next is due to 2021. Results from the years 2010-2013 were described in the Commission report (EC 2016).
-
"pesticides are present on a regular basis" This is not clear from the data presented up to this point, so I suggest to delete "on a regular basis"
-
(Austria): The 3rd sentence is also true for surface and groundwater and not only for drinking water, where it is explicitly emphasised.
-
This statement could be valid for the a.s. but not for the metabolites. In fact, in the EU pesticide risk assessment where predicted environmental concentrations in groundwater need to be provided based on mathematical models, it is more likely that the drinking water limit is exceeded by the metabolites rather than the active substance,
-
The statement about the lack of acceptable doses is rather incorrect. Data on acceptable doses for chronic exposure should be available for all pesticides assessed, i.e. approved and not approved following an EU assessment.
-
1st paragraph: This statement is misleading and incorrect. The health risk from pesticides in drinking water is not difficult to assess - for each and every pesticide on the market there are certainly enough toxicity data to define a reliable chronic ADI. These ADIs are generally orders of magnitude higher than the limit value of 0.1 µg/L, and this very EEA report shows that compliance with that limit value is very close to 100% - it is completely misleading to insinuate chronic pesticide exposure at relevant concentrations via drinking water. And finally, there are certainly no analytical problems anymore for a long time to monitor drinking water at the level of 0.1 µg/L.
For reporting purposes, a short list of pesticides as well as total pesticides was agreed between European Commission and Member States:
- Atrazine CAS 1912-24-9
- Atrazine-Desethyl CAS 6190-65-4
- Bentazon CAS 25057-89-0
- Bromacil CAS 314-40-9
- Diuron CAS 330-54-1
- Isoproturon CAS 34123-59-6
- MCPA CAS 94-74-6
- Mecoprop CAS 93-65-2, former CAS 7085-19-0
- Pesticides total (this parameter includes also other national monitored pesticides beside the short list)
- Simazine CAS 122-34-9
- S-Metolachlor CAS 87392-12-9
- Terbutylatrazine CAS 5915-41-3
The short list is a harmonised approach and makes reporting comparable but does not show the full picture of all pesticides and all relevant metabolites in a country. Member States monitor a considerable number of pesticides and metabolites (degradation and reaction products) in drinking water that are chosen at national level and are thus specific for each Member State. However, only those pesticides that are likely to be present in a given supply need to be monitored.
-
Typo - bentazone, appears in other sections also
-
lists S-metolachlor
S-metolachlor is a optical isomer that is not analysed, just melolachlor is usually analysed (mixture of optical isomers), in order to analyse S-metolachlor a special chiral analysis must be utilised to distinguish optical isomers. I would put an appropriate remark in the text at least or change S-metolachlor to metolachlor in order to keep consistent substance naming throughout the whole report (other chapters use metolachlor)
For the presented short list of pesticides, the number of records with exceedances for each water supply zone and the compliance rate is available.
Based on available data of DWD reporting of the time period 2014 - 2016, the short list of pesticides was monitored in about 60 % out of 9500 large Water Supply Zones in Europe, (Figure 3.8). This is an increase in comparison to the period 2011 - 2013, when pesticides were monitored in below 30% of Water Supply Zones (European Environment Agency 2016). Based on the amount of monitored Water Supply Zones, no information on pesticide risk of drinking water can be derived. The compliance rate of pesticides is shown in section 4.2.2.
-
2nd paragraph: we believe a 60% monitoring rate in large water supply zones does allow to derive information on pesticide risks to drinking water.
Figure 3.8 Share of water supply zones, in which pesticides were monitored according to the Drinking Water Directive 2016
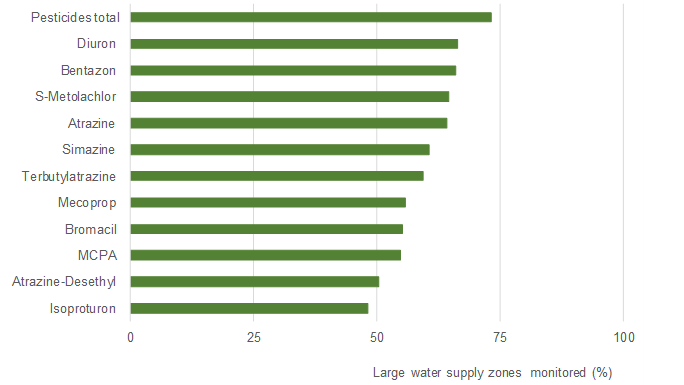
Source: DWD reporting 2014-2016, https://rod.eionet.europa.eu/obligations/171
-
Possibly mecoprop-p, which is approved.
mecoprop is non-approved
-
S-metolachlor is a optical isomer that is not analysed, just melolachlor is usually analysed (mixture of optical isomers), in order to analyse S-metolachlor a special chiral analysis must be utilised to distinguish optical isomers (this applies to all optical isomers such as Mecoprop-P, MCPP-P). I would put an appropriate remark in the text at least or change S-metolachlor to metolachlor in order to keep consistent substance naming throughout the whole report (other chapters use metolachlor).
3.2.3. Other water related Directives
The data flows for other water related Directives do not include pesticide data:
- Urban Waste Water Treatment Directive (91/271/EEC)
- Bathing Water Directive (2006/7/EC)
- Nitrates Directive (91/676/EEC)
- Floods Directive (2007/60/EC)
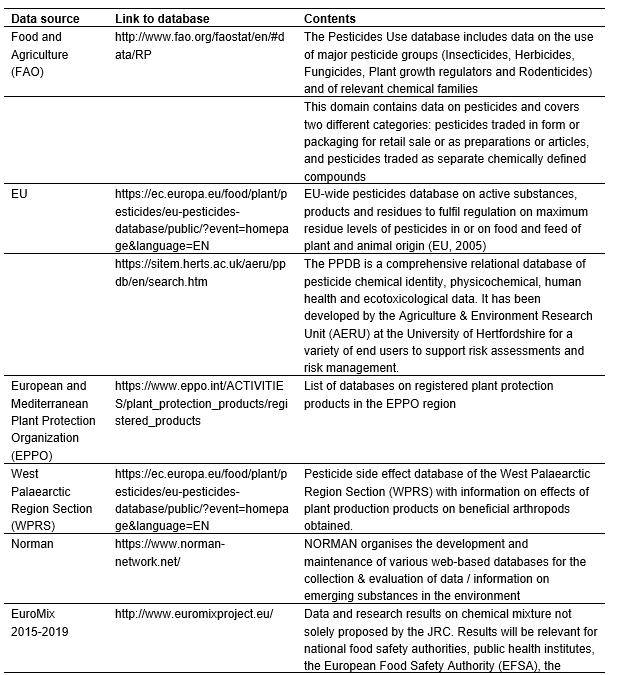
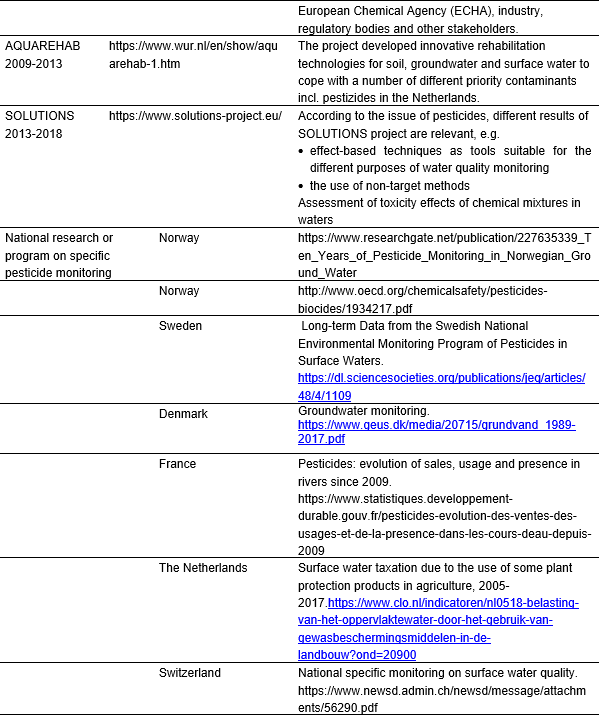
3.3. Other data sources
There are many studies which have investigated pesticide pollution. Other data of European or worldwide coverage focused on the collection and assessment of pesticide contaminations were considered for the literature analysis (Table 3.7). Furthermore, pesticides data sources of European countries on pesticides are available, which focus on the registration of plant production products (see Annex 4). Box 2 shows an example on specific monitoring program for pesticides in Germany.
Overall, data availability from scientific projects are diverse and their quality may vary. Furthermore, sampling sites or research activities were mainly focussed on specific areas or model regions, which make comparison with routinely monitored sites rather difficult. The findings of such research projects can help to fill knowledge gaps but are less useful to fulfil data gaps in studies of temporal and spatial pesticide contamination.
Table 3.7 Overview of other data sources attributed to pesticide registration, research and national activities
-
Have you not considered OpenFoodTox? <a href="https://www.efsa.europa.eu/en/microstrategy/openfoodtox" rel="nofollow">https://www.efsa.europa.eu/en/microstrategy/openfoodtox</a>
Box 2 Example on pesticide research project: Nationwide monitoring of small streams in Germany
One of the objectives of the German National Action Plan (NAP) on Sustainable Use of Pesticides (to implement Directive 2009/128/EC) requires a representative sampling of small water bodies. Furthermore, by the year 2023, 99 % of the event-driven monitoring samples of one year should comply with the regulatory acceptable concentration (RAC) regulated within the authorization of pesticides.
Streams may be sampled for chemical analysis once a month, with pesticides seldom being found, even during the application period. However, when samples are taken event controlled with a rise of the water level of 5 cm and after pesticide application (= “event-driven”), pesticides are found much more often. Until now, such sampling was made in scientific studies only, e.g. (Liess, et al., 1999; Moschet, et al., 2014; Gustavsson, et al., 2017). To determine the proportion of RAC exceedances for the German NAP, a concept was developed for the representative monitoring of pesticides in small waters in the agricultural landscape (Szöcs, et al., 2017). The German Environment Agency (UBA), together with the Helmholtz-Centre for Environmental Research (UFZ) and in close cooperation with the state authorities, has conducted two sampling campaigns in 2018 and 2019.
The aim of the monitoring program is to realistically assess the input of agriculturally used active substances into small water bodies, which are currently not monitored within the Water Framework Directive (2000/60/EG). Catchments with an area of <30 km², an agricultural proportion of > 40 %, and a distance of at least 3 km to wastewater treatment plants upstream of the sampling sites were selected. The distribution of the 120 sites across the individual Federal states of Germany was based on the respective percentages of agricultural land. Each site was sampled once between spring to early summer over the course of the two years. To accurately capture the pollution of the waters and assess the resulting risk to the aquatic community, automatic, event-driven sampling after the occurrence of rain events - in addition to grab sampling - was put into practice. A uniform substance list of over 90 active substances and 40 metabolites was analysed.
The first results of the sampling campaign 2018 at 60 monitoring sites indicate that measured pollution exceeds RACs for one or several substances in more than 50 % of the event-driven samples. These exceedances occurred at more than 80 % of the monitoring sites. At about 40 % of the sites 5 or more RAC exceedances occurred. Rain events triggering the sampling devices occurred at 90 % of the sites within the sampling period from spring to early summer even in the very dry year 2018, capturing at most 9 consecutive events at two sites.
11 of the monitored pesticides are regulated under the WFD with maximum EQS. With event-driven sampling at 6 % of the monitoring sites were found 17 exceedances of these EQS. With regular monthly grab sampling at 3 % of the monitoring sites were found 8 exceedances only.
-
authorization - US spelling, appears in other sections also
-
This is interesting and worrying at the same time. However, it would be appropriate to understand:
- are the RAC uniquely based on tier-1 (lab) data or is there consideration of higher tier studies?
- Was the predicted risk following the use in the area also high (model simulations also predicted an exceedance of the RAC) or not?
- Were mitigation measures, if required by the label, implemented?
-
2nd paragraph - "...the representative monitoring of pesticides in small waters in the agricultural landscape...": the term representative monitoring should not be used here as these are targeted "event-driven" point samples. Representativeness can only be achieved if several samples distributed over the year are taken.
3.4. data availability, gaps and uncertainties
Waterbase – Water Quality database includes the largest volume of concentration measurement data available from the European Environment Agency, covering about 180 different pesticides. Data include single measurement (so called “disaggregated”) data and aggregated data (including yearly mean, minimum, maximum and limit of quantification [LOQ] of pesticide concentrations).
The most prominent uncertainties in the Waterbase – Water Quality dataset are inconsistent reporting of limit of quantification (LOQ) values and inconsistent time series of the data from individual monitoring sites. Due to different requirements of European reporting, the LOQ has been reported either as flags or different values (inconsistent reporting of full LOQ values vs half-LOQ values according to the requirements of the European water quality directives, e.g. Directive 2009/90/EC), and in some cases no data regarding the LOQ is available for a record at all (see also section 3.1.1.3). This increases uncertainty in determining measurements that are below LOQ, needed for analyses such as EQS exceedance. Also, LOQ values that were indeed reported vary within the substance, in various cases within the country and year as well. Another inconsistency lies in reporting of the data from the same monitoring sites through time, which would compose consistent time series of comparable data. Instead, the data for many monitoring sites were not reported for more than a few years, which disperses spatial and temporal coverage of the dataset and makes trend analysis less credible.
-
Another uncertainty is the potential mismatch between substances applied and substances monitored in a certain area, unless there is some way for aligning this.
-
In principle, we agree with the statement about lack of data over multiple years, particularly for groundwater data. However, any temporal trend data in surface water will only be credible in rather big water bodies, where input are coming from a rather large and diverse watershed. The situation in smaller water bodies is much more dynamic over a single year than it is across several year, therefore making a long-term analysis rather pointless.
-
HU:
In part 3.4 data uncertainties are discussed, Hungary has reported all disaggregated values according to Directive 2009/90/EC.
Emission data (E-PRTR, Waterbase - Emissions, Inventory of emissions) offer limited information on pesticides. Their substance lists are restricted and do not include many pesticides. E-PRTR thresholds, which set volume limits below which it is not necessary to report, mean that only the largest sources are reported. Diffuse sources - which are likely to be very important for pesticides - are not included or only roughly estimated in these inventories. For most substances the inventories include only a very low share of all emissions of the addressed substances.
Qualitative data on pesticides according to the chemical and ecological status assessment under the Water Framework Directive is restricted at European level to the six yearly WFD reporting cycle. Latest 2016 reporting requirements included substances causing failure of chemical status of surface water bodies. For these priority substances EU-wide EQS (ecological quality standard) values were regulated and therefore failings of good chemical status are comparable. This is also valid for groundwater pollutants to assess the chemical status of groundwater bodies. Much more pesticides are listed under the river basin specific pollutants to assess the ecological status of surface waters. For those substances, EQS were regulated on a national basis and therefore differ between Member States. Assessments with these EQS might be not comparable.
-
HU:
On page 31, in the second paragraph EQS is called „ecological quality standard”, while its correct name is “environmental quality standard”.
Qualitative data reported under the Drinking Water Directive (DWD) focus on a short list of pesticides and their compliance with the DWD even though EU Member States monitored a broad range of pesticides in their countries. The compliance rate for each substance is attributed solely to large Water Supply Zones, whereas the reporting of compliance for decentralised small wells is not obliged under the Directive (and will also not monitored on regular frequency). Furthermore, the point of compliance (and monitoring) is not the raw water from the drinking water source rather than the point of human consumption after treatment. While the amount of compliance will give a hint to main pesticide problems within EU Member States, data are hardly comparable to other databases.
"The report focuses on pesticides, which represent a current water pollution and are still being discharged through use."
I think there is a word missing here - the meaning is not clear.
Many of the active substances in the report are not currently used, so re-wording is needed to be consistent.
Comment: 2007 is now 13 years ago - perhaps better to focus on more recent data only?