
Table of contents
- General comments
- List of abbreviations
- Glossary
- Key messages
- Executive Summary
- 1. Introduction
- 2. Policy on water scarcity and drought
- 3. Impacts of climate change on water availability
- 4.Freshwater consumption in Europe under socio-economic change
- 5.Water stress in Europe
- 6.Needs for integrated policy responses
- 7.Conclusions
- References
- Annex : Recent EU innovation projects for water stress management
5.Water stress in Europe
Key messages
- Water stress in Europe affects more than 13 % of the total area permanently and up to 32 % of the total area seasonally since 1990.
- In parts of the EU, increasing water use efficiency will help to keep pace with average climate change. In other regions, which in many cases are already water stressed now, water use is increasing and water availability is decreasing.
- In all of the EU, climate variability is expected to increase, while urbanisation leads to a concentration of water demand in urbanizing areas. The expected outcome is that in southern Europe water stress problems remain persistent, while in other, increasing areas of the EU, water stress will make itself felt irregularly but with increasing frequency and impact.
5.1. Current water stress in Europe
Using water exploitation index plus (WEI+)([1]) as indicator of water stress, at least 13 % of the European territory suffers from all year round water stress conditions, and at least 120 million people are affected permanently by significant water stress in these areas (Figure 5.1). Furthermore, many areas in Europe are affected by seasonal water stress, which recurs usually during the driest season of the year (typically in summer). Since the 1990s, 32 % of the European territory was affected during at least one year by significant water stress, while 300 million people were affected by water stress in at least one year (based on (EEA, 2018b) results) (Map 5.1).
Figure 5.1 Population and area exposed to water stress conditions in Europe (summers 1990-2015)
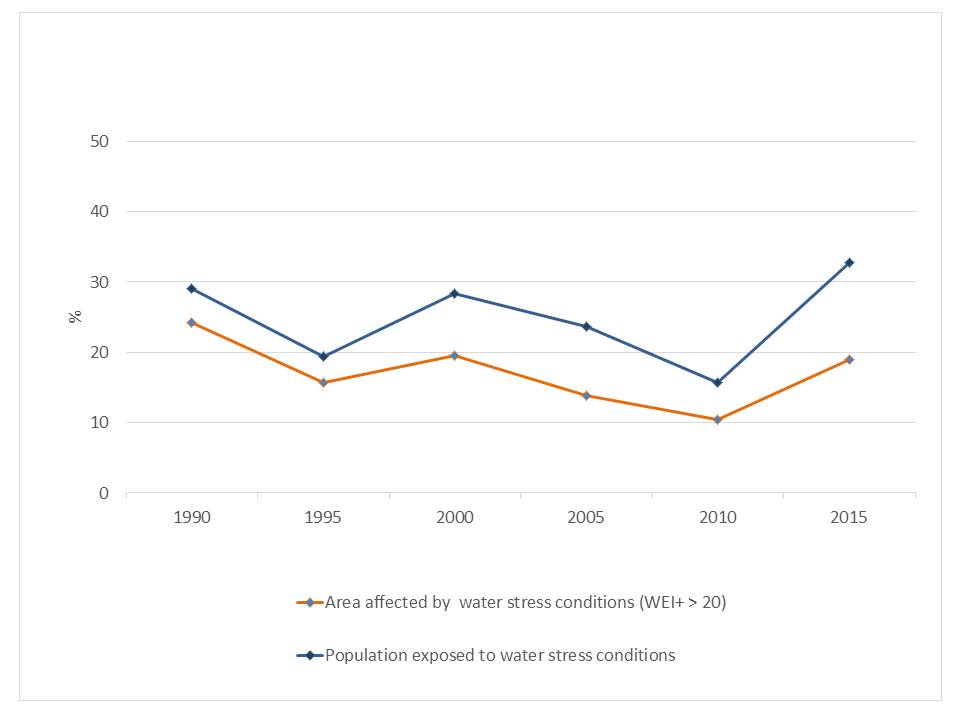
Source: (EEA, 2018b)

Southern Europe is the most affected region (Map 5.1), with approximately 30 % of its population living in areas with permanent water stress and up to 70 % of its population living in areas with seasonal water stress during summers. On the one hand, this is a result of naturally occurring low water availability and aridity, which are embedded in the local climate. On the other hand, the water consumption by human activities, such as agriculture, electricity production and public water supply, is frequently significantly higher than the local renewable freshwater resources.
The pressures are particularly high between April and September, when water demand for agriculture, drinking water supply, and tourism or recreation, reaches a seasonal peak. Severe water stress problems are usually observed in areas with intense agricultural activities, which show high shares of irrigated land and high application of irrigation water, fertilisers or pesticides. In this context, agriculture causes water stress because of depletion of natural water sources (e.g. river dry-up, critical decrease of groundwater levels) or because of pollution of local freshwaters (e.g. high concentrations of pollutants, exceeding legally required water quality levels). Agriculture-driven pollution can make water resources non-suitable for other purposes (e.g. drinking water), unless significant costs are paid for their treatment. Severe water stress problems are also observed in coastal areas, because of high concentrations of human activities, including tourism. In such areas, local freshwater availability is usually low compared to the required water supply. In addition, the local water sources are vulnerable to saline intrusion. Therefore, pollution and poor water quality can also be a reason for local water stress issues in various parts of Europe.
Furthermore, water stress issues increasingly occur in parts of western, eastern and northern Europe also. Compared to the average regional conditions, water stress levels are generally high in the wider area of Copenhagen (Denmark), London – Thames (UK) and Stockholm (Sweden), and the river basins of the Loire (France), Meuse (France-Netherlands-Belgium), Weser (Germany) and Oder (Germany-Poland), as well as in several sub-basins of Hungary, Romania and Bulgaria. This is usually a result of urbanisation, rising living standards and locally significant demand for public water supply and cooling water used in the industry and energy sectors.
Between 1990 and 2017 the abstracted volume of water in the EU27+UK declined by 9 % and in the EEA39 by 17 % (EEA, 2018b). Furthermore, between the first and second cycle of WFD implementation (2010 versus 2016), the area of groundwater bodies affected by over-abstraction decreased by around 7 % (WISE WFD data viewer). These overall trends are encouraging because they show a tendency to reduce the pressure from water abstraction in Europe. However, it should not be missed that water stress is a local and seasonal issue. Thus, overall reductions are not always informative on the actual severity of the problem at finer spatial and time scale. Similarly, water stress in rainfed agriculture and in rain-dependent nature areas is not or hardly mitigated by reduced water abstractions.
5.2. Future projections of water stress in Europe
Water stress in Europe is expected to further worsen in the future, as a result of climate change and socio-economic development. The JRC has modelled two different emission scenarios, resulting in three global temperature increases, with 3 oC as the highest, compared to pre-industrial levels (JRC, 2020b) (Map 5.2). For an increase in global temperature by 3 oC, the conditions of significant water stress will be extended and intensified in southern Europe, as well as in other parts of Europe, including areas in Bulgaria, Romania, France, Belgium, Germany and Poland. Moreover, the duration of seasonal water stress is projected to increase up to a month, with the highest increase expected in the Iberian peninsula and other parts of the Mediterranean. In these calculations it was assumed that the water use of the economic sectors increases with the ratio of GDP growth, so increasing water use efficiency was not included.
Map 5.2 Areas in Europe with additional water stress in the future under a temperature increase of 3 oC.
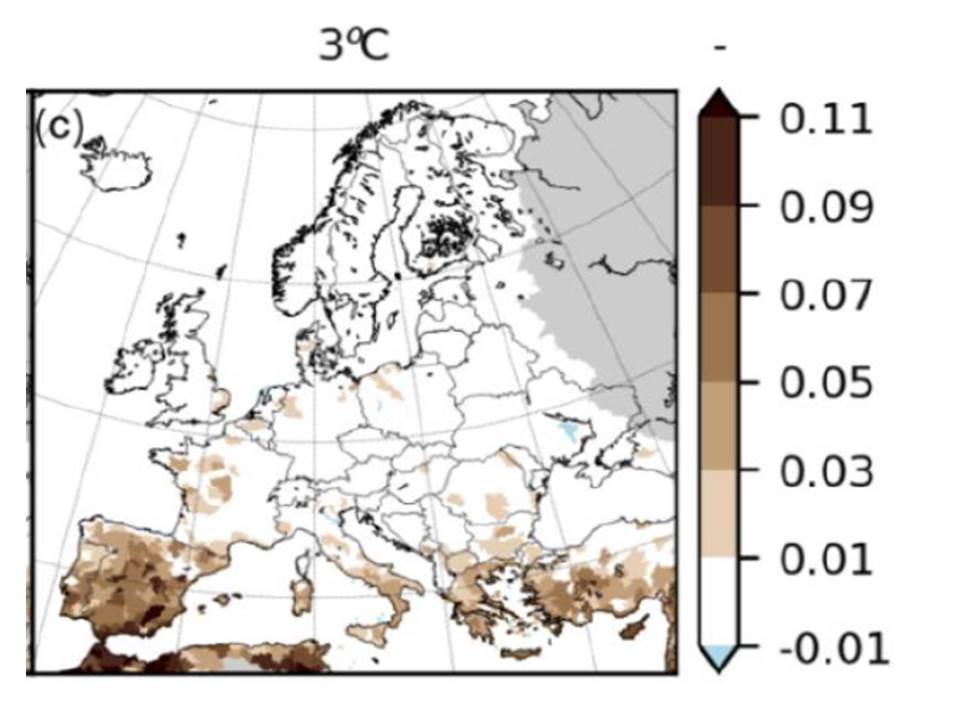
Source: (JRC, 2020b)
Combining the findings from the two previous chapters, the following estimate of the difference between water demand and water availability emerges, and how it will develop over the coming decades.
The impacts of climate change on water availability
As a result of climate change, average water availability in surface water and groundwater bodies is expected to increase in north-eastern Europe, decrease in southern and south-western Europe, while mixed patterns are expected in the central parts of Europe. Under the 3 oC temperature increase scenario (SCP 8.5), the mean summer discharge in Spain and other parts is estimated to become 20 to 40 % lower than it is now. In parts of the other Mediterranean countries the impact is less pronounced, but with reductions in the order of 10 to 20 % still very significant (JRC, 2020b). Aquifer recharge follows roughly the same pattern.
The potential of water saving measures
According to the available data (Figures 4.11, 4.13 and 4.16), over the 17-year period 2000 to 2017, water abstractions in EU27+UK have dropped by some 24 % while GVA increased by 52 %. No attenuation of the growth in water use efficiency is yet visible. The estimates of potential savings outlined in Chapter 4 are in the same order of magnitude. With an overall GDP growth rate of 1.3 % per year (EC, 2015c) and assuming that GDP growth is at the same level as NVA growth, the net decrease in water demand is estimated at 1.2 % per year. Words of caution are in place here:
- the collected data on water consumption are not covering all Member States and are partly based on proxies;
- general estimates at the level of the whole EU do not represent the actual local impact of water stress. An example: in Sections 4.3 and 4.6 it was pointed out that the increase of irrigated area and in per capita household water use is the strongest in southern Europe, which already is the most water stressed region in Europe.
- these estimates must be taken for what they are: rough indications of the direction that water stress is taking.
That said, there are clear signs that water is being used more efficiently in the European economy. This makes some room for better accommodation of environmental water demands (which have not yet been assessed at EU level) and for climate change impacts.
Comparison of the potential water savings with expected changes in water availability and water demand shows that in some parts of Europe, the current pace of water saving in the economy is sufficient to compensate for the decrease of water availability as a result of climate change. Environmental water demands have not been accounted for in this comparison. The water uses that directly depend on precipitation, such as rain-fed agriculture and terrestrial nature, do not benefit from these water savings. The impacts of increasing climate variability and spatial concentration of water demand for households and industry, too, are not mitigated by increased water use efficiency.
[1] WEI+: the Water Exploitation Index Plus. The WEI+ is defined as the total water net consumption (abstractions minus returns) divided by the freshwater resources of a region, including upstream inflowing water. WEI+ values have a range between 0 and 1. Values below 0.1 denote “low water stress”, values between 0.1 and 0.2 denote “moderate water stress”, “water stress” when this ratio is larger than 0.2, and “severe water stress” if the ratio exceeds 0.4 (Feargemann, 2012).