
Table of contents
- General comments
- List of abbreviations
- Glossary
- Key messages
- Executive Summary
- 1. Introduction
- 2. Policy on water scarcity and drought
- 3. Impacts of climate change on water availability
- 4.Freshwater consumption in Europe under socio-economic change
- 5.Water stress in Europe
- 6.Needs for integrated policy responses
- 7.Conclusions
- References
- Annex : Recent EU innovation projects for water stress management
4.Freshwater consumption in Europe under socio-economic change
- The environment is not sufficiently protected from water abstraction, as the definition and implementation of e-flows, and the subsequent revision of water permits, are lagging behind.
- 62 % of rivers, 51 % of lakes, 61 % of transitional waters and 51 % of coastal waters were not in good ecological status in 2015 (EEA, 2018c).
- 75 % of freshwater habitats in Europe were not in favourable conditions in 2020 under the Habitats Directive (EEA, 2020g).
- Two thirds of European wetlands were lost before the 1990s and their area has subsequently decreased, but the loss seems to have levelled off between 2006 and 2012 (EEA, 2020b).
- Agriculture remains the most prominent driver of water abstraction in Europe, because of high water consumption in irrigated agriculture in the south, but the sector shows signs of decoupling from growth in southern, western and northern Europe.
- The installation of renewable energy sources has contributed to significant reductions in water abstraction in the energy sector, because of replacement of combustion plants. Western Europe shows significant trends of decoupling water consumption in the energy sector from sectorial growth.
- The water consumption in the industrial sector is decreasing, while the value of industrial production continues to grow in western, northern and eastern Europe, suggesting a trend for decoupling.
- The public water supply sector achieved significant water savings overall in Europe. However, the volume of public water supply increased in southern countries and tourism has posed significant local pressures, especially in the Mediterranean.
- Shifting sectorial water management towards a more sustainable paradigm entails a series of challenges, because of the trade-offs between making a sector less water intensive and keeping up its production levels.
- Sustainable water management needs to rely more on water demand management, supply from alternative water resources, circular and nature-based solutions.
4.1. Freshwater consumption in Europe
Approximately 266 000 million m3 of water were abstracted in Europe (EEA38+UK) in 2017 to serve the needs of the different sectors of the European economy. This is nearly 9 % of the annual renewable freshwater resources in Europe. After its abstraction, water is transported, treated, distributed, used in production processes, partly evaporated and transpired, and partly integrated in products. Intermediate losses, unused water and wastewater finally find their way back into the environment as returns. In 2017, around 40 % of the total abstraction was consumed and 60 % of the total abstraction was returned before or after use to the environment. Water returned to the environment may have its physical or chemical properties altered (e.g. higher temperature, pollution). The percentage of abstracted water that is returned differs greatly among sectors. In the agricultural sector it is 30 to 40 %, the returns of cooling water from the industrial and energy sector can be up to 80 %, while hydropower returns almost 100 % (EEA, 2018b) (Figure 4.1).
Figure 4.1 Development of water abstraction and water consumption in EU27+UK (2000 – 2017).
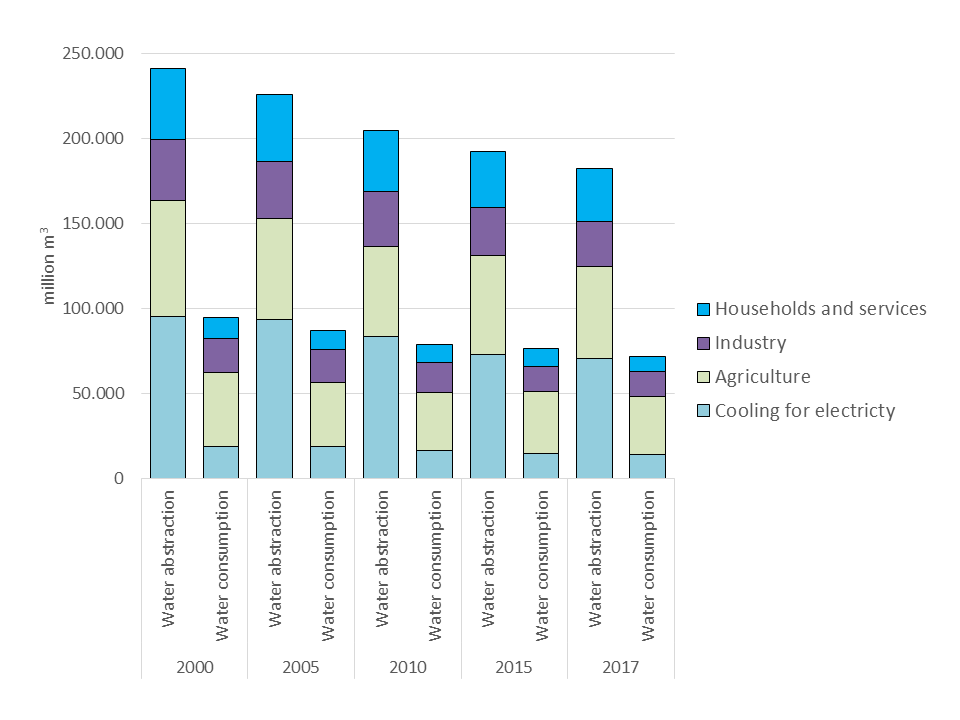
Source: (EEA, 2020j, 2019l; Eurostat, 2020f)
4.1.1. Freshwater abstraction by source of water
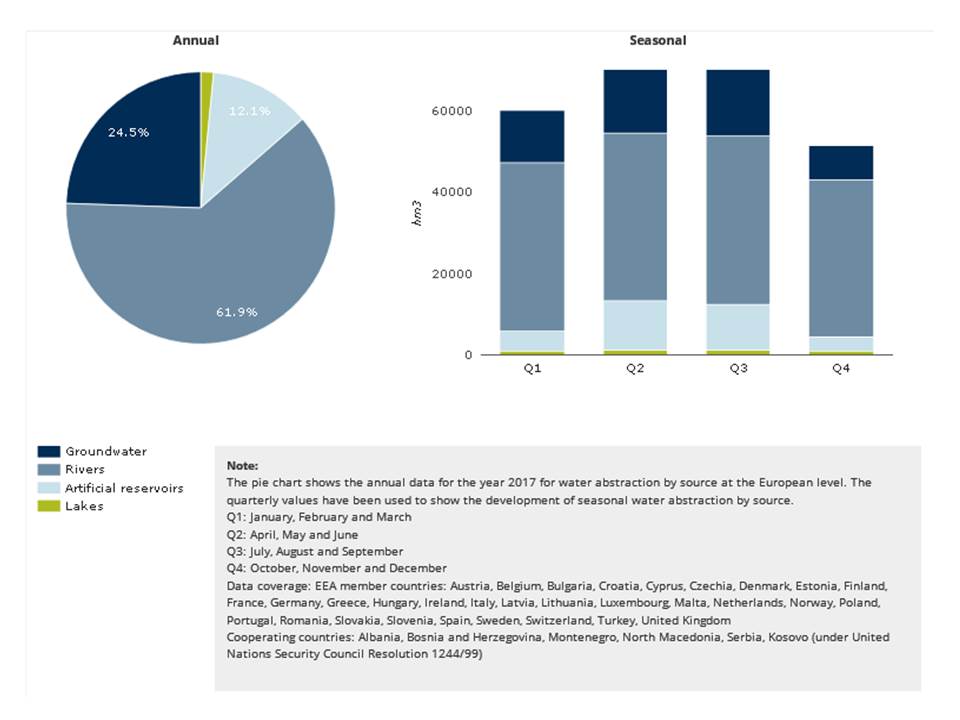
On average, rivers meet 62 % and groundwater 25 % of total water abstraction in Europe (Figure 4.2). Groundwater is mainly used for drinking water supply and agriculture. Around 12 % of the total volume of abstracted water is taken from artificial reservoirs and 1 % from natural lakes. The pressure on surface and groundwater resources is higher in spring and summer, due to the abstractions by agriculture and public water supply. In autumn and winter, the highest pressure, especially on rivers, is from abstractions for cooling water for the energy and manufacturing sectors (EEA, 2018b).
4.1.2. Freshwater consumption by socio-economic sector
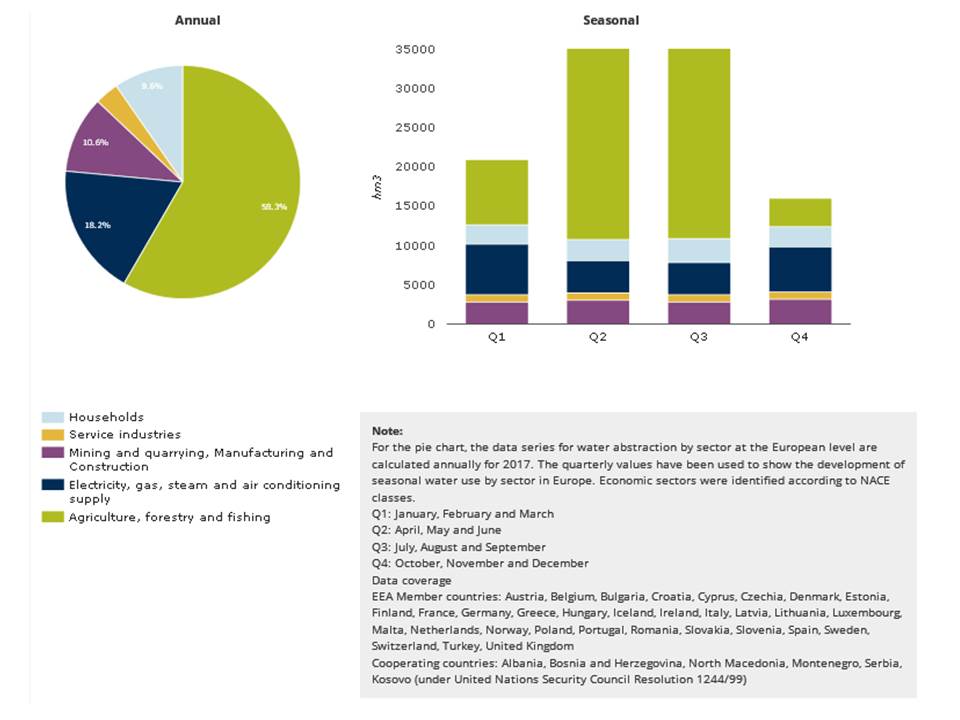
In 2017, the sectorial break-down of water consumption was: agriculture (58 %), cooling water for electricity production (18 %), mining, quarrying, construction and manufacturing industries (11 %), households (10 %) and services (3 %) (EEA, 2018b).
There are significant regional differences in the break-down of water consumption. In western and eastern Europe, electricity production is the major water using sector, using water for cooling. In southern Europe it is agriculture, and in northern Europe manufacturing. Coal mining has been an important economic sector and water user locally in certain European areas (e.g. southern Poland, north-western Greece). Furthermore, total water consumption almost doubles during spring and summer compared to autumn and winter, because of the high demand of agriculture during the summer half year (Figure 4.3) (EEA, 2018b) .
4.2. Socio-economic trends affecting water consumption in Europe
4.2.1. Economic growth
Economic development drives the water demand from industry and services and associated electricity production, although not in a linear manner. The potential Gross Domestic Product (GDP) is projected to increase by 1.3 % per year in the period 2016-2070 in EU27+UK (EC, 2018c). This growth will not be reflected linearly in water demand because of increasing water use efficiency and decoupling (Figures 4.11, 4.13 and 4.16) and a shift towards renewable energy sources. Furthermore, there is an EU-wide trend of an increasing share of the GDP covered by the services sector (EC, 2015c), a sector which is less water-demanding than others.
4.2.2. Population change
Between 1990 and 2017, the European population (EEA38+UK) increased by 11 %. The highest increase was in southern Europe (+17 %), followed by northern (+13 %) and western Europe (+11 %). In eastern Europe the population decreased by -6 %, due to migration to other countries (Eurostat, 2020c). Roughly 200 million people have migrated from one place of Europe (EEA38+UK) to another between 2000 and 2019 (Eurostat, 2020d). Immigration to Europe (EEA38+UK) from foreign countries intensified in the last decade. The 2018 Ageing report (EC, 2018c) projects the annual net migration inflows to the EU to decrease from about 1.5 million people in 2016 to 821 000 people by 2070 or 0.2 % of the total population.
Over the last 70 years, the urban population in Europe has increased from around 55 % to around 70 % of the total population. Urban areas are attracting people of younger ages, who come to cities to study and work, whereas aged people tend to move into the periphery of urban centres and in peri-urban areas (EEA, 2017d). Currently, the most populated urban areas in Europe at NUTS3 level are Istanbul, Madrid, Rome, Berlin, Lisbon, Nord-Pas-de-Calais and Stockholm (Eurostat, 2020d).
Assuming that fertility rates, life expectancy and migration rates remain constant, then the population in Europe (EU27 + UK) is projected to increase in a slow rate until around 2030 and then decrease gradually by 30 % by 2100. The population in Europe is also aging, as the fraction of people over 65 years old is projected to increase significantly over the same period (EEA, 2016f).
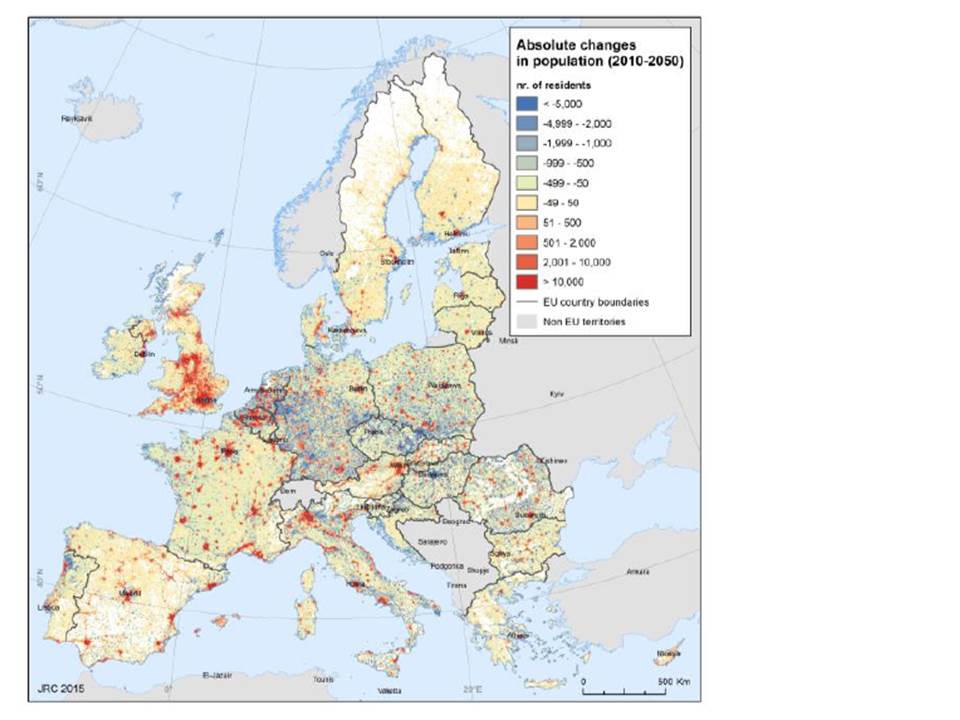
The urban population is projected to reach 80 % of the total population around 2050 (EEA, 2017d). The major urban centres of western and central Europe are projected to show the highest increases in their population (Map 4.1).
Box 4.1 Population growth as a prominent driver of urban sprawl and higher water consumption in Stockholm
Sources: (Eurostat, 2020d; EEA, 2109, 2018b)
The metropolitan region of Stockholm shows a 30 % increase between 2000 and 2019 (+1.4 % per year on average) with over 500 000 inhabitants added during the last 20 years. In the same period, 400 km2 of artificial surfaces was added. Along with this population growth and urbanisation Stockholm also shows a significant share of water consumption compared to renewable freshwater resources: it usually exceeds 10% in summers (WEI+ indicator results).
Box 4.2 Population concentration and growth as prominent drivers of higher water demand offsetting increases in water supply in Istanbul
Sources: (van Leeuwen and Sjerps, 2016; Altinbilek, 2006)
Istanbul is the largest urban agglomeration in EEA 38 and it is classified as a megacity (i.e. a city with a population over 10 million people). Istanbul gathers a population of more than 15 000 000 million inhabitants. It shows a total population increase of 36 % in the last decade (1.7 % annual average growth).
Although not a “naturally dry” area, water scarcity is a local issue due to population concentration and increase over time. Despite the enormous efforts to increase water supply, the projected future urbanisation and population growth, together with climate change, will increase water demand further.
Figure 4.4 Water supply and demand in Istanbul, 1990-2040
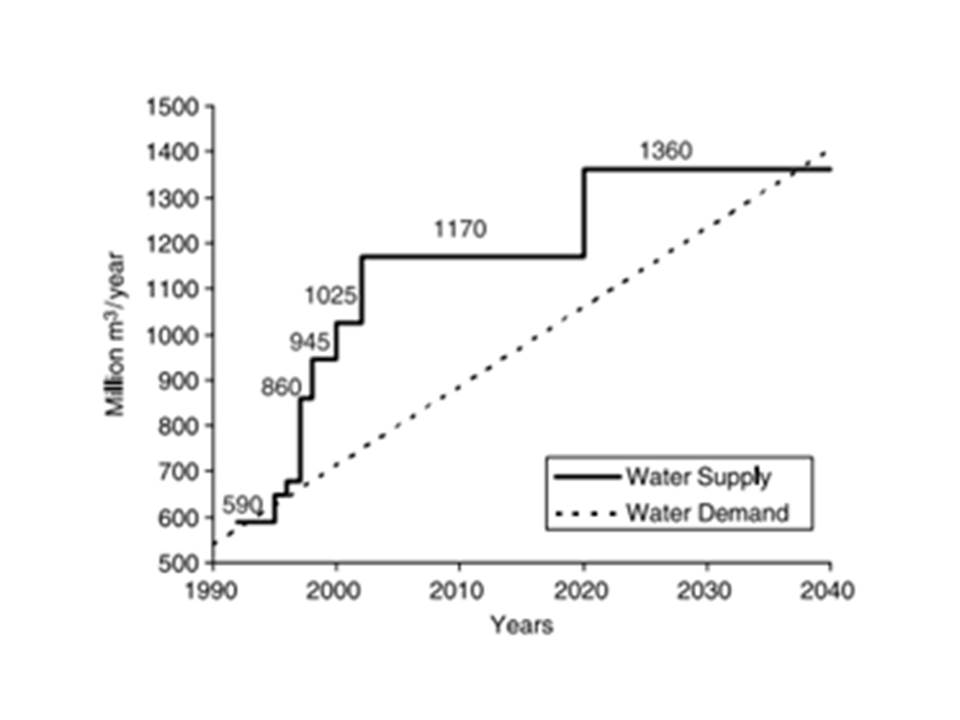
Source: (Altinbilek, 2006)
4.2.3. Freshwater consumption patterns
In 2017, the water consumption by all economic sectors in Europe averaged per European citizen[1] was estimated at 370 litres/day/person, but there are large regional differences. For example, in southern Europe, the average water consumption is much higher at 707 litres/day/person (EEA, 2018b).
People use water to meet basic needs, such as drinking, cleaning, washing and personal hygiene, as well as to support specific consumption patterns, such as dietary/lifestyle patterns and recreation purposes. In addition, water use by humans is both direct (e.g. using tapped or bottled water) and indirect (e.g. water embedded in foods and beverages or participating in production processes for commodities). Therefore, the total number and the spatial distribution of population is an important factor, as it affects the demand for public water supply, as well as the demand for food and other products, and water needed for their production and supply.
However, due to human mobility (e.g. tourism, work migration), water use in one place does not necessarily occur by people living permanently in the same place. Similarly, due to trade, water use for the production of commodities, does not necessarily occur where the commodities are consumed. In a globalised environment the linkages between local water, food and material demand, local water use and local water stress can be very complex. Therefore, the water stress problems observed in Europe do not necessarily reflect the level of water consumption in the water-stressed areas or within Europe in general. Similarly, the water stress problems in areas of other continents can also be related to the consumption patterns occurring in Europe.
The average water footprint of food consumption (dietary patterns) in the EU is estimated at 5,730 litres/capita/day (Vanham et al., 2013). However, the average water footprint per capita in the Mediterranean (3,280-5,790 litres/capita/day) (Vanham et al., 2016) is much higher than in Scandinavia (2,940-3,550 litres/capita/day) (Vanham et al., 2017), which is partly explained by differences in bio-climatic conditions and composition of food consumption. For example, Mediterranean people have moved away from past dietary patterns, increasing their consumption of meat, dairy and processed food in the past decades. However, these products require proportionately more water than most crops for their production (Mekonnen and Hoekstra, 2012, 2011).
Overall, the average consumption of cereals, meat and dairy products per person is increasing in the EU (Figure 4.5), while Europe is one of the top consumers of these products in the world (EC, 2019e). However, not all food produced actually reaches the plate of consumers. Food waste through the whole food chain is a major concern, as it is also linked with considerable waste of water, soil and energy resources, which are being used to produce the wasted food. Currently, the average food waste in the EU amounts to 173 kg/capita/year, with 30 % occurring during production and processing and 70 % occurring in food retail, food services, or households (Stenmarck et al., 2016).
A recent outlook study until 2030 suggests that the consumption of cereals and dairy products will increase, whereas meat consumption will likely stabilise or reduce, partly because of a projected shift towards a more plant-based diet for the average European citizen (EC, 2019e).
Figure 4.5 Changes in consumption of food commodities per person in Europe, compared to the rest of the world.
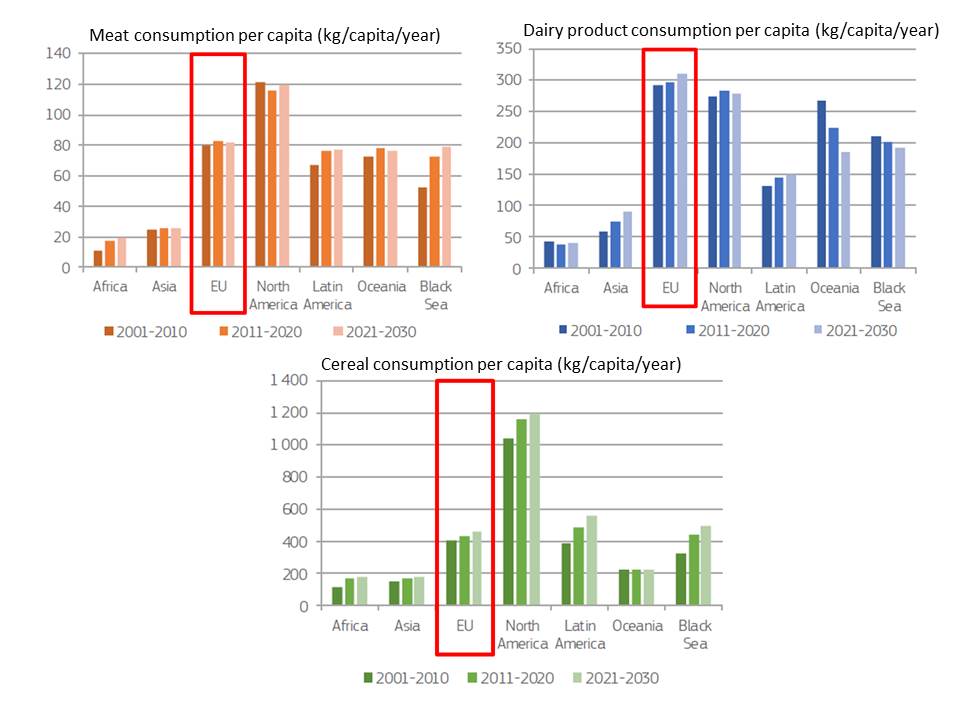
Source: (EC, 2019e)
Note: Figures do not include butter. Black Sea includes Russia, Ukraine and Kazakhstan. Latin America includes South America and Mexico.
4.2.4. Land use change
Area of urban land and soil sealing
Extended soil sealing causes serious environmental impacts. These include lower infiltration and groundwater recharge, drinking water quality problems in underlying groundwater bodies due to accumulation of urban pollutants, faster rainfall-runoff processes leading to more frequent and intense flooding. As a result of soil sealing, the soil can no longer perform many of its ecological functions in and above ground. Urban sprawl and expansion of transport infrastructure also causes fragmentation of landscapes and disturbance of ecosystems (EEA, 2019e, 2020d, 2019f).
The significance of urban areas for the European economy is increasing. Urban areas have produced 50 % more GDP than the other areas in the EU between 2000 and 2013, while employment grew by 7 % and decreased slightly in other areas (EEA, 2017d). The increase of the European urban population has led to the development of more urban and peri-urban land, and the concentration of the demand for public water supply. In 2017, the artificial land cover, which includes residential, industrial and commercial land and transport infrastructure connecting areas, exceeded 4 % of the total land cover (EEA, 2109). The Netherlands, Belgium, France, Germany, the UK and Italy (particularly the Po river basin) are significant hotspots of urbanised/artificial land, while recent trends of urbanisation (2006-2015) show high rates of land conversion in France, Spain, eastern Europe and Turkey. Between 2000 and 2018, 78 % of the artificial land conversion in the EU27+UK affected arable lands and permanent crops, pastures and mixed farmlands, and grasslands.
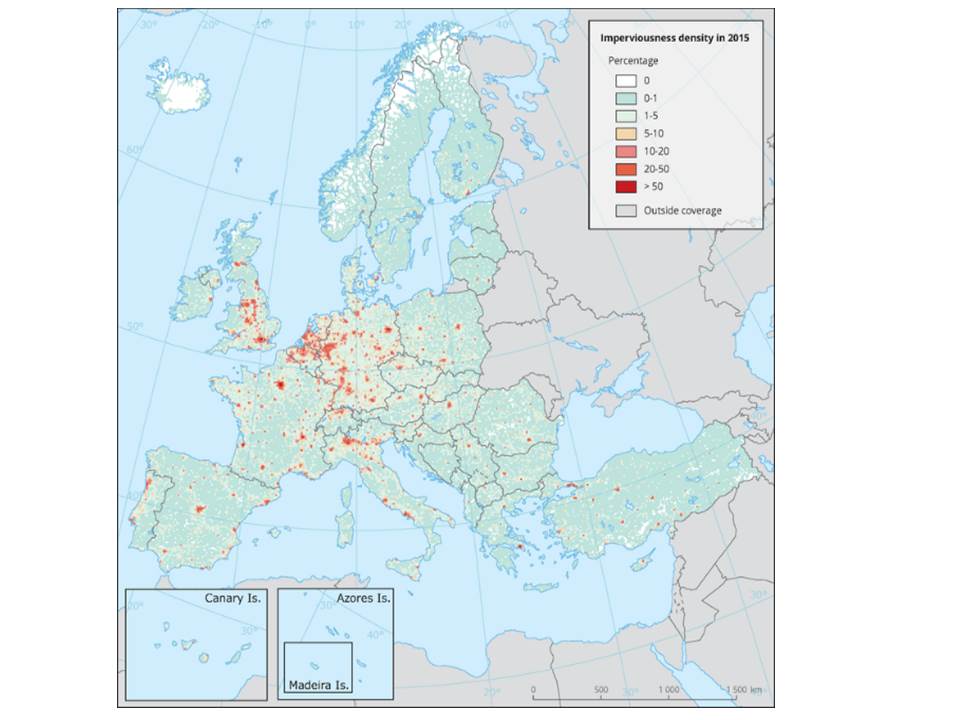
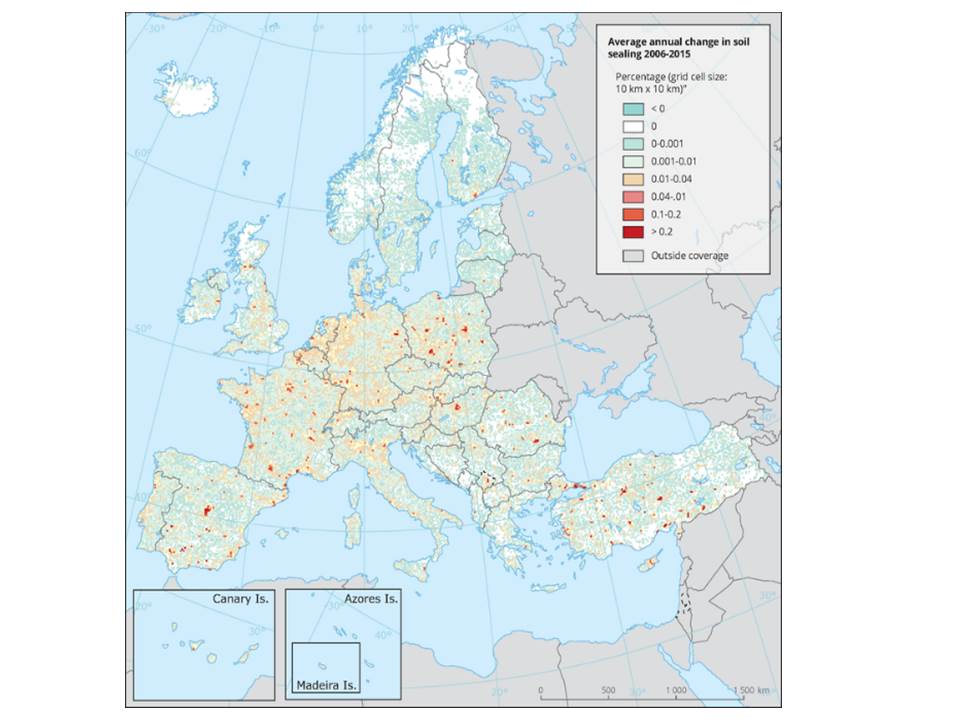
In addition, urban sprawl has accelerated in coastal areas. However, the development of land and infrastructure at the coastal areas is vulnerable to climate change, e.g. the projected rise of the average sea level will increase the risks for coastal inundation and flooding from storm surges. Around 40 % of the European citizens currently live in coastal areas and a large share of the European tourism concentrates in the coastal areas and islands of Europe. In the past decades, there has been rapid land conversion for residential, touristic and recreational facilities and supporting transport infrastructure (e.g. highways, ports and harbours) (Map 4.2) (EEA, 2013b).
Map 4.2 Density of impervious cover across Europe in 2015 (left) and average annual change in soil sealing between 2006-2015 (right)
 |
 |
|
Source: (EEA, 2020e) |
Source: (EEA, 2020a) |
Area of agricultural land under irrigation
Agricultural land has expanded and intensified between 1990 and 2006; partly this occurred at the expense of high nature value farmland, pastures and marginal land. The period after 2006 has seen a reversal of the overall trend and the total agricultural land started to decline in Europe (EEA, 2017d). This decline can be related to the ongoing decline of the rural population, the 2006 CAP reform that (largely) decoupled production from payments, and the provision of relevant economic incentives by CAP to set aside or abandon existing agricultural land or cultivate it less intensively. Due to mechanisation and automisation, cultivation and management of large agricultural areas needs less manpower and labour effort per person nowadays. The decrease of total agricultural land has therefore not been substantial. Furthermore, significant conversions to agricultural land have been observed in some EU Member States (e.g. Germany, Czechia, Hungary, Baltic countries and Ireland). This could be potentially related to changing climate conditions that favour agricultural activities in northern latitudes of Europe, as well as to increased EU support through CAP for the newer Member States (EEA, 2017d).
In addition, farmers have used past economic incentives provided by the EU to expand the cultivation of crops with high water demands (e.g. cotton) also in water stressed areas, such as southern Europe. Around 60 % of all irrigated areas and 85 % of total irrigation abstraction in Europe takes place in southern Europe. This legacy is still putting high pressure on regional water resources, despite recent trends that show improvement in water intensity of crop production by 11 % between 2005-2016 (EEA, 2019k). Figure 4.6 shows the increase in irrigable area in the four European regions since 1961.
There is a high likelihood of expansion of agricultural activities in central and northern Europe. In addition, the increased occurrences of droughts will increase irrigated areas in the future and intensify the pressure on local water resources, even in areas which are nowadays perceived as less threatened.
Figure 4.6 Irrigable area in the EU27+UK since 1961
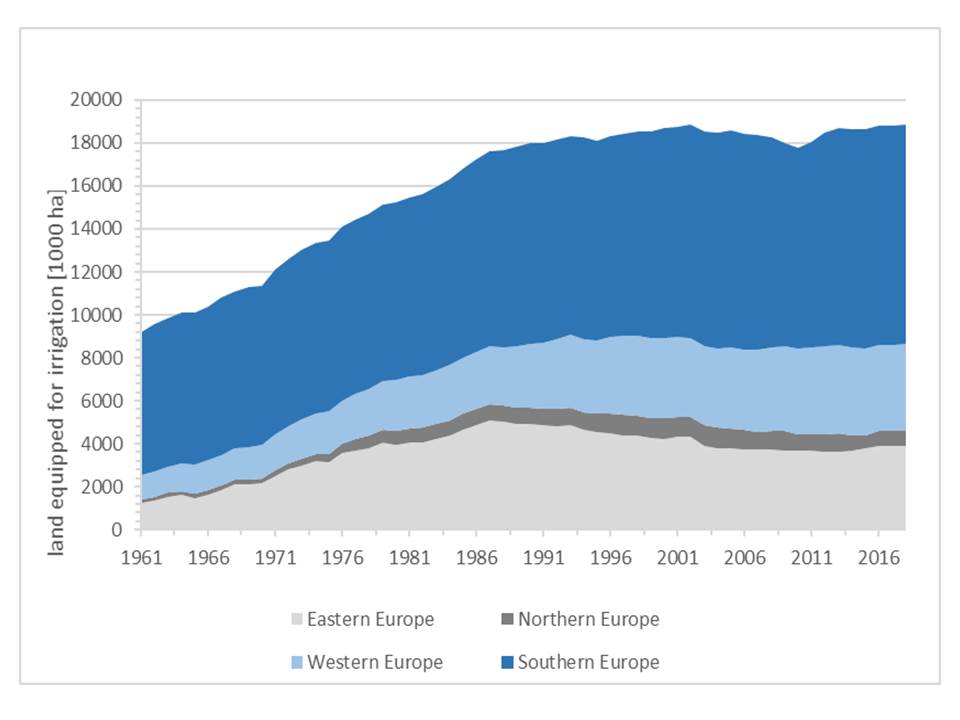
Source: EEA, forthcoming report on Water and agriculture
Area of forested land and wetlands
In several Member States, including Finland, the Baltic countries, Poland, Hungary, Ireland and Portugal, there has been a significant conversion to forested land and woodland, resulting in the overall increase of forests in EU27+UK (EEA, 2017d). Furthermore, the area of water bodies and wetlands shows a small increasing trend between 2006-2012, which could reflect the implementation of policies related to nature protection, water retention, re-naturalisation and environmental restoration (EEA, 2017d).
Future outlook
The FP7 Volante project([2]) “Visions of Land Use Transitions in Europe” concluded to a series of projections for land use change in Europe (Table 4.1). The key outcomes are that different drivers are expected to cause more urbanization, land uptake, land degradation, soil pollution, and loss of ecosystems. Furthermore, some parts of agricultural land will be abandoned, while other parts of agricultural land will be recultivated, including new areas of previous marginalised land, where energy crops could be grown. Projections suggest that the total land occupied by crops will remain similar until 2040. Cultivation of crops is expected to become more intensive and sophisticated (e.g. precision farming) in the areas where farming prevails (EEA, 2017d).
Table 4.1 Relationship of global megatrends and the land system in Europe
|
Theme |
|
Global megatrend |
Impact on land |
Volante factsheet |
|
Social development |
GMT1 |
Diverging global population trends |
Land abandonment, recultivation |
P3 Agricultural abandonment, recultivation and intensification V6 Agricultural abandonment |
|
GMT2 |
Towards a more urban world
|
Land take, urban sprawl, more transport infrastructure |
P5 Drivers of change A12 Zoning for compact cities |
|
|
GMT3 |
Diseases and pandemics |
(Redistribution of animal farming) |
|
|
|
Technology |
GMT4 |
Accelerating technological change |
Precision farming and irrigation |
A7 Agricultural productivity increase A8 Bio‑based economy and bioenergy |
|
Economy
|
GMT5 |
Continued economic growth? |
Land pressure, land grabbing, land degradation, soil pollution |
A13 Climate change impacts with respect to flood protection |
|
GMT6 |
Increasingly multipolar world |
Various
|
A15 Increased trade barriers for higher EU self‑sufficiency |
|
|
GMT7 |
Intensified global competition for resources |
Land grabbing, bioenergy cropping on marginal lands |
P1 Displacement effects P5 Drivers of change
|
|
|
Environment
|
GMT8
|
Growing pressures on ecosystems |
Loss of land‑related ecosystem services and landscapes |
A24 Ecosystem services
|
|
GMT9
|
Increasingly severe effects of climate change |
Erosion, flooding, desertification
|
A13 Climate change impacts with respect to flood protection A14 Climate change mitigation and agricultural emission taxes |
|
|
GMT10 |
Increasing environmental pollution |
Soil pollution, land degradation |
A6 Nitrogen and water quality |
|
|
Governance |
GMT11
|
Diversifying approaches to governance |
Irrational land use transitions |
P5 Drivers of change |
Source: (EEA, 2017d)
4.3. Water consumption by agriculture
Agriculture contributes around 2 % of the GVA of the European economy and provides directly 4 % of total employment, without counting indirect jobs created in upstream and downstream activities. EU is the global leader of agri-food exports, which reached 138 billion € in 2018 (EC, 2019a). Imports of agricultural products are also important for the EU.
Water is an essential resource for agriculture. In areas with more temperate climates, agriculture is mostly rainfed, but irrigation is also applied to regulate seasonal water deficits and ensure satisfactory quality and yields of products. In drier climates, though, rainfed conditions can only provide part of the crop water requirements. Thus, additional water needs to be provided to enable the production of crops. Water is also needed for raising animals, covering their direct needs for consumption or the needs for growing their food and cleaning facilities. Aquaculture and forestry are also dependent on water availability, although they are not directly dependent on water abstractions.
Water abstraction in Europe for agriculture is very unevenly distributed: almost 90 % occurs in southern Europe, and only 10 % in the other parts of the continent. The area of arable land in Europe is around 113 million ha and its nearly 19 million ha is equipped for irrigation (irrigable area). Depending on the climatic conditions, the actually irrigated area is approximately 8 to 9 % of the total arable land. The shares of irrigated land are much higher in southern Europe, ranging from 28 % in Malta to 13 % in Spain and Portugal. Agriculture covers 40 to 60 % of the total water consumption in Europe, especially on irrigated land. Water consumption by agriculture shows the highest fluctuation throughout the year, since the demand for irrigation water rises sharply during spring and summer, especially in southern Europe. In southern Member States, agricultural water abstraction reaches approximately 80 % of total water abstraction (based on Eurostat data on agriculture (EEA, 2018b, 2019k).
The water footprint of different crop and meat products differs largely (Figure 4.7). The highest water footprint is observed for vegetable oils, fibre crops and fruits among crop products and for beef and sheep/goat meat among meat products. Crop and meat products which are produced in Europe are estimated to have a lower water footprint than the similar products imported in Europe from foreign countries, due to different climatic conditions, water management practices and environmental policy frameworks.
Figure 4.7 Water footprints of crop and meat commodities in the EU and in non-EU countries exporting to the EU (litre per kg of product).
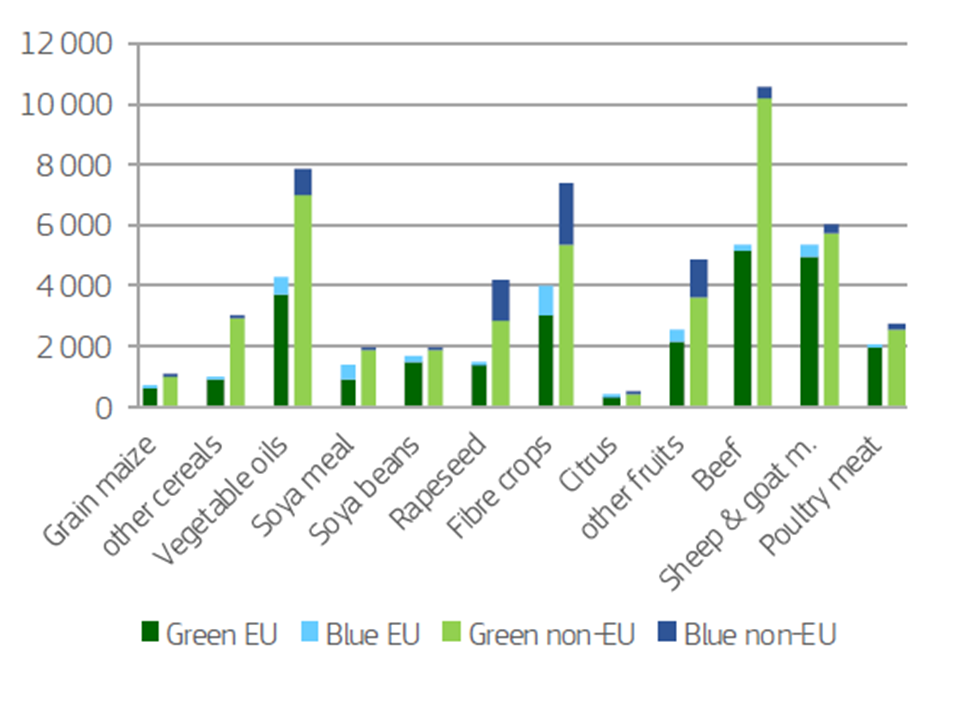
Source: (EC, 2019e)
In general, the crop patterns in southern Europe include many crops with high water requirements (e.g. cotton, alfalfa, maize, fruit trees, vegetables) (Eurostat, 2019a; EEA, 2019k), which are cultivated there for various reasons, including favourable climatic and soil conditions, longstanding tradition and know-how (e.g. special equipment and trained professionals), current level of revenues (especially from fairly commercial/tradeable crops) and significant levels of self-consumption by households. Because of the low water availability and semi-arid conditions in many parts of southern Europe, the water demand of these crops is largely covered by irrigation. The irrigation abstraction per hectare exceeds 5,000 m3 in most southern countries, as well as in Bulgaria. Values higher than 1000 m3 are also observed in countries like Romania, Denmark and France (Figure 4.8).
Figure 4.8 Irrigation abstraction per hectare in Europe
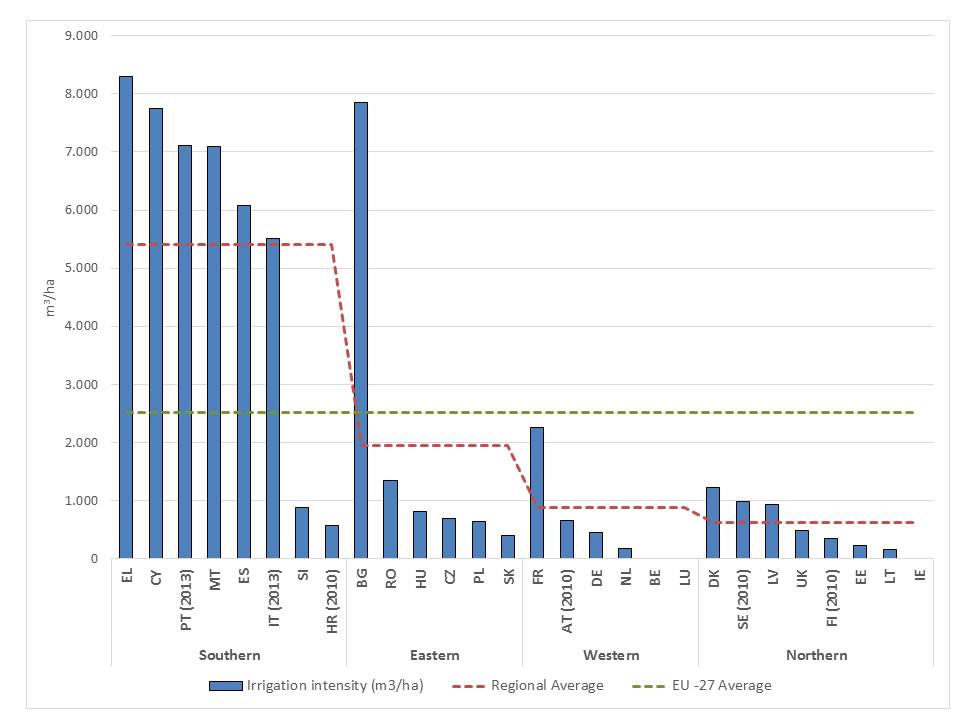
Source: (EEA, 2019k, 2019l)
Note: Based on the data from 2016
The economic incentives for agricultural production , which were established by the EU and Member States for decades (e.g. farmers’ CAP subsidies, low recovery of costs for agricultural water, VAT exemptions for agricultural water, special tax and social security regimes, etc.), have been a major driver leading to the expansion and intensification for irrigation in Europe. The switch to irrigated crops and more intense irrigation were perceived by farmers as ways to produce more harvest and gain more revenues, since irrigated yields are proportionately higher than rainfed yields. In addition, during the 1990s and 2000s the World Trade Organisation adopted serious reforms, which liberalised global trade. Stimulated global trade within a globalised economy has provided new opportunities and new markets for European agricultural products. However, after the 2006 CAP reform, part of the incentives was taken away to promote decoupling of payments from agricultural production. In most EU Member States this caused a slow-down or reverse in the expansion of irrigated areas.
Since 2002 the irrigated area has shrunk by 6 %, although the total utilised agricultural area expanded by 4 % in Europe. Nevertheless, in already water-stressed southern Europe, both agricultural land and irrigated area increased (+12 %) over the same period (EEA, 2018b).
A study of the climate change impacts shows that crop water requirements and crop water deficits have increased in many areas of southern and eastern Europe between 1995 and 2015. Furthermore, the growing season of crops is becoming longer, especially in northern and eastern Europe (EEA, 2016c, 2016a).
In recent years (2010-2017), the total water consumption by agriculture in Europe (EEA 38+UK) has decreased. However, in southern Europe water consumption increased in many countries, including Italy and Turkey, which are large consumers of agricultural water.
The following table (Table 4.2) presents the trends of water consumption per country (grouped in regions) for the period 2010-2017.
Table 4.2 Development of water consumption by agriculture in Europe (EEA 38+UK, 2010-2017)
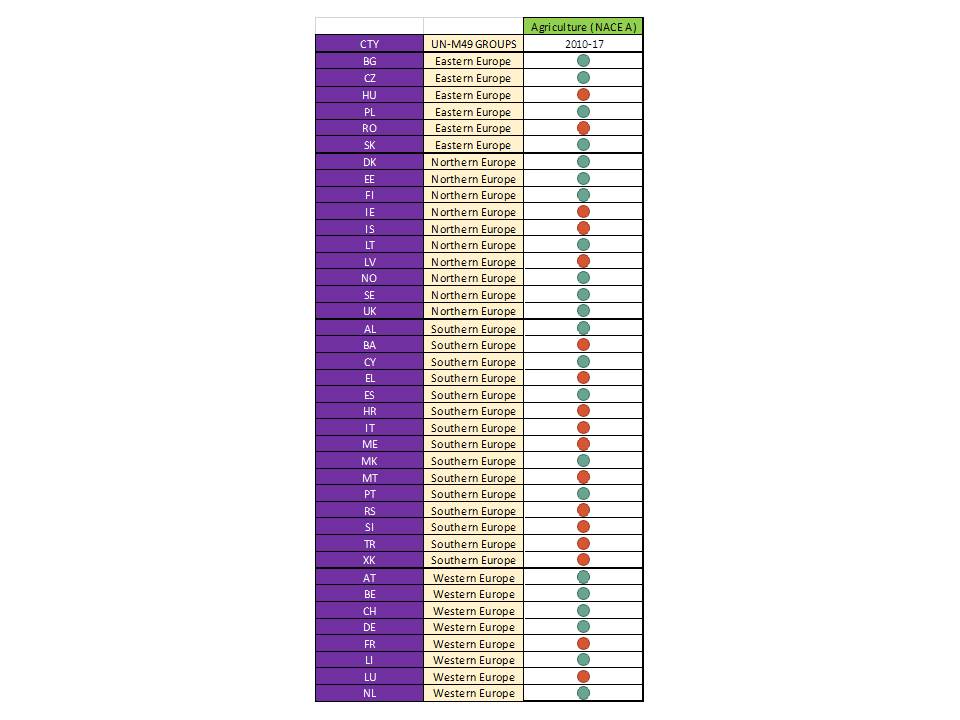
Data sources:(EEA, 2020j, 2019l; Eurostat, 2020f)
Note: Green bullet for decrease; Red bullet for increase
Moreover, the comparison of the total water consumption in the agricultural sector with its net value added (NVA) shows that trends for decoupling are already visible in northern, western and southern countries (Figure 4.9).
Figure 4.9 Comparison of regional trends between water consumption and economic growth for the agricultural sector.
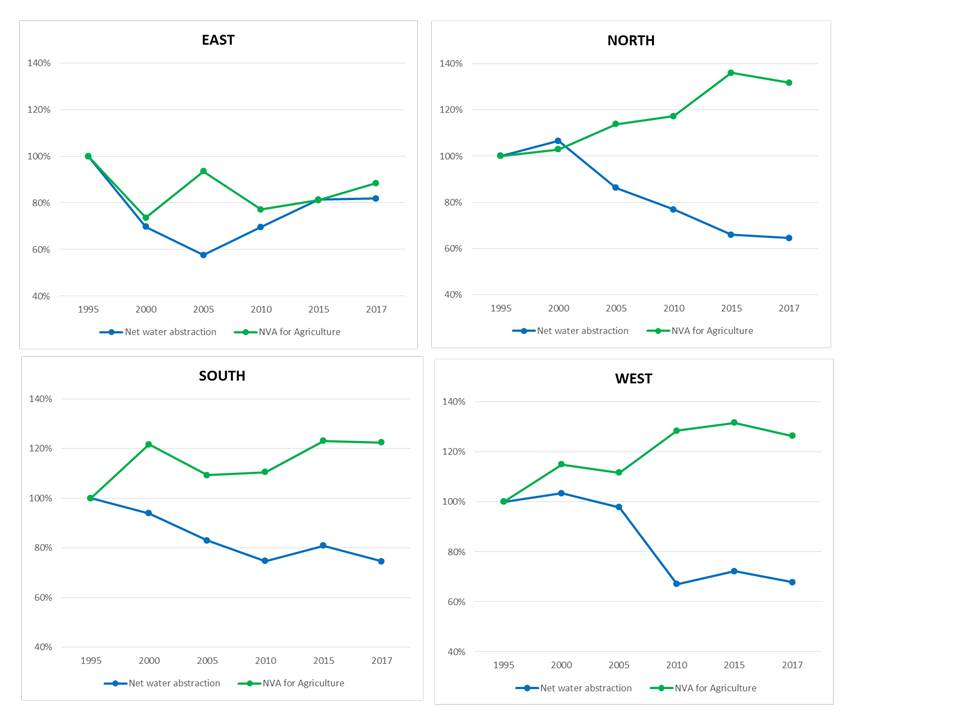
Data sources: (EEA, 2020j, 2019l; Eurostat, 2020f, 2020a)
Note: Blue line – Water consumption volume in million m3 (indexed 1995=100); Green line – Net Value Added in million Euros (indexed 1995=100)
Future outlook
A recent outlook study (EC, 2019e), based on agro-economic modelling and consultation with stakeholders, international institutions and experts, suggests that the agricultural land in EU is expected to decrease slightly by 2030 with the current agricultural and trade policies. This is in line with the findings of the recent FP7 Volante project, which also concluded that a limited reduction in the size of agricultural areas is the most probable scenario by 2030. Cereals, fodder and pasture are expected to decrease, whereas oil seeds, pulses and other crops are expected to increase. The study also indicates that the production of milk and beef could decrease in the EU.
Projections show that the warming climate could cause the growing season to become longer in most European regions. As a result, crops growing in warmer conditions could be cultivated in northern latitudes, and crop cultivation in certain areas of southern Europe (e.g. Spain), could shift into the winter season (EEA, 2016c, 2016a). Moreover warmer climate conditions earlier in spring and later in autumn may enable crop cultivation for longer periods of time and possibly with multiple harvests. As a result, climate change could increase the crop water deficits and the irrigation water requirements could increase more than 20% in southern Europe (Konzmann et al., 2013). An overall increase is projected across all Europe (EEA, 2016b). Regarding future crop yields, the projected patterns show high variability with location, crop type, climate and management conditions. Overall, a rise in productivity is expected in northern Europe and a decrease in southern Europe, although this is not uniform across all crop types (EEA, 2016j).
The potential water saving from individual technical measures for irrigated agriculture differs largely, and it relies upon site-specific conditions (e.g. soils, crop types) and applied technologies. An indication of potential water savings is provided in Table 4.2. It has been estimated that the potential water savings in irrigated agriculture could exceed 40 % of the total abstractions, applying combinations of the above measures (Dworak et al., 2007).
Table 4.2 Potential water saving of indicative technical measures in the agricultural sector
|
Measure |
Potential water saving |
|
Upgrade of conveyance infrastructure (e.g. closed pipes replacing open trenches) |
10-25% |
|
Change towards irrigation methods with higher application efficiency (e.g. drip micro-irrigation replacing furrow irrigation) |
15-60% |
|
Changes in irrigation practices (e.g. rescheduling irrigation; mulching) |
30% |
|
Crop restructuring (e.g. drought-resistant crops replacing water-demanding and drought-sensitive crops) |
50% |
|
Irrigation with reclaimed water |
10% |
Source: (Dworak et al., 2007)
Furthermore, as part of the Blue2 project, several scenarios were developed for potential water saving measures for irrigated areas in southern European countries (Benitez Sanz et al., 2018). The main outcomes were that up to 5 % of the annual renewable freshwater resources in each river basin could be saved, if all planned irrigation efficiency measures from the RBMPs are implemented. In comparison, 10 % of the annual renewable freshwater resources could be saved if all feasible technical measures are implemented, regardless of their total cost (e.g. upgrade of conveyance systems to reduce leakages, seepage and evapotranspiration losses; application of the most efficient irrigation technology per case). Although these gains are considerable, taking into account the significant water stress levels in many southern river basins (often exceeding 30 % of the annual renewable freshwater resources), they are not sufficient to reverse the water scarcity conditions only on their own. In addition, in order to capitalize the aforementioned potential water savings, which are feasible by improved irrigation systems and equipment, both investments and supporting actions are required (e.g. adjustment of end-users’ management practices).
4.4. Water consumption by electricity production
The energy sector comprises of a variety of subsectors and technologies. Focusing only on the production of electricity, the different technologies can be roughly categorised into combustion plants and nuclear stations, hydropower and renewable energy sources.
Combustion plants and nuclear stations need water to cool off the hot steam, which is created from burning fuel and used to rotate turbines. The discharge of cooling water to the environment causes thermal pollution to the receiving water bodies, resulting -inter alia- in risk for fish populations to suffer from hypoxia. Thermal power covers a significant share of the electricity consumption in Europe (60 %). Cooling water for electricity production is responsible for nearly 18 % of total water consumption in Europe in 2017. The use of cooling water is relatively high in western and eastern Europe. France and Germany have the highest consumption of cooling water; together they make up 45 % of Europe’s total consumption (EEA, 2018b).
Hydropower plants using freshwater are usually combined with the construction of dams, reservoirs and diversions. Stored water is released and rotates the turbines which generate electricity. Almost all of the water released by hydropower plants is directly returned to the environment. The amount of water consumed by hydropower plants is considered negligible, but it actually depends on the site and the technology configuration, and there is no overall estimate for its range (IEA and OECD, 2010). Hydropower installations can have significant hydromorphological impacts, as they impede the natural water and nutrient cycle, and they create obstacles for the transport of freshwater biodiversity, sediments and substances. Generation of hydropower from large and small dams has increased substantially during the last century, but the growth has slowed down in recent decades, because the most productive locations are already occupied and because environmental permitting in Europe has become more comprehensive, following the adoption of the WFD (permitting procedure under Art. 4.7). However, hydropower installations have multiplied in areas such as the West Balkans. More than half of the electricity production in Albania, Austria, Croatia, Iceland, Luxemburg and Montenegro comes from hydropower (EEA, 2018b).
Renewable energy is largely generated by wind turbines and solar panels. These technologies show much lower needs for water consumption during their whole life-cycle than the conventional forms of energy ( Figure 4.10). Furthermore, where favourable conditions are present, geothermal power is a potential source of heating in buildings. In general, exploitation of geothermal power is not considered a consumptive use. In addition, electricity production from biomass also considered a renewable form of energy. This fuel type is more water-dependent, though, because the raw material for this fuel type originates from crops and plant residues that have grown with rain and partly irrigation water.
Figure 4.10 Water consumption per unit of generated energy for different types of energy sources during their life-cycle.
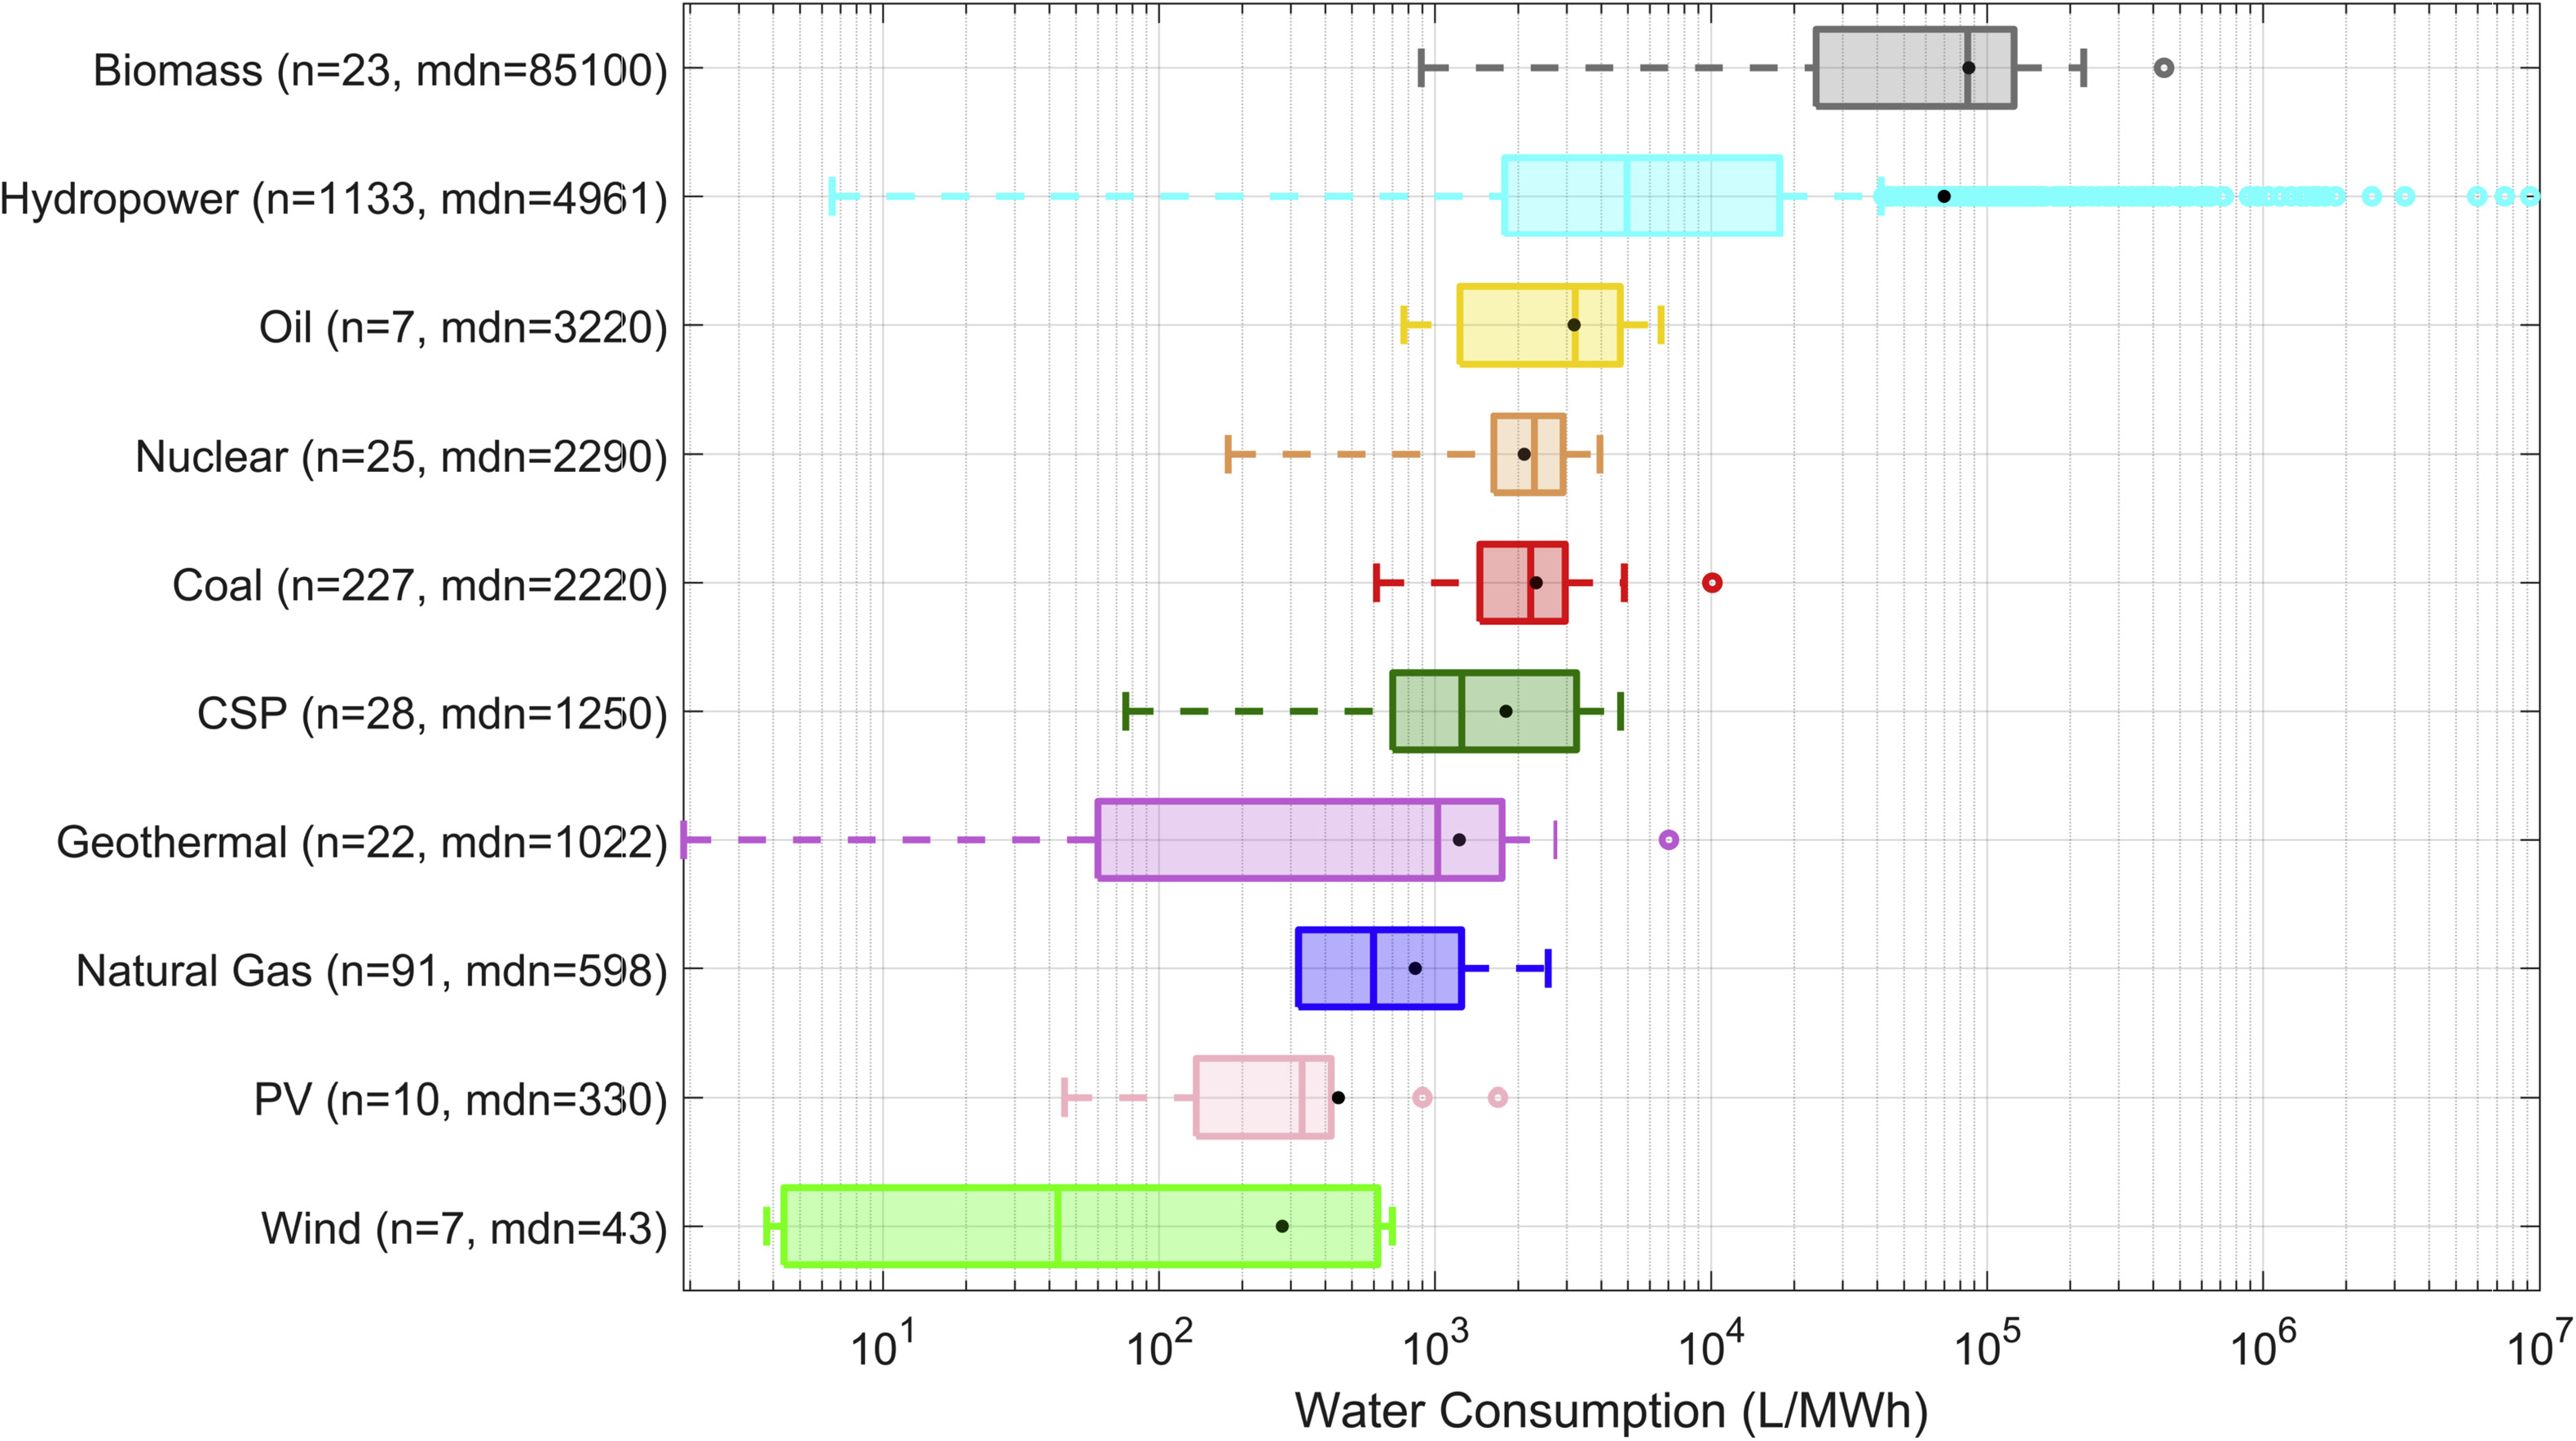
Source: (Jin et al., 2019)
Note: CSP stands for Concentrated Solar Power; and PV for Photovoltaics. Hydropower is not a considered a consumptive use in this analysis, although it is shown as such in the above graph returns are generally considered similar to abstractions. Water consumption is visualized on a log scale. The annotation mdn gives the median value of water consumption for each fuel type. Circles represent the outliers, while the dots represent the average for each power type.
More than half of the final energy consumption in the EU occurred in the industrial sector (32%) and households (24%) in 2018 (Eurostat, 2020g). Therefore, both sectors not only consume large amounts of water directly, but also indirectly, through the energy that needs to be generated to cover their energy demand. As the energy consumption is falling across Europe (-10% between 2005 and 2016) and the less water-demanding renewable energy sources take up larger shares in the total energy mix (from 7% in 2005 to 14% in 2016), the energy production and the corresponding water consumption are generally decreasing (EEA, 2018b).
The following table presents the recent trends of water consumption for electricity production per country (grouped in regions) for the period 2010-2017 (Table 4.3). It shows that water consumption is decreasing in the majority of countries. This is related with upgrades of existing power plants, where aged equipment is replaced with new and more efficient installations, as well as with the decarbonisation of the energy system, as renewable sources of energy are increasing their shares in the energy mix (EC, 2015c).
Table 4.3 Development of water consumption by electricity production in Europe (EEA 38+UK, 2010-2017)
Data sources: (EEA, 2020j, 2019l; Eurostat, 2020f)
Note: Green bullet for decrease; Red bullet for increase
The comparison of the total water consumption in the energy sector with the net value added (NVA) generated in the economy from that sector shows that trends for decoupling are already visible in western countries (Figure 4.11). Nevertheless, the positive sign is that water consumption for electricity generation is decreasing in all regions.
Figure 4.11 Comparison of regional trends between water consumption and economic growth for the energy sector.
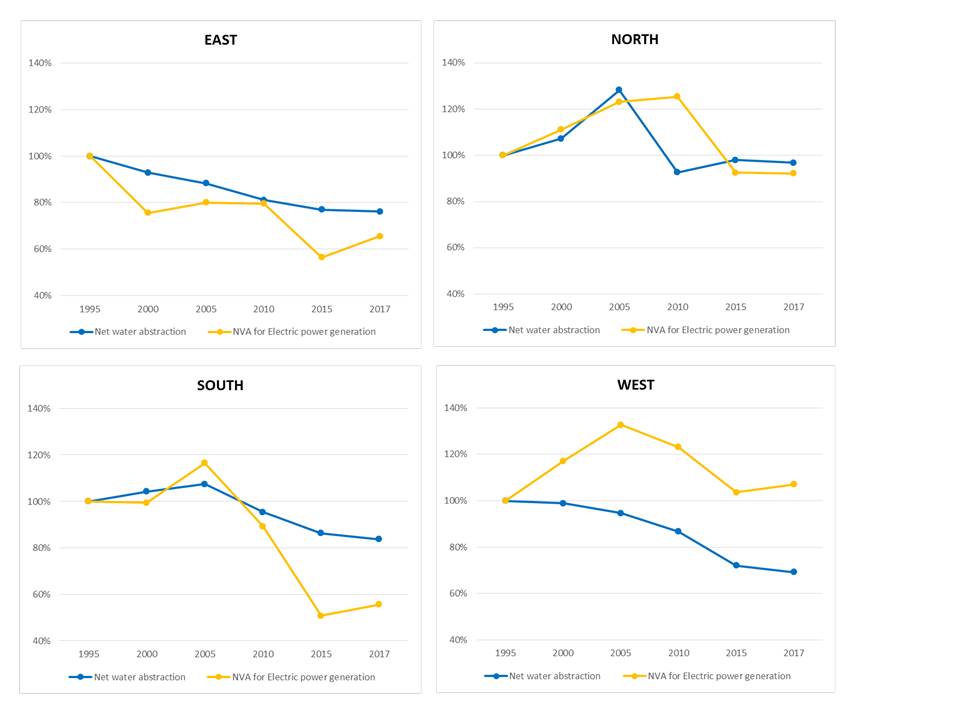
Data sources: (EEA, 2020j, 2019l; Eurostat, 2020f, 2020a)
Note: Blue line – Water consumption volume in million m3 (indexed 1995=100); Yellow line – Net Value Added in million Euros excluding renewables (indexed 1995=100)
A recent outlook study (EC, 2015c) established an EU reference scenario for energy, transport and greenhouse gas emissions up to 2050. The study reflects the long-term EU strategy for the decarbonisation of the EU economy, including the production and consumption of energy. The installed capacity of the energy system is expected to grow by almost 30 %, while this increase will be driven by the rapid expansion of renewable energy sources, and the replacement of coal and petroleum with natural gas. Investment are expected to focus by 70 % on new installations and by 30 % on upgrades and retro-fitting of existing installations (Figure 4.12). The replacement of obsolete with modern thermal power plants, and the construction of combined heat and power systems will result in higher efficiency in the use of input fuels. Furthermore, the retro-fitting of outdated installations of photovoltaics and wind turbines with new generation technology on the same site is considered an economic and feasible solution, with is expected to cause much lower environmental impacts.
Due to the projected decarbonisation of the EU energy system and the announced closures of nuclear and coal-fired power plants and coal mines throughout Europe, water abstraction and consumption in the energy sector are expected to decrease significantly by 2050 (Hidalgo González et al., 2019). The estimated amount of water abstracted by the energy sector (for primary electricity production, oil refining, and cooling of thermal power plants) could decrease up to 38 % by 2050 (Map 4.3). Water consumed by the whole energy sector is expected to decrease by 27 % (Hidalgo González et al., 2019).
Map 4.3 Change in water abstraction by the energy sector between 2015-2050
Source: (Hidalgo González et al., 2019)
Achieving a carbon neutral Europe by 2050 without increasing the pressure on freshwater resources, would require a shift to a low carbon energy system considering not only the expected gains in CO2 emissions, but also the water needs of the replacing energy technologies. Some low-carbon technologies could use water more intensively than the system they replace, such as biofuels, hydrogen, and Carbon Capture Sequestration systems (Hidalgo González et al., 2019). For example, according to the European Commission Long Term Strategy, hydrogen could account for up to 16-20 % of the total EU energy share, mostly in the residential and transport sectors, and could provide additional solutions for long-term energy storage. Supplying the equivalent of 1.6-2.3 TWh from hydrogen would consume around 30 % of the total water consumed in the energy sector today (Moya et al., 2020; Hidalgo González et al., 2019).
The manufacturing industry includes a variety of different sub-sectors, including food and beverages, textiles, chemicals, pulp and paper, iron and steel. The above sub-sectors need to use water for cooling purposes, processing activities, washing and cleaning of facilities and equipment, and water that is integrated into products. However, the returned cooling water can cause problems with thermal pollution and hypoxia. Furthermore, industrial discharges can be highly contaminated and then require appropriate treatment before discharge. In the case of washing and cleaning water consumption can be considered low to negligible, but discharged water may need treatment because of its nutrient and organic content (EEA, 2018b).
Mining and quarrying include a diversity of activities, such as mineral extraction (e.g. coal, ores, petroleum, gas) and preparatory actions for the supply of materials to the markets (e.g. crushing, grinding, cleaning, drying, sorting, concentrating ores, liquefaction of natural gas, agglomeration of solid fuels). Groundwater is pumped for the drainage of the mining and quarrying sites. Furthermore, water is abstracted and used during processing (e.g. rock crushing, dust depression). Water is returned to the environment as part of the de-watering process. These discharges contain pollutants, depending on the processing method. In 2017 the share of water abstraction for mining was the highest in western (40 %) and southern Europe (22 %) (EEA, 2018b).
It is observed that water consumption by the manufacturing industry and mining and quarrying is generally decreasing with the exception of many Balkan and eastern European countries (Table 4.4). This trend can be attributed to the modernisation of the production processes, technological improvements, more efficient methods, water recycling and reuse. Furthermore, water consumption by the industrial and mining sector has also declined, because of the de-industrialisation of specific regions in Europe, since the industrial production has been partly transferred abroad. At the same time, the overall production of the sector shows an increase (+9 %) between 2010 and 2017 (Eurostat, 2020e; EEA, 2018b).
Table 4.4 Development of water consumption by industry and mining in Europe (EEA 38+UK, 2010-2017)
Data sources: (EEA, 2020j, 2019l; Eurostat, 2020f)
Note: Green bullet for decrease; Red bullet for increase
The comparison of the total water consumption in the industrial sector with the net value added (NVA) generated in the economy from that sector shows that trends for decoupling are already visible in eastern, northern, and western countries. In southern countries, decoupling trends are not visible (Figure 4.13).
Figure 4.13 Comparison of regional trends between water consumption and economic growth for the industrial sector.
Data sources: (EEA, 2020j, 2019l; Eurostat, 2020f, 2020a)
Note: Blue line – Water consumption volume in million m3 (indexed 1995=100); Red line – Net Value Added in million Euros (indexed 1995=100);
In (Bernhard et al. (JRC, 2020b), the average increase of water use efficiency in the industry sector between 2000 and 2015 is estimated at 2.2 % per year. This is roughly in agreement with Figure 4.16 (Dworak et al., 2007) provide an estimate of potential water savings in the industry between 15 and 90 %, with 43 % as central estimate.
The difficulty in getting more reliable estimated about water consumption and potential savings in this sector can be linked to the difficulty to obtain such information from enterprises, because of the diversity of the sub-sectors and technologies involved and because such data are considered as strategic information (Benitez Sanz et al., 2018; TNO et al., 2014).
The development of a partial inventory of three categories of cleaning equipment in industry (Benito et al., 2009) showed that the potential difference between the most and the least water-efficient techniques could range by a factor of 6. This may offer room for improvement, but the actual potential savings are extremely case specific.
4.6. Public water supply
Public water supply includes water services to meet the water demands for drinking, washing, cleaning, sanitation, cooking, home gardening, etc. in residential and commercial areas and in businesses. It also includes tourism and, sometimes, water for the industrial or the agricultural sector. The public water supply industry consists of utilities that abstract water from the environment, apply treatment to remove hazardous substances and pathogens, and supply the treated water to the end users. Furthermore, wastewater is collected and treated to remove organic substances, nutrients and pathogens, and discharged to the environment. In 2017, households accounted for over 60 % of the total public water supply. In 2017, around 50 % of public water supply took place in southern Europe, which is associated with the impact of tourism in this region (EEA, 2018b).
Public water supply is often faced with water quality issues in the water sources, such as salinisation in coastal areas, as well as problems with nitrates, sulphates, heavy metals, pesticides, pharmaceuticals, and other contaminants. The WFD requires that all Member States establish safeguard zones for drinking water protection and the Drinking Water Directive stipulates the quality standards for supplied water, to ensure mitigation of risks for human health.
In 2017, the average water consumption of households in Europe was estimated at 147 litres/day/person[3]. The daily minimum to meet basic human needs is estimated at 50 litres/day/person (Gleick, 1996) so the European average is comfortably above that threshold. Nevertheless, the average water supply to European households varies substantially on a national level, e.g. 115 litres/day/person in Belgium to 265 litres/day/person in Spain. Bernhard et al. (JRC, 2020b) have collected water use data of households for the period 2000 to 2013 at NUTS3 level. Aggregated to four categories of regions, based on climate and income, they find water uses varying between 112 to 159 litres/day/person; with the lowest values in cool/low income areas, and the highest in warm/high income areas.
Water leakages are a major concern, because they mean extra pressure on the water sources without actual benefit to the users, as well as wasted energy and resources for pumping and treating. Thus, they result in financial losses for the water providers and they may affect the affordability of the water services through higher billing. In major European cities, such as Athens, Paris, Istanbul or Madrid, drinking water may be tapped from very distant sources, which sometimes lie 100-200 km away (EEA, 2018a). The length, the operation and the maintenance of the pipes affects the level of leakages. It is estimated that the average leakage rate of the drinking water distribution networks across Europe is approximately 2 171 m3/km/year (or an equivalent of 23 % of all water distributed by EurEau members) (EurEau, 2017). A review of cases studies across Europe (EC, 2013b) also indicated that the physical losses of the drinking water distribution networks could range between 10 % and 72 % of the abstracted volume.
Due to the combination of increased pricing, water-saving technologies and measures, and awareness campaigns, Europe has seen significant reductions in public water supply for households between 1990-2017 (-16%), despite the increase of the European population, which occurred in parallel. However, southern Europe did not follow the same trend, as there was an increase in public water supply for households by 10 % over the same period (EEA, 2018b).
(Dworak et al., 2007) estimated that domestic water use was feasible to reduce by 50% or more. Furthermore, Benito et al. (2009) estimate the potential water savings in households at 32% by using more water-efficient household appliances, and at 20% by using more water-efficient toilets and showers alone.
Increasing population and changes in household types (i.e. more single households, which show higher water needs on average) are expected to increase the demand for public water supply. In addition, the role of household income is ambiguous. On the one hand, increased income has led traditionally to the adoption of better living standards and has been considered as a factor increasing water use per individual. On the other hand, nowadays, higher household income can result in more rapid access to novel and more water and energy efficient household appliances, better maintenance and timely replacement. Thus, it could be a factor contributing to lower water consumption in households.
4.7. Water consumption by tourism and recreation
Tourism and recreation is a special sub-sector, which is supplied with water from public water supply, and it includes various types of water uses, such as water use for hotel and accommodation services, food and restaurant services, spas, saunas and swimming pools, golf courses, parks and urban green spaces, outdoor sports and leisure activities at natural landscapes. Water quality can be an important concern for this sub-sector because it requires the supplied water needs to meet different types of criteria, e.g. fit for human consumption and skin contact, suitable for bathing, as well as aesthetic criteria (“landscape beauty”). For example, eutrophication or revelation of embankments, because of low flows and draw-down, can have negative experience to visitors (EEA, 2018b).
As the tourism industry has risen in the past decades, millions of people within Europe and abroad are moving away from their permanent residence to visit popular destinations. It has been estimated that this mobility accounts for around 9 % of the annual water consumption of the accommodation and food service sector in Europe (EEA, 2018b). The most important tourist attractions in Europe are large cities, such as Paris, London, Brussels, Rome, and the coastal areas and islands of the Mediterranean, the Baltic, the North Sea or the North East Atlantic. Currently, Europe attracts 50 % of the global international tourist arrivals, with nearly 20 % of them arriving in the Mediterranean (World Tourism Organisation, 2017). Tourism in Europe reached record-levels over the last decade. It should be noted that tourism activities in the Mediterranean peak during the summer season, similarly to agricultural activities. This results in high levels of seasonal water stress. It is estimated that the annual number of tourists who visit the Mediterranean areas per year is 16 times higher than the permanent population of these areas, while water consumption of tourists is two to three times higher than local demands (Iglesias et al., 2007). In the last decade, the number of nights spent by tourists in Europe increased by 30 % in southern Europe, whereas there was no significant change in other parts of Europe (Eurostat, 2020b). Over the same period water abstraction for tourism almost doubled. The local and national economies of many southern countries (e.g. Cyprus, Greece, Malta, Spain, Turkey) are largely dependent on tourism.
Future development of tourism will rely on health considerations related to external shocks like Covid-19, and changes in the working and business environments. Technical water saving measures which can be implemented in the tourism sector are similar to those for households. However, estimating the potential water savings for tourism remains difficult, as little information is available and the future development of this sector is not clear. The water saving potential for tourism has been estimated around of 188 million m3 per year (Dworak et al., 2007).
4.8. Environmental and socio-economic impacts from water consumption
4.8.1. Environmental impacts
Abstraction is considered a significant pressure, affecting up to 17 % of the total groundwater body area and 10 % of the total river length in EU27, Norway and the UK in 2016. However, the total groundwater body area and the total river length, which are affected by significant pressure from water abstraction, are much higher in water-stressed areas of southern Europe (e.g. Cyprus, Malta, eastern Greece, southern Italy and south-eastern Spain), reaching 26 % and 13 %, respectively (EEA, 2018c). In addition, water abstraction by any sector is reported as a significant pressure for surface and groundwater bodies in up to 77 % of all river basin districts of Europe. The results are provided per sector in Table 4.5.
Furthermore, 62 % of rivers, 51 % of lakes, 61 % of transitional waters and 51 % of coastal waters were not in good ecological status in 2015 (EEA, 2018c) and 84 % of freshwater habitats were not in favourable condition in 2015 (EEA, 2016d). Specifically for wetlands, it is estimated that more than 60% of them vanished before the 1990s. The lost area of wetlands has overall decreased since the 1990s, but this development seems to have stalled between 2006 and 2012 (EEA, 2020b).
Table 4.5 Extent of significant pressures from water abstraction by sector using water
|
Driver/Pressure |
% of RBDs with affected SWBs or GWBs |
Member States with significantly affected SWBs >10 % in number |
Member States with significantly affected GWBs >10 % in number |
|
Agriculture – Abstraction |
42.8 % |
Cyprus, Spain, France, the Netherlands, Bulgaria |
Cyprus, Hungary, Spain, Greece, Malta, Italy, France, Belgium |
|
Public water supply – Abstraction |
57.2 % |
Spain, Cyprus, France |
Hungary, Luxembourg, Spain, Malta, France, Belgium |
|
Industry – Abstraction |
40.1 % |
France |
Hungary, Spain, Belgium |
|
Energy cooling – Abstraction |
11.2 % |
- |
Belgium |
Source: (EEA, 2018c)
Although the volumetric pressure on renewable freshwater resources has started to decline (Section 5.1), significant improvements are not yet visible in the quantitative status of water bodies, partly because recovery can be a slow environmental process, and also because climate change and socio-economic development can offset volumetric gains and aggravate local pressures. High attention is needed, when implementing water efficiency measures, to avoid adverse impacts from rebound effects. There are signs that past efficiency gains in specific European river basins have already been offset, due to expansion of irrigated land and more intensive use by other sectors.
The main impacts of water abstraction on groundwater bodies are deterioration of the water balance and lowering of the groundwater tables, saline intrusion, enhanced pollution with chemicals and nutrients, and a poor condition of groundwater-associated surface waters and groundwater dependent terrestrial ecosystems. The main impacts of water abstraction on surface water bodies are the alteration of habitats due to hydrological or morphological changes, as well as the enhanced pollution with chemicals, nutrients and organics (EEA, 2018c).
In principle, the deterioration of the quantitative status of groundwater bodies can be linked with all the above environmental impacts. Even though the link to the different types of pollution (e.g. chemicals, nutrients, organics) may seem less obvious, it is explained by the following fact: Reduced water quantity in groundwater may result in lower dilution of pollutants, which increases their observed concentrations and, subsequently, increases the risk of exceedance of environmental quality standards (EQSs).
Furthermore, because of the hydraulic connectivity between groundwater and surface waters, where this occurs, groundwater pollution problems may propagate to surface water pollution (e.g. eutrophication; toxic substances/solutions). In addition, the drawdown of the groundwater tables can cause lower inflows to associated streams and lakes, and in extreme cases complete dry-out. Lower flows or stagnation of associated surface waters increases the occurrences of water quality problems. Both quantity and quality issues, as well as their combination, result in ecological problems in surface waters. The ecological functions of individual species of flora and fauna, as well as ecological processes in aquatic and terrestrial ecosystems (e.g. wetlands, estuaries, riparian zones), can be altered or disrupted, leading to the decline of species populations and the degradation of biodiversity.
Box 4-3: Ecological impacts of over-abstraction on wetland and riverine ecosystems in Spain
Sources: (Arroita et al., 2015; Benejam et al., 2010; De Stefano et al., 2015; EC, 2019c; Green et al., 2016; Muñoz-Reinoso, 2001; OECD, 2019, 2015; WWF, 2006, 2016; UNESCO, 2020)
Unauthorised water abstraction from groundwater is considered a significant problem in Spain. It is estimated that wells and boreholes without a permit by the competent river basin authority exceed 500 000 and, potentially, they account for 40 to 50 % of total groundwater abstractions. Furthermore, Spanish authorities have detected cases of licensed users, who are abstracting more than their allocated quota. Unauthorised water abstraction in Spain has been mainly driven by uncontrolled expansion of irrigated agriculture, urban developments and tourism facilities (e.g. golf courses). The problem has existed for decades, leaving a legacy of over-exploited aquifers across the country. The problem is also related to the existence of “senior water rights” (i.e. old water rights granted decades ago), which have not been revised to account for updated studies on water balances and water needs. Over-abstraction has impacted various riverine and wetland ecosystems.
The Doñana National Park is an important coastal wetland, designated as UNESCO World Heritage site, which lies at the delta of the Guadalquivir River and covers 54,252 ha of lagoons, salt marshes, fixed and mobile dunes, scrub woodland and maquis. Over the past decades, there have been land conversions for irrigated agriculture and touristic facilities in the periphery of the park.The expansion of irrigation has been particularly driven by the expansion of rice and strawberry fields. Both cultivations require a high amount of irrigation, and their production is largely exported to foreign countries. Over-abstraction for irrigation has resulted in the decline of the groundwater tables in several parts of the region, the depletion of temporary ponds, the decrease of local stream flows the reduction of groundwater recharge. In coastal areas, the groundwater-sea water equilibrium has been distorted, resulting in saline intrusion. The Doñana area is also suffering from nutrients and chemicals released from agricultural activities and heavy metals originating from upstream industrial activities. The over-exploitation of aquifers and the decrease of stream flows limits their capacity to dilute and flush out pollutants; thus, pollution problems like eutrophication are favoured. Overall, the natural ecosystem faces negative impacts, which may be observed in the alteration of vegetation (e.g. increase of xeric shrubs, pine trees and juniper woodland), the distortion of invertebrate communities (e.g. dragon flies), the decline of fish, molluscs and birds species (e.g. wintering and nesting ducks, and coots), and the spread of invasive over native species. The river basin authorities have launched several proceedings for identified breaches and closed a limited number of illegal wells in the past. However, in 2019, the European Commission decided to refer Spain to the European Court of Justice for insufficient action and alleged breaches of the WFD and the Birds and Habitats Directives.
Research studies on Spanish rivers have also shown that the natural flow regime has been significantly altered in various river basins. Over-abstraction has turned normally perennial rivers into intermittent flowing streams., and fish assemblages were seriously impacted on sites with high pressure from water abstraction. Reduction in carbon storage and breakdown, as well as in the population of shredder insects, were also observed in mountain streams affected by over-abstraction.
The friction between environmental and economic water demands is illustrated by the case of the River Basin Management Plan of the Tagus River in Spain. The current plan, in force from 2015 to 2021, did not effectively take environmental water demand into account, favoring economic functions (especially irrigated agriculture). In 2016, a group of civil associations and representatives of local municipalities submitted a legal challenge to the plan. In its 2019 ruling, the Spanish Supreme Court annulled the plan's provisions on environmental flows and required the River Basin Authority to enact urgent interim measures to cover the period until the start of the next planning cycle in December 2021.
4.8.2. Socio-economic impacts
The deterioration of a groundwater body to a poor quantitative status or the absence of improvement from a poor quantitative status may propagate into wider socio-economic impacts. Therefore, the management of water abstractions is important not only from environmental, but also from a socio-economic perspective. For example, this may cause limitations to the water supply from this source. Furthermore, in the case of a drought, groundwater might not support water supply the way it used in the past with negative consequences for the relevant water uses (e.g. drinking water). Water shortages can cause damages to high-added-value sectors like tourism and water-dependent industries. Due to the hydraulic connections between groundwater and surface water bodies, low groundwater levels may result in low recharge into rivers and lakes; thus, affecting the surface water availability also. Low discharges in rivers may affect water-dependent electricity production from thermal and nuclear power plants or hydropower facilities. In addition, low water availability can cause loss of crop yields and harvested production in agriculture and increased costs for irrigation water supply. There are also cases where the drawdown of groundwater tables has caused damages to infrastructures, due to land subsidence.
4.9. Environmental flows
A flow regime which is based on environmental requirements is a prerequisite to reach good ecological status in rivers (EC, 2016). Establishing ecologically-based flow regimes is therefore an important measure in the RBMPs (EC, 2019b). In most Member States, the work on defining and implementing environmental flows was still ongoing in the second cycle (EC, 2019b). In the second RBMPs, environmental flows have been reported to be derived and implemented for all relevant water bodies only in three Member States. In the majority of Member States, environmental flows have been derived and implemented only for a subset of the total water bodies, either in all or in part of their RBDs (Table 4.6).
|
Derivation and implementation of ecological flows |
Member States |
|
|
Ecological flows derived |
in all water bodies |
All RBDs: ES, CY, EE, HU, NL In some RBDs: FR (4 RBDs), IT (2 RBDs) |
|
in some water bodies (work is still ongoing) |
All RBDs: CZ, AT, DK, RO, SE, SI In some RBDs: UK (Scotland, England, Wales, Northern Ireland), BE (1 RBD), BG (1 RBD), DE (7 RBDs), FI (7 mainland RBDs), FR (10 RBDs), PL (8 RBDs), PT (9 RBDs) |
|
|
Ecological flows implemented |
in all water bodies |
All RBDs: CY, HU, NL Some RBDs: FR (2 RBDs) |
|
in some water bodies (work is still ongoing) |
All RBDs: CZ, ES, AT, EE, RO, SE, SI Some RBDs: UK (Scotland, England, Wales), BG (1 RBD), DE (7 RBDs), FR (2 RBDs), IT (2 RBDs), PL (8 RBDs), PT (8 RBDs) |
|
|
Ecological flows derived but not implemented but there are plans to do so in 2ndcycle |
All RBDs: DK Some RBDs: UK (Northern Ireland), BE (1 RBD), FI (7 mainland RBDs) |
|
|
Ecological flows not derived but there are plans to do so in 2ndcycle |
All RBDs: LV, LU, MT, SK, HR Some RBDs: BE (7 RBDs), BG (3 RBDs), IT (5 RBDs), PL (1 RBD), PT (1 RBD) |
|
|
Ecological flows not derived and no plans to do so in 2nd cycle |
DE (3 RBDs), FI (1 RBD), IT (1 RBD), PL (1 RBD) |
|
Source: (EC, 2019b)
Note: For some of the RBDs, where there is no intention to derive ecological flows, this is due to the fact that no river water bodies are reported
Box 4.3 Indicators for defining sustainability in water use
Setting a global threshold in identifying sustainable use of water resources is a scientifically challenging topic. For the time being, overall, three different indicators are widely implemented in defining whether actual water use is sustainable or not. These indicators are:
- environmental flows indicating critical stages and discharges. In principle, methods for defining e-flows can be classified in four major categories: hydrological methods; hydraulic rating; habitat simulation models; and holistic methodologies (Zeiringer et al., 2018). An inventory by Ramos et al. (Ramos et al., 2018) reveals that in most cases where environmental flows have been derived were mainly developed based on hydrological methods. This means a static or dynamic fraction of the mean annual flow is defined as environmental flow without making an explicit link with ecological variables. Also, most of the respondents do not differentiate the environmental flows between dry and normal years. Critical stages/discharges of rivers and artificial canals; environmental flows (e-flows), defined as minimum flow requirements using hydrological and hydro-ecological methods (EC, 2016)
- Critical levels of water stress e.g. Water exploitation index (Raskin and Gleick, 1997). The indicator takes 20 % of water abstraction from water availability in the environment as indication to water stress.
- Critical levels of droughts, applying a set of available drought indicators (e.g. SPI)
In 2012, the Roadmap to a Resource Efficient Europe (EC, 2011a) set out as a key goal that the volume of water abstraction should decrease below the threshold of 20% of renewable freshwater resources. The threshold of 20 % is commonly proposed in literature (Raskin and Gleick, 1997) and commonly applied in relevant studies to distinguish sustainable from unsustainable levels of water abstraction, use or consumption([4]). Currently, the above objective is not attained in many river basins, especially in southern Europe, and relevant water stress issues are foreseen to amplify in the future. Furthermore, under the UN SDG 6.4.2, FAO has set a similar threshold of 25 % for defining unsustainable management.
JRC has used the LISFLOOD model and applied a hydrological method for the estimation of potential environmental flows in European rivers (Grizzetti et al., 2017). The study shows that, without any abstraction, large areas in southern, western and southern Europe could have 50 to 90 % less days of significantly low discharges in their rivers (see yellow, orange and red areas in Map 4.4).
Map 4.4 Ratio of the number of days with significantly low discharges without and with water abstractions
Source: (Grizzetti et al., 2017)
Note: “significantly low discharges” describes the discharges falling below the Q10 threshold, i.e. the value of the flow that is not exceeded only in 10 % of the time
4.10. Measures for the management of water demand and supply
Boosting circular economy and improving resource efficiency to achieve decoupling between the use of resources and population or economic growth is a key policy objective of the European Green Deal for sustainable development. Although water is not explicitly mentioned in the Green Deal, the same policy guidelines are also relevant for the water domain. Economic growth and increase in population lead, in principle, to increases of water use, unless this is counteracted by increasing water use efficiency. For example, the invention and installation of more efficient appliances in households, agricultural holdings, industrial facilities and energy plants can decrease their water use. In 2007, it was estimated that there is a significant water saving potential (around 40 % on average) across all economic sectors in Europe until 2030 (Dworak et al., 2007), but higher investments were needed to unlock it.
Strategies to combat water stress are similar for most economic sectors, if considered at a sufficiently abstract level, and can be divided broadly into four categories (see Box 4.5). The water hierarchy (EC, 2007) promotes the consecutive measures to be investigated from top to bottom.
Box 4.4 Principal strategies for managing water stress
- Reduce water demand
- Reduce losses in the supply system
- Reduce losses during use
- Raise awareness
- Economic measures
- Apply more water-efficient technologies
- Select products for their low water demand
- Store water temporarily during water-abundant times
- In surface reservoirs
- In aquifers
- Accept shortage, focus on dealing with its consequences
- Increase water availability or water supply
- Re-use wastewater
- Desalinate brackish or salt water
- Only if no other options are left: transfer water from water-rich to water-stressed locations
- Transfer water from water-rich to water-stressed locations
- In subsurface aquifers
Measures are more sector-, time- and region-specific than strategies, but in all economic sectors they can be grouped in five types (see Box 4.6). Shifting sectorial water management towards a more sustainable paradigm entails a series of challenges, because of the trade-offs between making a sector less water intensive and keeping up its production levels. The broad challenge, similar for all types of water use, is to link water resources, resource efficiency and ecosystem conditions (thus, addressing the need for ecosystem-based management) in an integrated water resource management approach or a nexus approach. As a general rule, more sustainable water management will need to rely more on water demand management, supply from alternative water resources, circular and nature-based solutions.
Box 4.5 Types of measures for water scarcity management
- Structural measures
- Economic measures
- Legislative measures
- Adaptive measures: redistribution of risks and impacts
- Education and public awareness raising
Figure 4.14 provides a DPSIR overview schema of Drivers, Pressures and Impacts related to the state of water resources and main types of Responses for their management. Water abstraction is identified as a key pressure within this context.
Figure 4.14 DPSIR framework in assessing water cycle between environment and economy
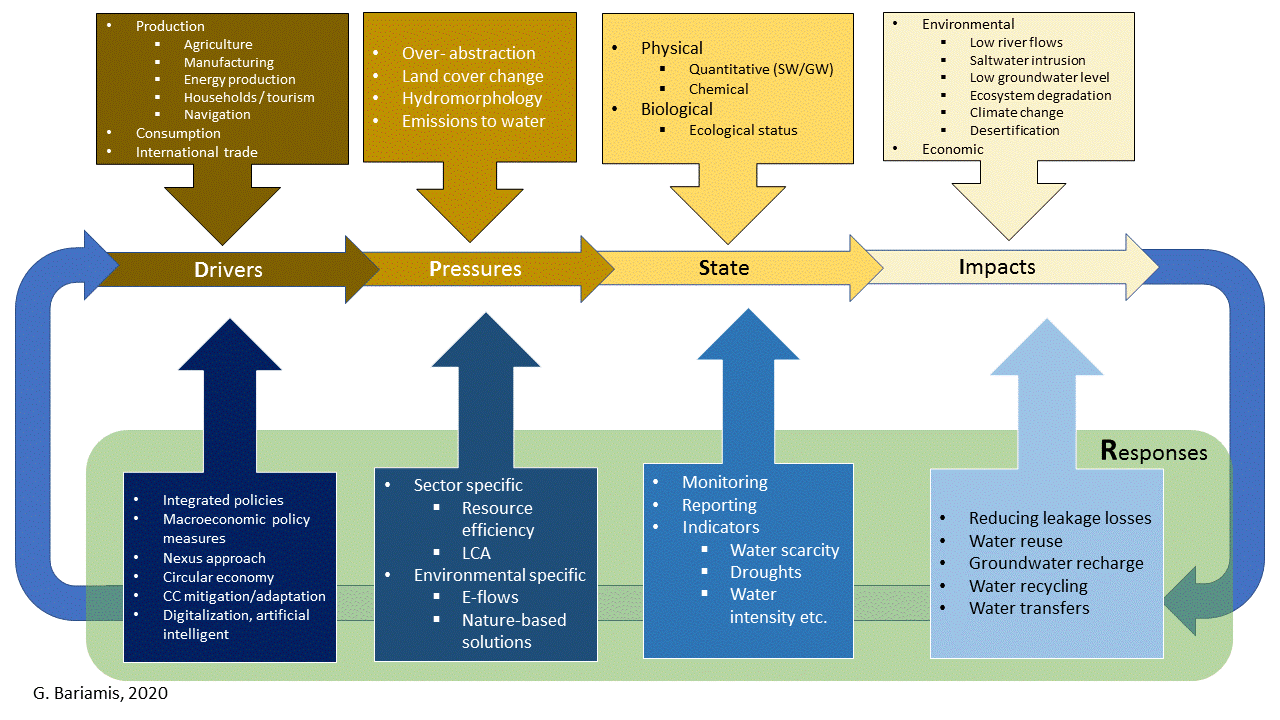
Source: George Bariamis and Alexander Psomas
EU Member States are planning and implementing a wide variety of measures to tackle different aspects of water stress, as part of their national programmes related to the implementation of the WFD. Similar measures are also planned and implemented in non-EU countries which are cooperating with the EU and implementing legal frameworks similar to the WFD. The different measures could be categorised as follows (Buchanan et al., 2019):
- establishment of water balances and water accounts;
- establishment of environmental flows (e-flows);
- permitting, registration and control of water abstraction;
- establishment of pricing mechanisms promoting cost recovery and sustainable water management;
- diversification of water sources, including the use of non-conventional water resources;
- establishment of water saving and water use efficiency schemes;
- augmentation of water supply, including new storage and diversions, land use planning and natural water retention.
A review of outcomes from the Compliance assessment of the 2nd RBMPs, the Integrated assessment of the 2nd RBMPs and the Blue 2 project is provided in below.
Water storage and natural water retention measures
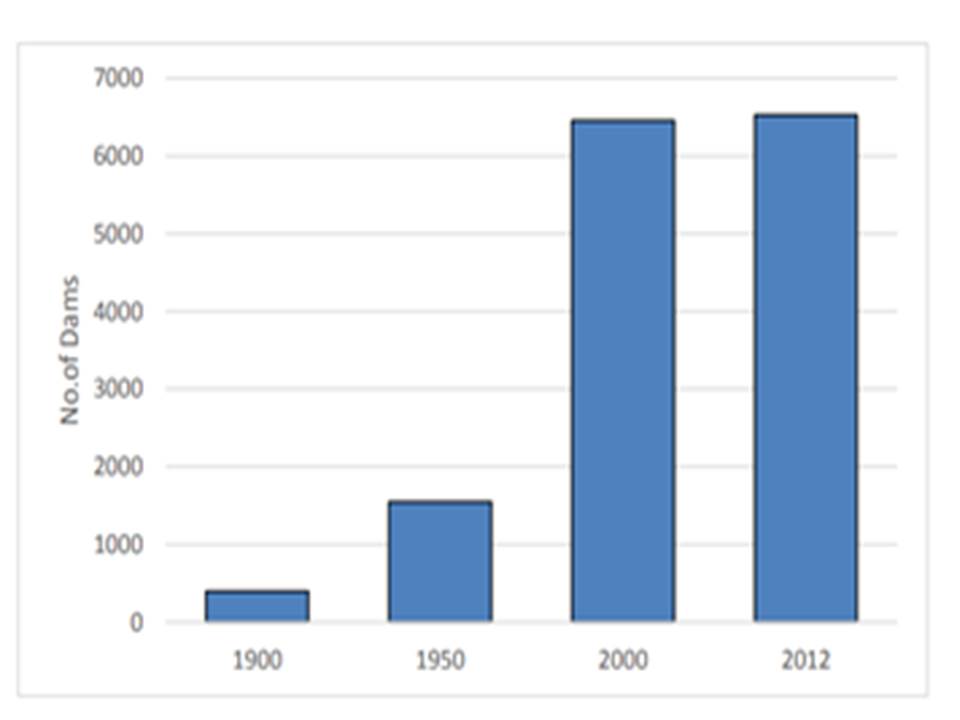
Since the early 1900s dams have been constructed in a rapid rate across European rivers (Figure 4.15), advocated by the need to supply drinking and agricultural water and produce hydropower. The break-down of the reservoir water storage in Europe is 38% for the Mediterranean region, 30% for the Atlantic region, 20% for the Continental region, and 12% in the rest regions (EEA, 2018b). After 2000, the WFD provisions have provided a stricter framework for the justification and construction of dams. Nevertheless, despite their overall alignment with the above policy lines, several EU Member States (e.g. France, Greece) have reported their intention to further construct supply-oriented measures, such as reservoirs or diversions (inter-basin transfers), because they consider (whether or not correctly justified) that these measures could contribute to various goals, including water and energy security, adaptation to climate change, achievement of ecological flows in water-stressed aquatic ecosystems and protection of over-exploited groundwater bodies from further deterioration (Buchanan et al., 2019).
The RBMPs of the various EU Member States have not exploited fully the potential of water retention measures. The links between urban planning and water management have rarely been highlighted. National policies related to territorial planning and economic development plans could promote these approaches more in the future (Buchanan et al., 2019) (see section 6.2).
Non-conventional water supply measures
Water reuse
Water reuse represents a very low share of total water consumption in Europe, and it is mainly practiced in southern Europe (e.g. Cyprus, Malta, Spain) (Figure 4.16). Most reuse schemes target at generating alternative water supplies for irrigated agriculture or achieving managed aquifer recharge to mitigate saline intrusion in coastal areas (Buchanan et al., 2019). The European Commission aims at promoting water reuse further with its recently published regulations and guidelines(EC, 2020f, 2018a), which complement pre-existing regulatory legal frameworks in some Member States. It has been estimated that there is much higher potential for water reuse in Europe. In areas with significant intensity of agricultural activities, water reuse could help reduce water stress levels by an increment of 10%. The treatment and energy costs for water reuse are rather low compared with the total costs for developing the necessary infrastructure to carry reclaimed water from urban waste water treatment plants to irrigated areas. As these costs are highly variable, the economic attractiveness of reclaimed water for farmers may differ significantly. However, there are examples (e.g. Cyprus) where an incentive pricing policy is applied to promote water reuse further (JRC, 2017)
Figure 4.16 Water reuse potential per EU Member State (in Mm3 per year) for different levels of production cost
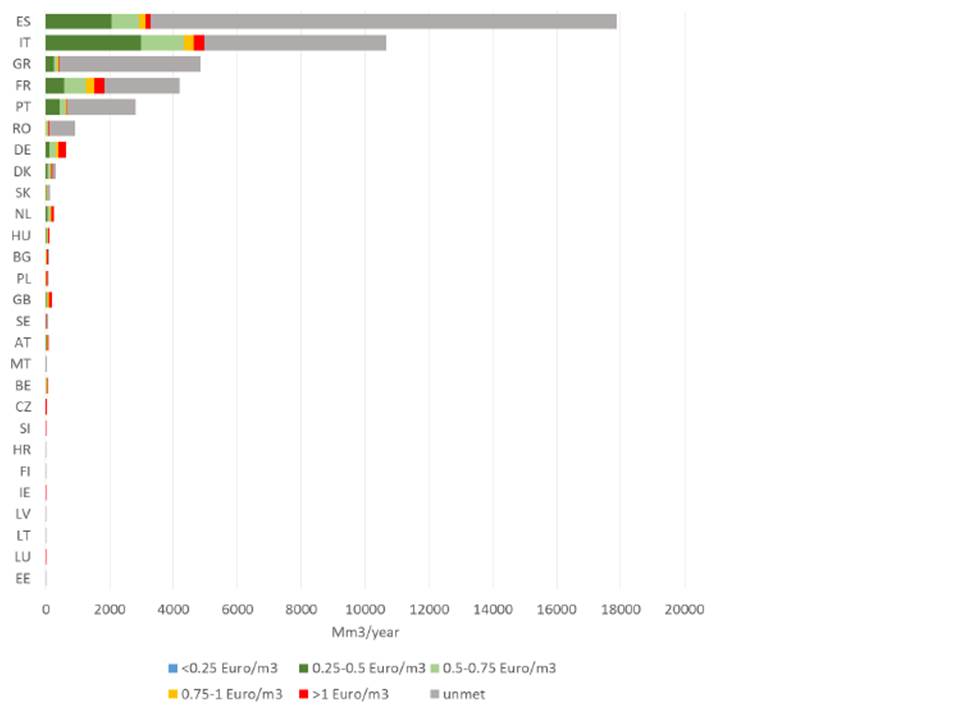
Source: (JRC, 2017)
Note: Amounts of reclaimed water that can be potentially deployed at different total costs for 27 Member States of the EU (Cyprus not included due to missing irrigation estimates). “Unmet” represents irrigation demand estimated for the Country, in excess of potential supply of reclaimed water.
Desalination
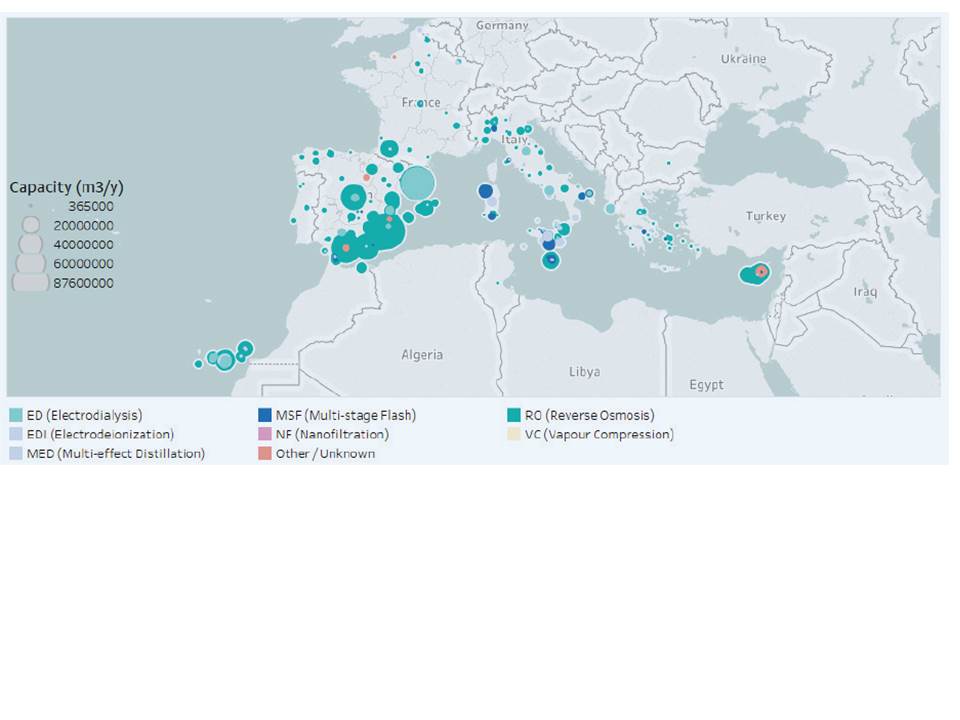
In addition, desalination has been mainly applied for drinking water purposes, but not exclusively for that. Currently, the highest share of the installed desalination capacity in Europe lies in the Mediterranean (Map 4.4). Under serious water stress conditions, desalination is becoming a more affordable and reliable option than other solutions for water supply (Hidalgo González et al., 2019) (Figure 4.17). The relevant costs have decreased significantly over the last decades, and for reverse osmosis of sea water in the Mediterranean they could be around 0.65 €/m3 (World Bank, 2019). For brackish waters the costs could be lower. However, desalination is associated with significant environmental problems such as brine disposal, energy use and CO2 emissions.
Figure 4.17 Volume and energy used during desalination of water supplied to various end-users
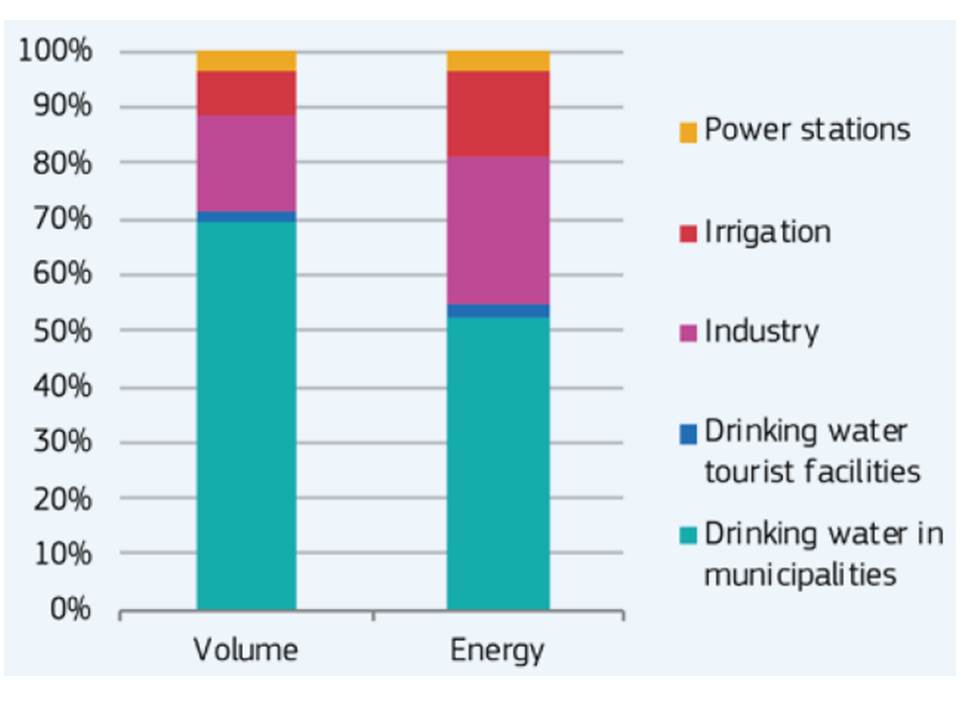
Source: (Hidalgo González et al., 2019)
Demand side measures
Water addressing water stress through tackling water efficiency have been in place for decades. Their implementation has been driven by climate and environmental policies followed in different Member States, and the needs for higher economic efficiency of water providers (e.g. increasing economic profits of water utilities). Southern Member States, where water stress is perceived as an acute and chronic issue, have planned and implemented such measures as part of their pre-WFD water strategies, as well as part of their RBMPs for the WFD. The WFD has placed even more emphasis on such water-demand measures. However, there are several Member States e.g. from the Baltic), where water stress in the context of climate change is not perceived as a significant feature in their RBMPs, and the planning of such measures is weaker (Buchanan et al., 2019)
[1] Calculated as the ratio of the total water consumption (i.e. abstraction – returns) from all socio-economic sectors and the total population in EEA 38+UK
[3] Calculated as the ratio of the total volume of household water consumption and the total population in EEA 38+UK